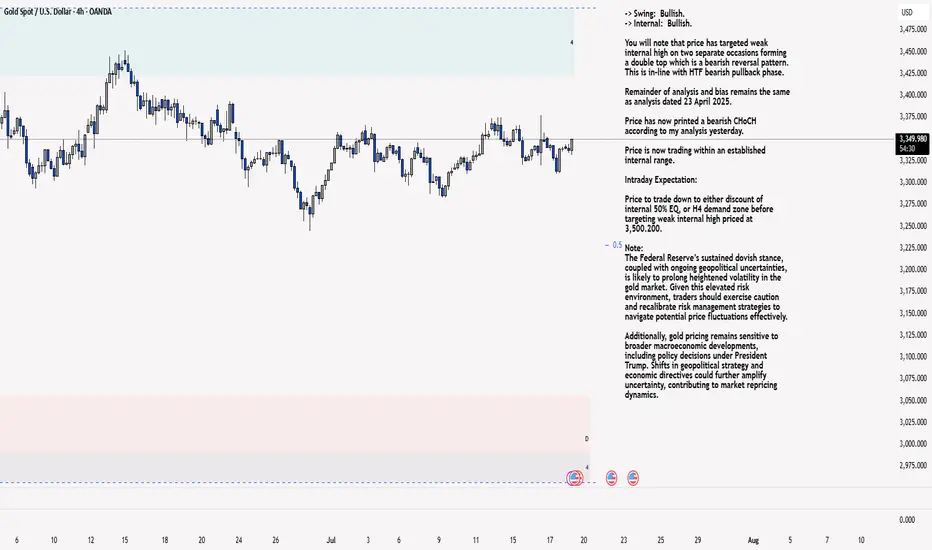
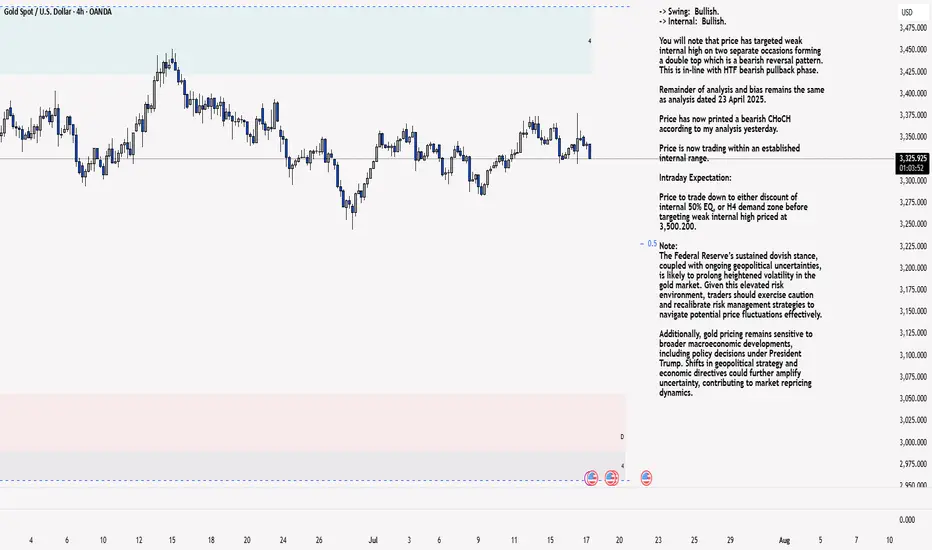
XAU/USD 18 July 2025 Intraday AnalysisH4 Analysis:
-> Swing: Bullish.
-> Internal: Bullish.
You will note that price has targeted weak internal high on two separate occasions forming a double top which is a bearish reversal pattern. This is in-line with HTF bearish pullback phase.
Remainder of analysis and bias remains the same as analysis dated 23 April 2025.
Price has now printed a bearish CHoCH according to my analysis yesterday.
Price is now trading within an established internal range.
Intraday Expectation:
Price to trade down to either discount of internal 50% EQ, or H4 demand zone before targeting weak internal high priced at 3,500.200.
Note:
The Federal Reserve’s sustained dovish stance, coupled with ongoing geopolitical uncertainties, is likely to prolong heightened volatility in the gold market. Given this elevated risk environment, traders should exercise caution and recalibrate risk management strategies to navigate potential price fluctuations effectively.
Additionally, gold pricing remains sensitive to broader macroeconomic developments, including policy decisions under President Trump. Shifts in geopolitical strategy and economic directives could further amplify uncertainty, contributing to market repricing dynamics.
H4 Chart:
M15 Analysis:
-> Swing: Bullish.
-> Internal: Bullish.
H4 Timeframe - Price has failed to target weak internal high, therefore, it would not be unrealistic if price printed a bearish iBOS.
The remainder of my analysis shall remain the same as analysis dated 13 June 2025, apart from target price.
As per my analysis dated 22 May 2025 whereby I mentioned price can be seen to be reacting at discount of 50% EQ on H4 timeframe, therefore, it is a viable alternative that price could potentially print a bullish iBOS on M15 timeframe despite internal structure being bearish.
Price has printed a bullish iBOS followed by a bearish CHoCH, which indicates, but does not confirm, bearish pullback phase initiation. I will however continue to monitor, with respect to depth of pullback.
Intraday Expectation:
Price to continue bearish, react at either M15 supply zone, or discount of 50% internal EQ before targeting weak internal high priced at 3,451.375.
Note:
Gold remains highly volatile amid the Federal Reserve's continued dovish stance, persistent and escalating geopolitical uncertainties. Traders should implement robust risk management strategies and remain vigilant, as price swings may become more pronounced in this elevated volatility environment.
Additionally, President Trump’s recent tariff announcements are expected to further amplify market turbulence, potentially triggering sharp price fluctuations and whipsaws.
M15 Chart:
Multiple Time Frame Analysis
USDCAD: Bearish Move From Resistance 🇺🇸🇨🇦
USDCAD is going to retrace from a key daily resistance.
A bearish imbalance candle that the price formed after its test
during the Asian session provides a strong intraday bearish confirmation.
Goal - 1.3707
❤️Please, support my work with like, thank you!❤️
I am part of Trade Nation's Influencer program and receive a monthly fee for using their TradingView charts in my analysis.

EURJPY ANALYSISAfter seeing that the previous daily candle could not trade below the moving averages and had a retracement to the upside it will be a good idea to wait and see how the pair trades before executing in a specific direction

Has the DXY got you confused? Well, check out this analysis.Welcome back, traders, it’s Skeptic from Skeptic Lab! 😎 , the DXY has entered a corrective phase over the past weeks. In this analysis, I’ve broken down the technicals and chart with a skeptical eye, outlined long and short triggers on the 4h timeframe , and tried to give you a solid multi-timeframe view of the setup. At the end, I’ve shared a key educational tip that can seriously boost your win rate and R/R , so make sure you check out the full analysis.
💬If you’ve got a specific symbol in mind for analysis, drop it in the comments. Have a profitable Friday, fam <3

AUDJPY - POTENTIAL?USDJPY is getting super interesting.
If we can get some bearish intent to try and induce the early sellers to the downside creating some buyside liquidity then i will be all over this for a trade.
Lets see how price has moved by the morning as it does need a bit more development before we can consider entering for a short position

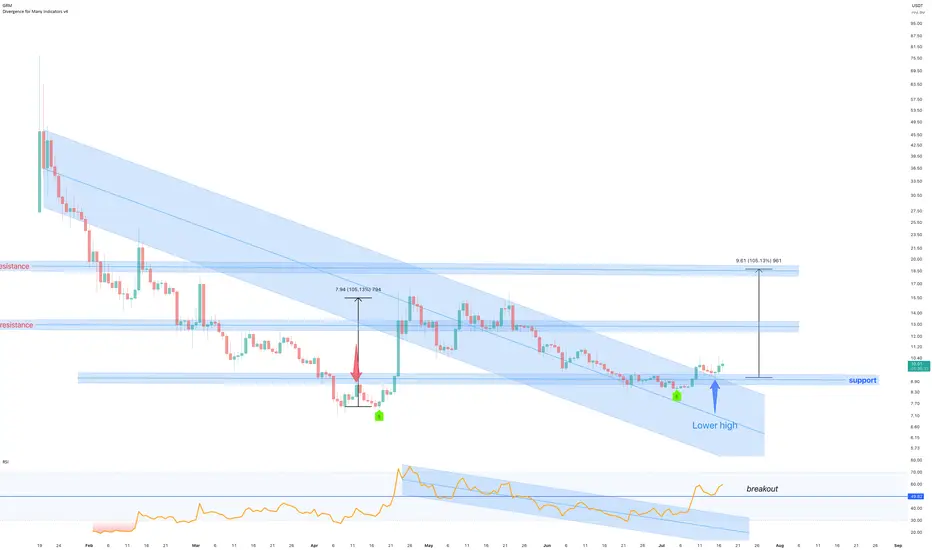
July 2025 - 100% Trump token move to $18 before October"Trump token, it's gonna be huge, believe me. We're talking about a tremendous move, a total win, unlike anything you've ever seen. The fake news, they won't tell you but this token it's exploding. It's happening folks everyone knows it, everyone is talking about it."
Alright, enough of that...
On the above 1 day chart price action has corrected 45% since the month of April. The chart now displays a compelling technical setup for a 100% move to $18.
Bullish Arguments:
Support and resistance
Price action and Relative Strength Index (RSI) breakout from downtrend resistance. Price action also confirms support on past resistance (red / blue arrows).
The trend
A higher low print is confirmed with the downtrend resistance breakout. The RSI also mirrors this trend reversal with a higher low print.
Divergence
Look left. Five oscillators now print positive divergence with price action.
Conclusions
The downtrend clearly now shows signs of reversal. The next two resistance levels are shown, beyond that is unknown until the upper resistance confirms support. Not expected to occur in this market cycle.
Is it possible price action continues to print lower highs? Sure.
Is it probable? No.
Ww
GBPJPY ENTRY CHARTOn this Pair, we are still BEARISH, as its strength shifted yesterday, JPY is gaining STRENGTH, also we have a DAILY BEARISH CLOSE, we have a CHOCH on the HOURLY, ewith a LTF CONFIRMATION, with other confluences on this pair, you can add to your watch-list,if this matches with your idea, and don't forget to apply a good risk on this idea, and dont forget the rules of moving B.E after +1r

GBPAUD: Pullback From Resistance 🇬🇧🇦🇺
I think that GBPAUD may pull back from a key intraday resistance.
As a confirmation, I see a bearish engulfing candle after its test
on an hourly time frame.
Goal - 2.0655
❤️Please, support my work with like, thank you!❤️
I am part of Trade Nation's Influencer program and receive a monthly fee for using their TradingView charts in my analysis.

Pre-Market Prep
Today, I'm narrowing down to six key markets. For the S&P, it's all about waiting for a pullback from the prior day's high or a breakout above the CVA. If it dips back inside the range, I'm ready to go short with some scalps.
For the NASDAQ, it's looking strong. I'm thinking about a long position if it pulls back to the prior day's high.
Gold is in a downtrend across all areas, and I'm already in a short position from the CVA low. I'm thinking about adding to that if it pulls back to the prior day's low.
Crude Oil is pretty balanced. I'm looking at the high of the CVA for a short opportunity if it gets there.
For the Yen and Euro, both are rotational. I'm eyeing long opportunities if they show some acceptance and pullbacks from key levels.
That's the vibe for today. Let's trade smart, avoid the chop, and keep it moving. Peace!

Waiting for the Break: 3375 or 3320 Will Decide the Next 1k Pips📉 Quick recap:
As you know, I've been bullish on Gold. However, as explained in yesterday’s analysis, I started to approach this view with more caution. Unfortunately, I closed my long position at break even… before the rally to the 3375 resistance. That’s trading.
📌 What now?
Despite missing that move, the market is beginning to offer more clarity. There are now two key levels that will likely define the next major swing:
________________________________________
🔹 1. Resistance at 3375 – Top of the Range / Triangle Breakout Zone
• This level marks the upper boundary of the recent range
• It’s also the resistance of a developing ascending triangle
• A clean breakout above 3375 would confirm the pattern and could trigger a strong upside acceleration
• Target: 3450 zone, with potential for more if momentum kicks in (approx. 1000 pips higher)
➡️ This is the obvious bullish scenario – in line with the broader trend and classical technical setup.
________________________________________
🔻 2. Support at 3320 – The Less Obvious, but Classic Gold
• 3320 is now a confluence support area
• Technically, a break below here is less probable – but Gold has a habit of doing the unexpected
• If 3320 breaks, bears could look for a first leg to 3280 (approx. 400 pips), and very probably 3250 (around 700 pips drop)
➡️ This bearish scenario is not the base case, but it must not be ignored. Sometimes the trap is in the obvious.
________________________________________
🧭 Trading Plan:
For now, I’m out of the market, patiently waiting for confirmation. I’ll trade the breakout – whichever side gives the signal first.
________________________________________
📌 Conclusion:
Gold is coiling for a larger move. The levels are clear: 3375 and 3320 are the doors. One of them will open. Until then, we wait and prepare. 🚀
Disclosure: I am part of TradeNation's Influencer program and receive a monthly fee for using their TradingView charts in my analyses and educational articles.

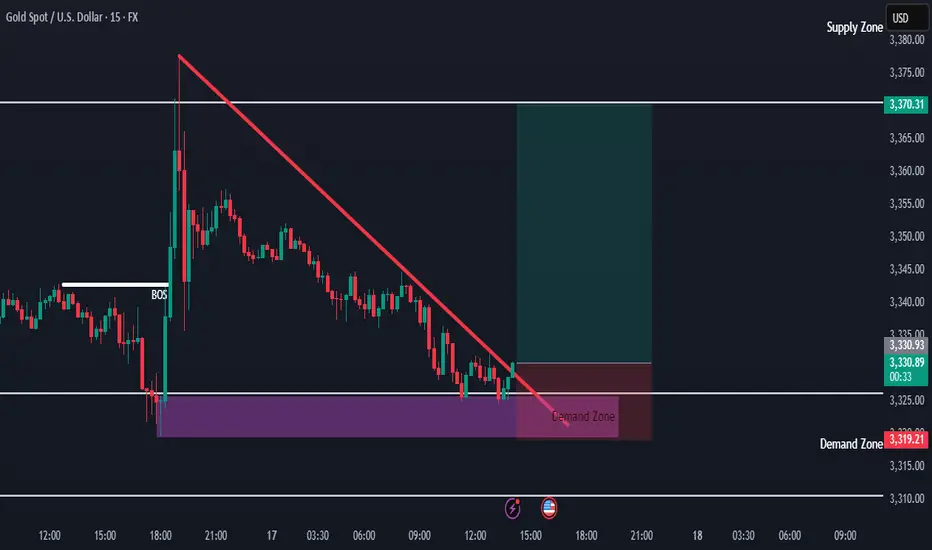
Gold Ranging Between HTF Zones — Buy Setup FormingHello everybody!
Price is fluctuating between two higher timeframe supply and demand areas.
The market structure on the lower timeframes changed yesterday, and now we’re watching to see if the newly formed small demand zone will hold.
The break of the downward trendline is our signal to enter a buy position.
SHORT ON USD/JPYNice CHOC (Change of Character) on USD/JPY
Followed by a retest to the supply area/zone with massive wick rejection.
I will be selling USD/JPY looking to catch over 200 pips to the next level of support/demand.

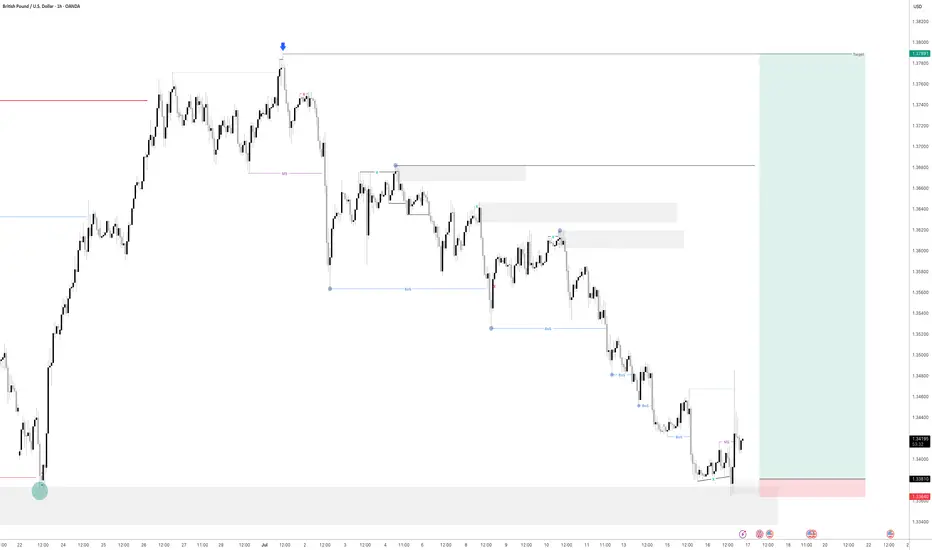
Raid to the Buyside Liquidity [GBPUSD]Looking at the left side, we see a recent sell-side liquidity sweep . Following, is a strong upward movement, resulting in a market structure shift . Price retraces back to the unmitigated demand zone, to mitigate it for an execution of a Buy position. Target is the buyside liquidity

XAU/USD 17 July 2025 Intraday AnalysisH4 Analysis:
-> Swing: Bullish.
-> Internal: Bullish.
You will note that price has targeted weak internal high on two separate occasions forming a double top which is a bearish reversal pattern. This is in-line with HTF bearish pullback phase.
Remainder of analysis and bias remains the same as analysis dated 23 April 2025.
Price has now printed a bearish CHoCH according to my analysis yesterday.
Price is now trading within an established internal range.
Intraday Expectation:
Price to trade down to either discount of internal 50% EQ, or H4 demand zone before targeting weak internal high priced at 3,500.200.
Note:
The Federal Reserve’s sustained dovish stance, coupled with ongoing geopolitical uncertainties, is likely to prolong heightened volatility in the gold market. Given this elevated risk environment, traders should exercise caution and recalibrate risk management strategies to navigate potential price fluctuations effectively.
Additionally, gold pricing remains sensitive to broader macroeconomic developments, including policy decisions under President Trump. Shifts in geopolitical strategy and economic directives could further amplify uncertainty, contributing to market repricing dynamics.
H4 Chart:
M15 Analysis:
-> Swing: Bullish.
-> Internal: Bullish.
H4 Timeframe - Price has failed to target weak internal high, therefore, it would not be unrealistic if price printed a bearish iBOS.
The remainder of my analysis shall remain the same as analysis dated 13 June 2025, apart from target price.
As per my analysis dated 22 May 2025 whereby I mentioned price can be seen to be reacting at discount of 50% EQ on H4 timeframe, therefore, it is a viable alternative that price could potentially print a bullish iBOS on M15 timeframe despite internal structure being bearish.
Price has printed a bullish iBOS followed by a bearish CHoCH, which indicates, but does not confirm, bearish pullback phase initiation. I will however continue to monitor, with respect to depth of pullback.
Intraday Expectation:
Price to continue bearish, react at either M15 supply zone, or discount of 50% internal EQ before targeting weak internal high priced at 3,451.375.
Note:
Gold remains highly volatile amid the Federal Reserve's continued dovish stance, persistent and escalating geopolitical uncertainties. Traders should implement robust risk management strategies and remain vigilant, as price swings may become more pronounced in this elevated volatility environment.
Additionally, President Trump’s recent tariff announcements are expected to further amplify market turbulence, potentially triggering sharp price fluctuations and whipsaws.
M15 Chart:
gold sellsGold sells from 3340
Trying to flow with price
Idk what else to write lol tradingview keeps saying its a brief description
closed at 3332


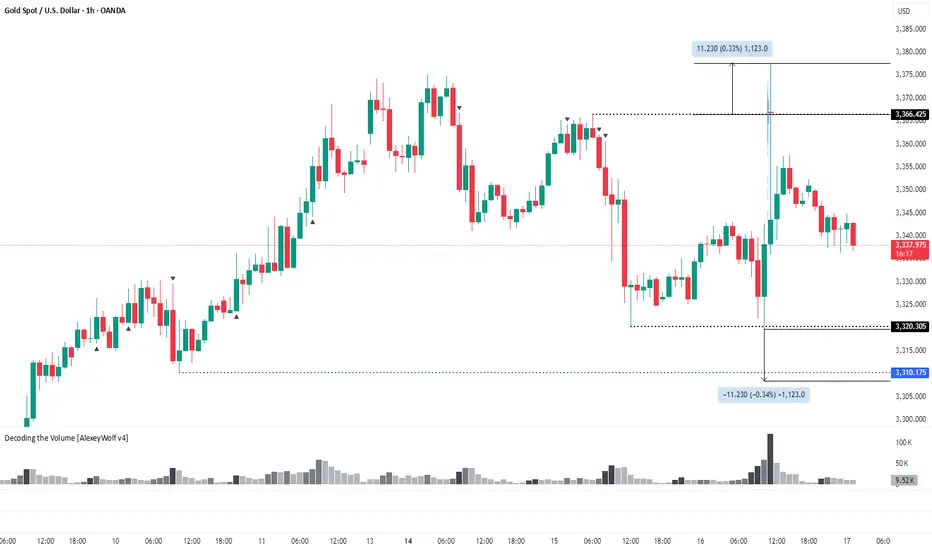
Gold. Where to look for buy setupsHi traders and investors!
The price is currently in a sideways range, with the boundaries marked by black lines.
Sellers defended the buyer's first attempt to break through the 3366 level — the key volume in the candle that touched this level was accumulated exactly at that point.
Now, it would be ideal to symmetrically expand the range downward by 11.230 points, which would bring the price right to the 3310 level.
From the 3310 level, it makes sense to look for potential buy patterns.
This analysis is based on the Initiative Analysis concept (IA).
Wishing you profitable trades!
XAU Trade IdeaGold still bullish after yesterday's gingantic move?
Retracement to OTE + OB while sweeping Asian Low targeting yesterday's high and beyond!

GBPUSD ANALYSIS After seeing the market react to key are of support yesterday and a retrace of a 100% on the Fibonacci seller are still in control of the market a break below support and retest for further sells could occur

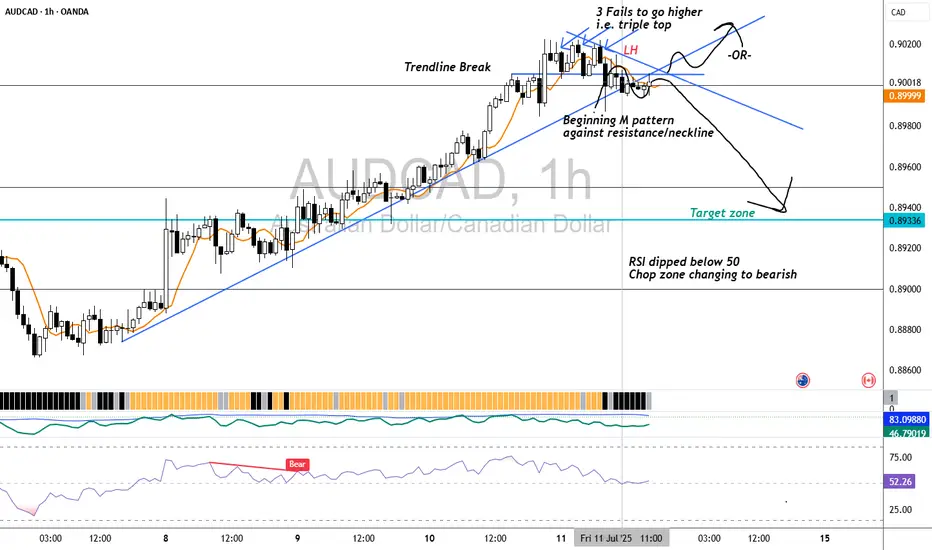
AUDCAD H1 BearishFactors of confluence in favor of short
1. Daily resistance zone 0.90432
2. Triple top
3. M pattern against resistance
4. RSI dipped below 50
5. Chop Zone change to bearish
6. Break of trendline
7. 3.5 R/R
8. Removal of liquidity zone on daily chart(prior high)
Risks
1. No LL yet
2. 2nd time back to daily resistance zone- may break through to upside
3. Price to return to congestion zone above for more consolidation before choosing a direction
4. Possibility to resume upwards momentum
GBPAUD BUY LOW OF THE RANGE (BLSHS)Price is in 3 month trading range, price attempted breakout in either direction but failed multiple times.
In a Trading Range we Buy Low Sell High Scalp (BLSHS).
- Upper Range is at (2.10379 - 2.09843).
- Low of the Range at (2.05636 - 2.04819) where price is currently at.
- Price formed a new higher low at 2.07375 showing buyers coming.
- Price was rejected strongly at the low of the range and formed RSI Divergence at the level signaling a reversal the upside.
- AUD employment data released today at 4:30AM if negative price will breakout strongly
Stop loss below the new higher low at 2.07375 or below the setup at 2.04423.
Take profit at 2.07045 or at the top of the range at (2.10379 - 2.09843).

NZDUSD SHORTMarket structure bearish on HTFs DH
Entry at both Weekly and Daily AOi
Weekly Rejection at AOi
Daily Rejection at AOi
Daily EMA retest
Previous Structure point Daily
Around Psychological Level 0.60000
H4 EMA retest
H4 Candlestick rejection
Rejection from Previous structure
Levels 3.93
Entry 105%
REMEMBER : Trading is a Game Of Probability
: Manage Your Risk
: Be Patient
: Every Moment Is Unique
: Rinse, Wash, Repeat!
: Christ is King.

GBPUSD - Is it Ready? Looking at GBPUSD
We have had a Market shift to the upside from a HTF Point of Interest. I am now waiting for price to come back into a 15min demand area and hopefully price will take off to the upside from here.
We have also swept liquidity before a drastic move to the upside.
Lets see how this one plays out