Preponderance of (or Preposterous?) Evidence
I was just proposing yesterday staying neutral in SPY (the S&P 500 ETF). The FOMC meeting today (Jun 18th) was a big-nothing burger (so far), which supports my (non)position, but we'll see. I will update that post when the time is right (ATH, 200dma, or bust).
Today, though, the IWM (the Russell 2000 Small Cap Index ETF) and, surprisingly, a potential short position.
First, the IWM (see below) is overbought on a weekly chart, with the Stochastics being above 80 (more on Stochastics and weekly charts at a later date). For now, let's go with IWM being a little overbought, in the longer-term view.
Now, let's switch to the big daily chart at the top and look at the evidence for going short;
- IWM never really got above it's 200-day moving average (purple line),
- That same level was consistent with a lot of resistance ~213 (yellow circles),
- IWM has trailed this whole rally.
- It has broken and somewhat retested a trendline (light blue) from this most recent rally,
- It bounced off it's 61.8% Fibonacci level (orange line, not my favorite indicator for ETFs, but I often sneak a peek),
- It's at its previous resistance high around 209 (blue circles).
On the not-bearish side;
- The daily chart is less overbought (this has to happen on weakness, though),
- There's (a little) support at 199 but not really again until 172,
- I still feel like the All-Time-High (ATH) is a magnet for the S&P (but IWM has trailed).
That's (a lot) more (and better) points for being bearish.
I'll go short (via a ~90 day ITM put position*) if IWM breaks below 207.50, between that and 202. If it opens lower than 202, I'll wait for a pull-up.
The stop will be a close above the 200 day.
The target is 172 (the previous tariff low), but I will lighten/tighten up (by selling OTM puts* and/or moving stop down) as IWM drops (if it drops).
It may seem a bit duplicitous to be neutral on SPY while being bearish on IWM.
But sometimes you have to go with the Preponderance of Evidence (or will it prove Preposterous Evidence?)
An update will be coming.
*Sorry for bringing up options. One can just go short IWM. I will explain my option choice one day.
My ideas here on TradingView are for educational purposes only. It is NOT trading advice. I often lose money and you would be a fool to follow me blindly.
Multiple Time Frame Analysis

EURUSDHello, I hope you have a good day ❤
Please don't forget to support us so that our activities can continue!🚀
The trend of the above times is completely upward and this move is not far from expected.
But since it is the first week of the new month, be sure to observe capital management.
Be profitable💲💎

Skeptic| Cycle Mastery Part 1: HWC, MWC, LWC for Smarter TradingUnderstanding Higher Wave Cycle ( HWC ), Minor Wave Cycle ( MWC ), and Low Wave Cycle ( LWC ) is the key to making informed trading decisions, simplifying when to go long , short , or stay out . This Part 1 masterclass introduces these cycles, their relative nature, and how to align them with your strategy for precise entries and effective risk management . Let’s break it down. 📊
The Three Cycles: HWC, MWC, LWC
We trade across three market cycles:
HWC (Higher Wave Cycle) : The big-picture trend, like Bitcoin’s yearly uptrend.
MWC (Minor Wave Cycle): A medium-term trend, often an uptrend or corrective phase within the HWC.
LWC (Low Wave Cycle): The short-term daily trend, which can be range-bound, uptrend, or downtrend.
Knowing these cycles helps you decide when to e nter long, short, or avoid trading altogether, ensuring you align with the market’s rhythm.
Defining Your Cycles: It’s Relative
The main question before diving in: What timeframes are HWC, MWC, and LWC? The answer is relative—it depends on your strategy. Think of it like a temperature scale: 0°C isn’t “no heat” but a reference point (water’s freezing point). Similarly, your cycles are defined by the largest timeframe you analyze:
HWC: Your highest timeframe (e.g., Weekly for long-term traders).
MWC: The next level down (e.g., Daily).
LWC: Your shortest timeframe (e.g., 4-Hour or 1-Hour).
Ask yourself: What’s the largest timeframe I check? Set your HWC there, then scale down for MWC and LWC based on your trading style. This relativity ensures your cycles fit your unique approach.
While shorter cycles (LWC, MWC) form the HWC, the HWC’s power dominates, influencing smaller cycles. Let’s explore how to trade based on these relationships.
Trading Scenarios: When to Act
Scenario 1: HWC Uptrend, MWC Range
When the HWC is in an uptrend and the MWC is range-bound:
Action: Enter a long position on the first MWC wave when the LWC breaks the ceiling of the MWC range (e.g., a box breakout).
Why? The HWC’s bullish power supports the move, likely triggering an MWC uptrend. This makes the first wave a strong, low-risk entry.
Example: If the LWC (e.g., 4-hour) breaks the MWC range ceiling with a strong candle, you can confidently go long, backed by the HWC uptrend.
Scenario 2: HWC Downtrend, MWC Range
When the HWC is in a downtrend and the MWC is range-bound:
Action: Skip the first MWC wave. If the LWC breaks the MWC range ceiling, avoid going long—the bearish HWC could reject the move, resuming its downtrend.
Wait for the Second Wave: Let the MWC return to a range after the first wave. If the LWC breaks the range ceiling again, go long with confidence—the HWC’s influence is less likely to disrupt this second wave.
Risk Management Tips (if you trade the first wave against the HWC):
Reduce Risk: Lower your position size to minimize exposure.
Take Profits Early: Close the position or secure most profits (e.g., scale out) once you hit your R/R target, as volatility is high.
Wider Stop-Loss: Set a larger stop-loss to account for potential HWC-driven reversals, as stop-loss hunts are common in this scenario.
Adjusting Stop-Loss Size Based on Cycles
Aligned Cycles (HWC, MWC, LWC in Same Direction): When all three cycles align (e.g., all uptrend), set a tighter stop-loss relative to market conditions. Gradually scale out profits instead of closing the position, as the trend’s strength supports higher R/R (e.g., 5 or 10).
HWC Against MWC/LWC: If the HWC opposes the other cycles (e.g., HWC downtrend, MWC/LWC uptrend), use a wider stop-loss. The HWC’s power could reverse the LWC, lowering your win rate if stops are too tight. Expect volatility and plan accordingly.
Final Vibe Check
This Cycle Mastery Part 1 equips you to time MWC waves with precision, aligning HWC, MWC, and LWC for smarter entries. By mastering when to trade the first or second wave, you’ll avoid traps and maximize your edge. Part 2 will dive deeper with examples—stay tuned! At Skeptic Lab, we trade with no FOMO, no hype, just reason. Protect your capital—stick to 1%–2% risk per trade. Want Part 2 or another topic? Drop it in the comments! If this guide sharpened your game, hit that boost—it fuels my mission! 😊 Stay disciplined, fam! ✌️
💬 Let’s Talk!
How will you time your MWC waves? Share your thoughts in the comments, and let’s crush it together!


EU trade breakdown 24th June 2x entryBreaking down two of my positions from Tuesday.
First entry was a very aggressive momentum entry on the flip of a M3 imbalance.
Second entry was fantastic and even though it lost - it was a good trade to take. We had HTF alignment as well as a strong London Low to trade away from.

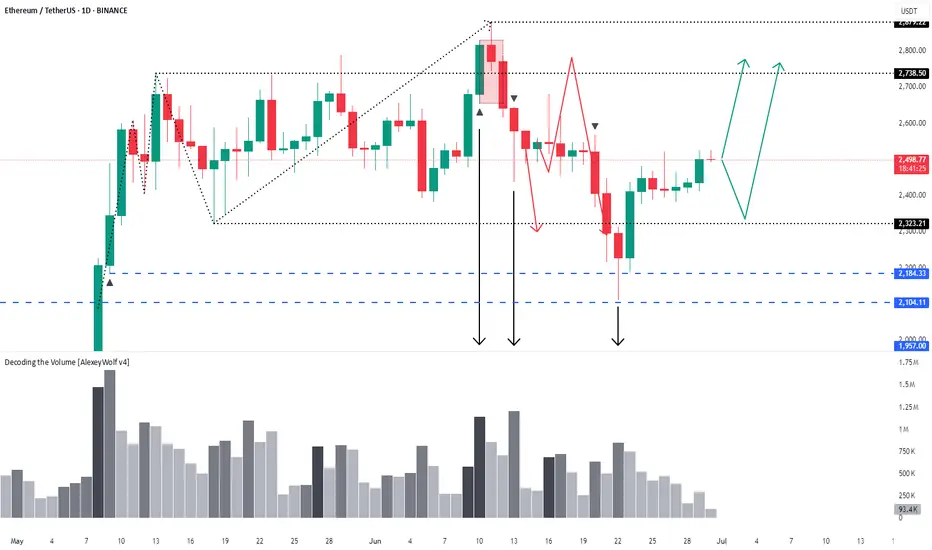
Ethereum – 1D timeframe overview with Initiative AnalysisHey traders and investors!
The seller has reached their target.
A buyer started buying from the 2184 level and now holds the initiative.
Targets are on the chart.
This analysis is based on the Initiative Analysis concept (IA).
Wishing you profitable trades!
$XAUTUSDt 300625 TRADE SETUPWaiting for Price to show its hand, then I'll take a Trade.
Overall 🔺BULLISH; anticipating the PWL to be souped where I will start hunting Entries to LONG.
For Entertainment. Not a Financial/Investment Advice.
What's your view❓

USDJPY 29/06/2025Weekly:
-Bearish W pattern.
-Liquidity sweep.
-Expecting a bearish weekly candle.
Daily:
-Bearish W pattern.
-IC.
4H:
-Bearish W pattern.
-IC.

Stock Index Futures - ES, NQ, YM - Weekly AnalysisS&P 500 / ESU2025
Key drivers:
Rebounding from April’s tariff-induced lows, boosted by optimism around U.S.–China trade, easing geopolitical tensions, and Fed rate‑cut expectations
Market breadth strengthened as sectors beyond mega-cap tech—especially financials and industrials—joined the rally
Nasdaq / NQU2025
Catalysts:
Continued leadership from AI/digital giants like Nvidia (which rose ~4% on Friday and regained its title as the world’s most valuable company) alongside broader tech momentum
Dow Jones / YMU2025
Highlights:
Strongest weekly performance since early April.
Corporate earnings (e.g., Nike’s better-than-expected report) provided sector-specific tailwinds.
Cross‑asset momentum: Equities rebounded strongly from April’s slump, logging back-to-back months of double-digit gains—fuelled by tariff ease, geopolitical calm, and dovish Fed signals.
Vigilance required: While sentiment is strong, potential catalysts include the July 9 deadline on tariff pauses, upcoming jobs data, Fed commentary, and the tax/spending package.
------------------------------------
I will be approaching the markets differently from now on.
Based on the feedback from past analysis, I will be compiling all related pairs into one video, giving you guys the ability to see how one asset affects the other.
This is called inter-market relationship and it's something i've been doing for years.
It gives you confidence on what pairs are 'Hot Picks' and the ones that have a high chance of not delivering the way you want.

Forex Weekly Round-Up - 30th Jun 25Dollar Index:
Dollar Index declined further, hovering near 97.0–96.9 — its weakest level since February 2022.
Key Driver: Markets digested a slightly hotter US core PCE inflation report (+2.3% YoY for May), paired with weak personal spending, reinforcing expectations that the Federal Reserve might pivot to rate cuts later this year.
GBPUSD:
The pound surged, touching highs around 1.3770 — its strongest in nearly four years — before dipping slightly to finish the week near 1.3720
Weekly gain clocked in around +2%, the largest move since early March
Rally Fuelled By : Broader dollar weakness, easing Middle East tensions (ceasefire), and dovish Fed signals suggesting potential rate cuts.
EURUSD
The euro enjoyed a rally, peaking near 1.1754 — its highest since September 2021 — before closing the week around 1.1720
Weekly gain came to approximately +1.7% to +1.9%, driven by euro strength and broad weakness in the US dollar
Traders are eyeing upcoming US data (PCE inflation, Michigan sentiment) for next directional cues
------------------------------------
I will be approaching the markets differently from now on.
Based on the feedback from past analysis, I will be compiling all related pairs into one video, giving you guys the ability to see how one asset affects the other.
This is called inter-market relationship and it's something i've been doing for years.
It gives you confidence on what pairs are 'Hot Picks' and the ones that have a high chance of not delivering the way you want.

US10Y & ZB1! (Bonds) Weekly AnalysisUS 10‑Year Treasury Yield (US10Y)
The 10‑year yield ended last Friday (June 27, 2025) at 4.27%
After peaking above 4.46% mid‑week, yields eased late‑week as markets increasingly priced in potential Fed rate cuts—a 25 bp move in July was seen at 22.7% probability, up from ~14%
This dovish shift, alongside a softer May PCE print, supported a lull in yield increases
Still, Inflation concerns and record debt issuance continue to underpin a term premium on long-duration debt
ZB1 – 30‑Year Treasury Bond Futures
The September‑expiry T‑Bond futures (ZB1) which trade inversely to yield, saw modest price appreciation, reflecting falling yields.
Futures prices responded to the dovish Fed tone and easing global tensions, aligning with stock market gains.
The spread between 10‑ and 30‑year yields widened to ~56 bp—the largest since late 2021—illustrating increased yield curve steepening, mirrored in futures.
------------------------------------
I will be approaching the markets differently from now on.
Based on the feedback from past analysis, I will be compiling all related pairs into one video, giving you guys the ability to see how one asset affects the other.
This is called inter-market relationship and it's something i've been doing for years.
It gives you confidence on what pairs are 'Hot Picks' and the ones that have a high chance of not delivering the way you want.

NASDAQ| - Continuation Setup Fueled by Momentum📌 Pair: NAS100 (NASDAQ)
📈 Bias: Bullish
🕰 HTF View (4H):
Strong bullish momentum unfolding with structure showing clear intent to continue higher. No major signs of reversal—smart money appears to be driving price up.
🧭 MTF View (30M → 2H clarity):
Using the 2H for cleaner narrative. Waiting for a clean sweep of sell-side liquidity (SSL) into a refined OB to continue the move. 30M showing structural alignment with the bullish bias.
🎯 Entry Criteria:
LTF CHoCH → Liquidity sweep → OB mitigation
Confirm the shift and execute on the return.
🎯 Target: Structure highs above
🧠 Mindset Note:
Momentum is your ally—but don’t let speed replace structure. Follow your confirmation sequence, stay surgical, and let price do the work.
Bless Trading!

GBPUSD| - Riding the Bullish Wave with Precision📌 Pair: GBPUSD
📈 Bias: Bullish
🕰 HTF View (4H):
Major external structure (HH) broken to the upside — clear bullish intent from smart money. Strong momentum confirms continued interest in pushing price higher.
🧭 MTF View (30M → 2H clarity):
Refined bullish structure forming on 30M. Using the 2H to filter noise and spot deeper liquidity. Watching closely for a sell-side sweep into OB for cleaner, higher-probability LTF entries.
🎯 Entry Criteria:
CHoCH flip → Liquidity sweep → OB mitigation
Perfect sequence = greenlight for execution.
🎯 Target: Structure highs above
🧠 Mindset Note:
Sometimes the best entries come after everyone else gets taken out. Be the one who waits, confirms, then strikes with intention.
Bless Trading!
EURUSD| - Inducement Fueling Bullish Intent📌 Pair: EURUSD
📈 Bias: Bullish
🕰 HTF View (4H):
Clear bullish intent shown with a break above major external structure (higher high). Inducement remains intact—expecting that draw to price. Strong bullish momentum signals smart money positioning for more upside.
🧭 MTF Clarity (2H → 30M):
30M structure refined and leaning bullish, but using 2H for confirmation. Waiting on liquidity sweep into the OB zone for entry precision.
🎯 Entry Criteria:
LTF CHoCH → Liquidity Sweep → OB Mitigation
(Execution in that exact order for maximum confirmation)
🎯 Target: Structure highs above
🧠 Mindset Note:
Let the inducement play out—don’t rush it. This is where patience and clarity separate a sniper from a scalper. One clean entry > 10 reactive trades.
Bless Trading!

EURJPY ANALYSISAfter seeing the previous weekly candle close bullish confirming buying strength and it could continue into weekly highs and confluences on the daily and the 4hr suggest that too

GBPJPY| - Bullish Play with Eyes on Deeper Liquidity📌 Pair: GBPJPY
📈 Bias: Bullish
🕰 HTF View (4H):
Major external structure has been broken to the upside, showing clear bullish intent. Price hasn’t aggressively swept sell-side liquidity yet, so we stay aware of the possibility—but structure favors a continuation north.
🧭 LTF View (30M):
Refined bullish structure forming. Waiting for liquidity sweep into the 30M OB for mitigation and signs of lower timeframe shift.
🎯 Entry Criteria:
After liquidity sweep → LTF CHoCH → Return into OB
Entry off optimal zone (refined precision based on PA)
🎯 Target: Near recent structure highs
🧠 Mindset Note:
Let price come to you. Don’t chase—anticipate. We’re playing the long game through structure and flow, not emotion.
Bless Trading!

GBPUSD ANALYSIS After seeing that the previous candle closed really bullish on the week we could expect that momentum to continue since the daily and the 4hr structure are not showing any signs of reversal

XAUUSD| - liquidity Driven Buy Setup📌 Pair: XAUUSD
📈 Bias: Bullish
🕰 HTF View (4H):
Last week’s price action formed a bullish continuation structure. Internal major high taken, sweeping liquidity—confirmation of smart money interest. Expecting continuation to upside objectives.
🧭 LTF View (30M):
Waiting for clean major LH break following the sell-side liquidity sweep. Entry zones will be refined once OB mitigation confirms buyer interest.
🎯 Entry Zone:
After SSL sweep + OB tap
🎯 Target: Recent highs and continuation beyond
🧠 Mindset Note:
Trusting the flow from higher-timeframe intention down to precision entries. Patience here pays—let the structure confirm before pressing the trigger.
Bless Trading!

XAU/USD Analysis – June 30, 2025✅ Primary Scenario (Bearish Bias):
Short-term move up expected:
Price is expected to fill the Fair Value Gap (FVG) around 3,305 – 3,306.
This level aligns with a key resistance zone and also the 0.618 Fibonacci retracement, making it a strong area for a potential bearish reaction.
Downtrend continuation:
If price reacts from the resistance zone, we expect the downtrend to continue, targeting:
📍 3,256 – liquidity zone
📍 3,245 – additional liquidity below
📍 3,228 – unfilled FVG

Positioning Buy idea on Sugar (SB1!)Based on :
- Cot at extremes potential reversal
- Seasonality and quantitative analysis
- 2 Demand zones

Gala (GALA)On the above 4-day chart price action has recently corrected 50% since a sell signal in late January (ask below if you wish to see). A number of reasons now exist to be long..
1) You know why.
2) Price action finds support on the golden ratio.
3) There is a positive divergence between RSI and price action.
4) The bull flag channel, naturally a bullish pattern on confirmation of a breakout to the upper side of the channel.
5) A breakout confirmation will result in a 300% gain from current levels.
Is it possible for price action to fall further? Sure.
Is it probable? No.
Ww
Type: Trade
Risk: <= 6%
Timeframe to open: Now
Return: 300%

Is FTT token about to print a 400% move?On the above 5 day chart price action has corrected over 70% throughout 2024. A number of reasons now exist to be bullish. They include:
1) Price action and RSI resistance breakouts.
2) Trend reversal. Notice the higher low?
3) The trend reversal follows strong bullish divergence, which has now confirmed.
4) Look left. Notice where the higher low is printing? On past resistance. Excellent.
5) Lastly the bull flag, it has broken out and confirmed support. The flagpole forecasts a 400% move.
Is it possible price action continues to correct? Sure.
Is it probable? No.
Ww

Last week of June EU outlookWeekly forecast for EU. We have seen a very bullish June so far. We approached a weekly POI before starting to consolidate.
We are now entering the last week of the month where the monthly candle's upper wick needs to be formed.
In this video I have identified a potential area where we could see the pullback take place.
