NASDAQ Analysis Stalking shorts on the Daily - nearby.
My weekly sentiment is bearish cause of technical factors.
Among the catalysts is bullish performance on the US Dollar index and price action compared to the US30 & US500.
Look to sell near 4H swing high, entry using the 15M bearish ChoCh only after three legs of bullish correction on the 1H frame into the highlighted levels of the swing high.
Anticipation is for the third leg to react bearish and the fourth leg to deliver impulse to the sell side.
Multiple Time Frame Analysis

GBPCAD SHORTMarket structure bearish on HTFS DH
entry at Daily AOi
Weekly Rejection at AOi
Daily Rejection at AOi
Daily EMA retest
Previous Structure point Daily
Around Psychological Level 1.85000
H4 EMA retest
H4 Candlestick rejection
Rejection from Previous structure
Levels 3.77
Entry 95%
REMEMBER : Trading is a Game Of Probability
: Manage Your Risk
: Be Patient
: Every Moment Is Unique
: Rinse, Wash, Repeat!
: Christ is King.

GBPCHF SHORTMarket structure bearish on HTFs 3
Entry at both Weekly and Daily AOi
Weekly Rejection At AOi
Daily Rejection at AOi
Previous Structure point Daily
Around Psychological Level 1.10500
H4 EMA retest
H4 Candlestick rejection
Rejection from Previous structure
Levels 4.17
Entry 110%
REMEMBER : Trading is a Game Of Probability
: Manage Your Risk
: Be Patient
: Every Moment Is Unique
: Rinse, Wash, Repeat!
: Christ is King.

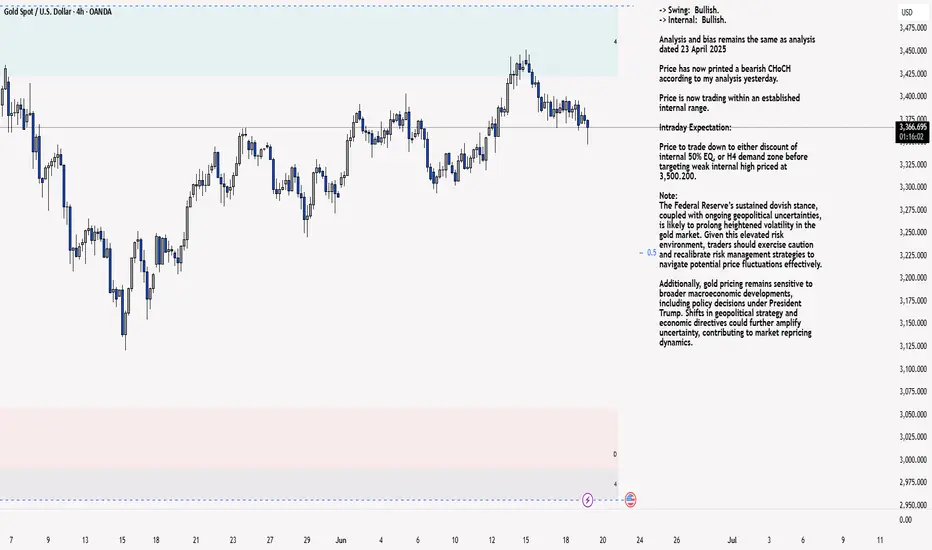
XAU/USD 19 June 2025 Intraday AnalysisH4 Analysis:
-> Swing: Bullish.
-> Internal: Bullish.
Analysis and bias remains the same as analysis dated 23 April 2025
Price has now printed a bearish CHoCH according to my analysis yesterday.
Price is now trading within an established internal range.
Intraday Expectation:
Price to trade down to either discount of internal 50% EQ, or H4 demand zone before targeting weak internal high priced at 3,500.200.
Note:
The Federal Reserve’s sustained dovish stance, coupled with ongoing geopolitical uncertainties, is likely to prolong heightened volatility in the gold market. Given this elevated risk environment, traders should exercise caution and recalibrate risk management strategies to navigate potential price fluctuations effectively.
Additionally, gold pricing remains sensitive to broader macroeconomic developments, including policy decisions under President Trump. Shifts in geopolitical strategy and economic directives could further amplify uncertainty, contributing to market repricing dynamics.
H4 Chart:
M15 Analysis:
-> Swing: Bullish.
-> Internal: Bullish.
Following previous high, and printing of bearish CHoCH, price has pulled back to an M15 supply zone, where we are currently seeing a reaction. Therefore, I shall now confirm internal high.
Price is now trading within an established internal range.
The remainder of my analysis shall remain the same as analysis dated 13 June 2025, apart from target price.
As per my analysis dated 22 May 2025 whereby I mentioned price can be seen to be reacting at discount of 50% EQ on H4 timeframe, therefore, it is a viable alternative that price could potentially print a bullish iBOS on M15 timeframe despite internal structure being bearish.
Price has printed a bullish iBOS followed by a bearish CHoCH, which indicates, but does not confirm, bearish pullback phase initiation. I will however continue to monitor, with respect to depth of pullback.
Intraday Expectation:
Price to continue bearish, react at either M15 supply zone, or discount of 50% internal EQ before targeting weak internal high priced at 3,451.375.
Note:
Gold remains highly volatile amid the Federal Reserve's continued dovish stance, persistent and escalating geopolitical uncertainties. Traders should implement robust risk management strategies and remain vigilant, as price swings may become more pronounced in this elevated volatility environment.
Additionally, President Trump’s recent tariff announcements are expected to further amplify market turbulence, potentially triggering sharp price fluctuations and whipsaws.
M15 Chart:
GBPJPY: Pullback From Trend Line 🇬🇧🇯🇵
I think that GBPJPY may bounce from a rising trend line
that I spotted on a daily time frame.
As a confirmation, I spotted 2 intraday bullish breakouts:
a violation of a resistance line of a falling channel
and a breakout of a neckline of a cup & handle pattern.
Goal - 195.0
❤️Please, support my work with like, thank you!❤️
I am part of Trade Nation's Influencer program and receive a monthly fee for using their TradingView charts in my analysis.

Nas100 target reached.I uploaded a trade idea of this yesterday and these are the results, I used proper risk management and proper execution approach!

Nasdaq 100 Trade idea for the day and bias.This is what I'm expecting Nas100 to do today looking at the higher timeframe structure.

NZDUSD SELL OFF (Counter-Trend Setup)(Daily) - Price hit Key resistance level at (0.60308 - 0.59985) and consolidated at the level attempting to breakout but failing and forming double top in 4H.
(4H) - Price formed double top at the Key resistance level (0.60308 - 0.59985) which is reversal pattern, neckline of the DT at (0.60031).
(4H) - Bearish market structure at the level price forming new lower high and lower low at (0.60578 - 0.60535)
(4H) - Rising trendline connecting low of the price at (0.58522 - 0.59556).
Entry ;
-We have 2 entry models;
1.Aggressive Entry at the Double top after the close of the bearish Engulfing Candle SL above double top at 0.60808
2.Conservative Entry wait for the break of the rising trendline to signal trend change from an uptrend to downtrend then execute.

EURCHF 18/06/2025Weekly:
-Weekly lows.
-Inverse H&S pattern.
Daily:
-Bullish M pattern.
-IC.
4H:
-Bullish M pattern.
-IC.

EURUSD - SHORT We have built up quite a lot of liquidity before our major supply zone.
Will give an update in the morning after seeing where price is at

GBPUSD Weekly: Price Action at Key Supply Zone Confluence• Long-Term Resistance Zone: The chart displays a significant purple-shaded "Key Level" resistance zone, approximately spanning from 1.3600 to 1.3800. Price has previously reacted to this zone as strong resistance on multiple occasions (e.g., in 2018 and 2021), indicating a historical area of supply. The current price action shows the market testing this zone once again.
• Bullish Market Structure from 2022 Lows: Following a substantial decline through 2022, the GBPUSD pair initiated a strong recovery, characterized by a clear sequence of higher highs and higher lows since late 2022. This upward movement is encapsulated within a robust green ascending trend channel, signifying a dominant bullish bias on this timeframe.
• Identified Support Areas: A notable support zone is evident around the 1.2100-1.2200 levels. This area has historically acted as a strong demand zone, providing significant bounces for the price, most recently in late 2022 and early 2024.
• Current Price at Critical Confluence: Price is currently situated at the upper boundary of its long-term ascending trend channel and is simultaneously interacting with the established "Key Level" resistance zone. This confluence of technical elements suggests a pivotal point for the pair, where a decisive reaction from either buyers or sellers is anticipated.
Disclaimer:
The information provided in this chart is for educational and informational purposes only and should not be considered as investment advice. Trading and investing involve substantial risk and are not suitable for every investor. You should carefully consider your financial situation and consult with a financial advisor before making any investment decisions. The creator of this chart does not guarantee any specific outcome or profit and is not responsible for any losses incurred as a result of using this information. Past performance is not indicative of future results. Use this information at your own risk. This chart has been created for my own improvement in Trading and Investment Analysis. Please do your own analysis before any investments.

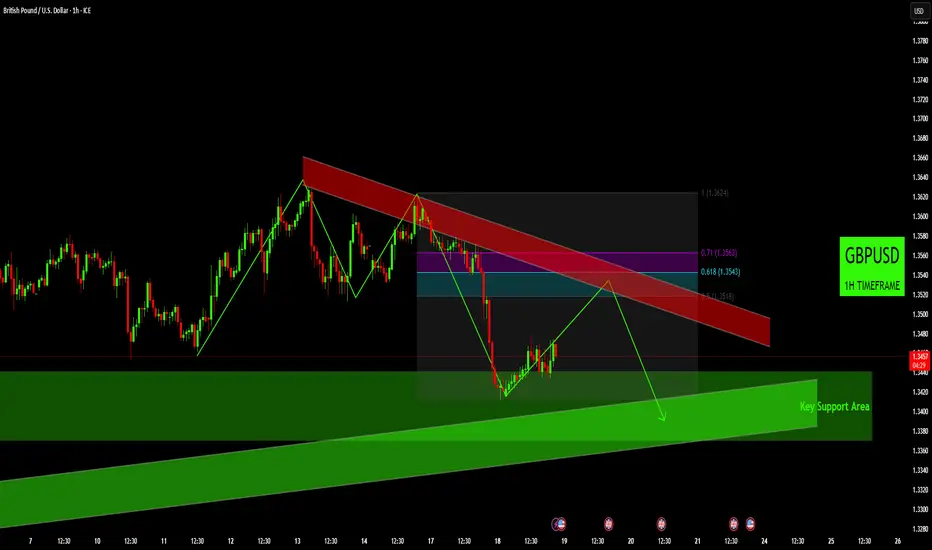
GBPUSD 1H OutlookGBPUSD 1H Chart: Technical Analysis of Bearish Channel and Key Support
Bearish Channel and Price Structure: The chart illustrates an initial bullish move followed by the formation of a descending red channel, suggesting a shift in short-term momentum to bearish. Price recently broke down from an earlier ascending structure, confirming a potential change in trend dynamics. The current price action shows a retracement back towards the upper boundary of this bearish channel and previous resistance levels.
Resistance Zone Confluence: The red-shaded area at the top represents a significant supply zone, indicating an area where sellers have previously dominated. This zone also converges with the upper boundary of the newly formed descending red channel, creating a strong confluence of resistance where selling pressure is anticipated to emerge.
Fibonacci Retracement Levels: A Fibonacci retracement tool has been applied from the recent high (1.3624) to the recent low. The key retracement levels of 0.5 (1.3518), 0.618 (1.3543), and 0.71 (1.3563) fall within or immediately below the identified red resistance channel. These levels are often watched by traders as potential turning points or areas of re-accumulation/distribution.
Key Support Area & Target Zone: Below the current price, a wide green-shaded "Key Support Area" is identified, stretching from approximately 1.3440 down towards 1.3360. This zone likely represents a significant demand area where buyers are expected to re-enter the market, potentially serving as a target for a continued bearish move or a strong bounce point.
Disclaimer:
The information provided in this chart is for educational and informational purposes only and should not be considered as investment advice. Trading and investing involve substantial risk and are not suitable for every investor. You should carefully consider your financial situation and consult with a financial advisor before making any investment decisions. The creator of this chart does not guarantee any specific outcome or profit and is not responsible for any losses incurred as a result of using this information. Past performance is not indicative of future results. Use this information at your own risk. This chart has been created for my own improvement in Trading and Investment Analysis. Please do your own analysis before any investments.
Weekly Forex Outlook Sun.June.15.2025 - Fri.June.20.2025Like and Comments would be appreciated :D Not Financial Advice, Just my outlook/opinion

Long entry set up Now that’s the 1 hour FVG wasn’t broken, but BoS has been established, looking at the OB on the 15 min TF as the next long entry. Entry at 21,765 with SL at 21,690 and TP1 of 21,890.

Tesla May Be StallingTesla bounced between early April and late May, but now it may be stalling.
The first pattern on today’s chart is the weekly low of $331.39 from May 22. TSLA fell below that level two weeks ago and was rejected at the same price area last week. Has old support become new resistance?
Second, the stock has fallen under its 8- and 21-day exponential moving averages (EMAs). The 8-day EMA is also at risk of slipping below the 21-day EMA. Such patterns may reflect short-term bearishness. Falling MACD paints a similar picture.
Third, the EV stock peaked at $488.54 in December -- above its previous high of $414.50 from November 2021. But it failed to hold, which could be viewed as a false breakout.
Those signals could focus traders’ attention on the April low of $214.15, which is still more than $100 below TSLA’s close on Tuesday.
Finally, TSLA is an active options underlier. (Its average daily volume of 2.6 million contracts last month ranked third in the entire market, according to TradeStation data.) That could make it easier for traders to take positions with calls and puts.
Check out TradingView's The Leap competition sponsored by TradeStation.
TradeStation has, for decades, advanced the trading industry, providing access to stocks, options and futures. If you're born to trade, we could be for you. See our Overview for more.
Past performance, whether actual or indicated by historical tests of strategies, is no guarantee of future performance or success. There is a possibility that you may sustain a loss equal to or greater than your entire investment regardless of which asset class you trade (equities, options or futures); therefore, you should not invest or risk money that you cannot afford to lose. Online trading is not suitable for all investors. View the document titled Characteristics and Risks of Standardized Options at www.TradeStation.com . Before trading any asset class, customers must read the relevant risk disclosure statements on www.TradeStation.com . System access and trade placement and execution may be delayed or fail due to market volatility and volume, quote delays, system and software errors, Internet traffic, outages and other factors.
Securities and futures trading is offered to self-directed customers by TradeStation Securities, Inc., a broker-dealer registered with the Securities and Exchange Commission and a futures commission merchant licensed with the Commodity Futures Trading Commission). TradeStation Securities is a member of the Financial Industry Regulatory Authority, the National Futures Association, and a number of exchanges.
Options trading is not suitable for all investors. Your TradeStation Securities’ account application to trade options will be considered and approved or disapproved based on all relevant factors, including your trading experience. See www.TradeStation.com . Visit www.TradeStation.com for full details on the costs and fees associated with options.
Margin trading involves risks, and it is important that you fully understand those risks before trading on margin. The Margin Disclosure Statement outlines many of those risks, including that you can lose more funds than you deposit in your margin account; your brokerage firm can force the sale of securities in your account; your brokerage firm can sell your securities without contacting you; and you are not entitled to an extension of time on a margin call. Review the Margin Disclosure Statement at www.TradeStation.com .
TradeStation Securities, Inc. and TradeStation Technologies, Inc. are each wholly owned subsidiaries of TradeStation Group, Inc., both operating, and providing products and services, under the TradeStation brand and trademark. When applying for, or purchasing, accounts, subscriptions, products and services, it is important that you know which company you will be dealing with. Visit www.TradeStation.com for further important information explaining what this means.

DOW JONES Analysis This is U30 through my current lens, investigations of price action from W - D - 4H suggest Bullish.
factoring in the current fundamental conditions, I observe the US Dollar.
Monitor the US100 & US500 for any irregular correlation in price delivery between the 4H - 15M
I seek price to attack "Highs" and sustain strong "Lows".

SHORT ON AUD/JPYAUD/JPY has given us a choc (change of character) from up to down at a major resistance zone.
I will be selling AUD/JPY to the next demand level looking to catch 100-200 pips

Short trade
📍 Pair: CADJPY
📅 Date: Tuesday, June 17, 2025
🕒 Time: 3:00 PM (NY Session PM)
⏱ Time Frame: 1 Hour
📈 Direction: Sell-side
📊 Trade Breakdown:
Entry Price 106.484
Profit Level 106.029 (0.43%)
Stop Loss 106.603 (0.11%)
Risk-Reward Ratio 3.82
🧠 Context / Trade Notes:
1H Structure-Based Entry:
Trade was observed on the 1-hour chart, and sell-side trade was undertaken due to a clear bearish market structure in play.

Long trade
📍 Pair: GBPUSD
📅 Date: Tuesday, June 17, 2025
🕒 Time: 3:00 PM (NY Session PM)
⏱ Time Frame: 1 Hour
📈 Direction: Buyside
📊 Trade Breakdown:
Entry Price 1.34293
Profit Level 1.35653 (+1.01%)
Stop Loss 1.34086 (−0.15%)
Risk-Reward
Ratio 6.57 : 1
🧠 Context / Trade Notes:
Higher Timeframe Confluence:
Trade took off a 1-hour bullish order block following consistent higher highs and higher lows.
Choch + BOS Confirmed:
Clear change of character and break of structure gave the green light for a continuation long.

This is my views on EURUSD so far.I have not yet taken a single position on this pair because price has not yet met my execution requirements. Overall views on the pair are short term bullish to the Weekly/Monthly POI's then I will be looking for a long term bearish structure.

Skeptic | DXY Crash Alert: Epic Bearish Triggers Unleashed!heyy, traders, what’s good? It’s Skeptic ! 😎 Let’s dive into a full-on breakdown of DXY—the Dollar Index is making waves, and I’m hyped to unpack it. The 98.801 level looks busted with a pullback in play, and I’m expecting more action. Stick with me to the end as we rip through Daily and 4-Hour timeframes to catch the vibe and nail those triggers! 🚖
Daily Timeframe: The Big Picture
So, US inflation data came in softer than expected recently, but DXY still dumped. You might be like, “Wait, shouldn’t lower inflation juice up the dollar?” Nah, here’s the deal: markets move on expectations, not just news. When something grows in the markets, it’s ‘cause traders are betting it’ll keep growing—and vice versa. For DXY, traders are sniffing out a US economic slowdown and expecting the Federal Reserve to cut rates soon, which could spark higher inflation later. That’s the double-whammy driving DXY’s drop, despite the tame inflation numbers. This is the biggest secret in markets—nobody talks about it, but it’s what I learned in econ class and see every day: markets run on expectations. 📚
Major Trend: Per Dow Theory, we’re in a bearish trend as long as we’re below 98.801 .
Game Plan: While under this level, hunt longs on USD pairs like EUR/USD. If we break above 98.801, chill and let the market reform before jumping in.
4-Hour Timeframe: Long & Short Triggers
Now, let’s get to the 4-hour chart for the real action—our long and short triggers:
Short Trigger: A break below support at 98.017 could keep the bearish vibe rolling. RSI hitting oversold would be a dope confirmation. 😤
Long Trigger: Since the major trend is bearish, longs are against the flow, so keep risk tight and take profits quick. The trigger is a break above 98.801, but the main long trigger is smashing through 99.244. So, 99.244 is your go-to for longs. 💪
Pro Tip: Shorts align with the trend, so they’re safer, but longs need extra caution—small positions, tight stops, and don’t get greedy!
Final Vibe Check
That’s the DXY lowdown, fam! Markets are tricky, but if you stick to reasoning over hype, you’ll stay ahead. No FOMO, no hype, just reason —that’s how we roll at Skeptic Lab. Wanna dive deeper into risk management or another pair? Let me know! 🙌
💬 Let’s Talk!
If this analysis got you pumped, smash that boost—it means a ton! 😊 Got a pair or setup you want me to tackle next? Drop it in the comments. Thanks for vibing with me—keep trading sharp! ✌️

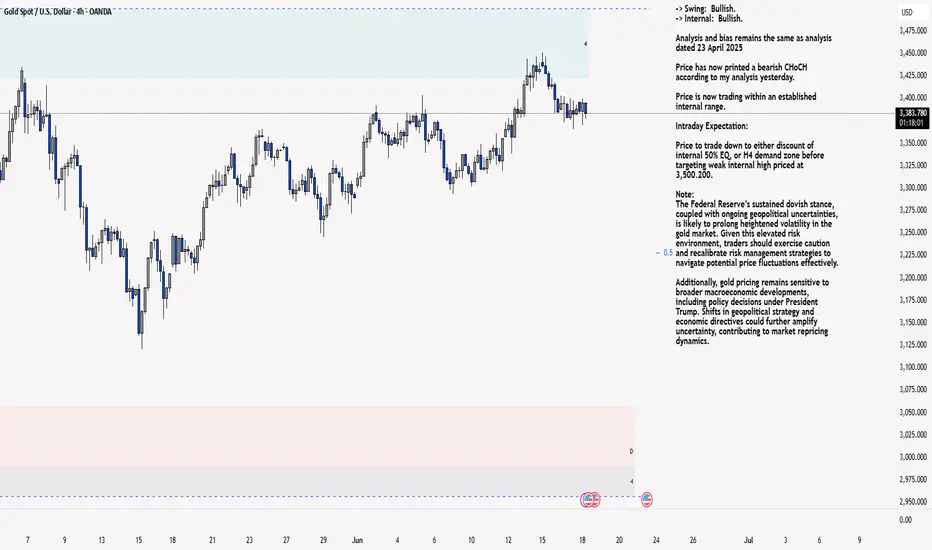
XAU/USD 18 June 2025 Intraday AnalysisH4 Analysis:
-> Swing: Bullish.
-> Internal: Bullish.
Analysis and bias remains the same as analysis dated 23 April 2025
Price has now printed a bearish CHoCH according to my analysis yesterday.
Price is now trading within an established internal range.
Intraday Expectation:
Price to trade down to either discount of internal 50% EQ, or H4 demand zone before targeting weak internal high priced at 3,500.200.
Note:
The Federal Reserve’s sustained dovish stance, coupled with ongoing geopolitical uncertainties, is likely to prolong heightened volatility in the gold market. Given this elevated risk environment, traders should exercise caution and recalibrate risk management strategies to navigate potential price fluctuations effectively.
Additionally, gold pricing remains sensitive to broader macroeconomic developments, including policy decisions under President Trump. Shifts in geopolitical strategy and economic directives could further amplify uncertainty, contributing to market repricing dynamics.
H4 Chart:
M15 Analysis:
-> Swing: Bullish.
-> Internal: Bullish.
Following previous high, and printing of bearish CHoCH, price has pulled back to an M15 supply zone, where we are currently seeing a reaction. Therefore, I shall now confirm internal high.
Price is now trading within an established internal range.
The remainder of my analysis shall remain the same as analysis dated 13 June 2025, apart from target price.
As per my analysis dated 22 May 2025 whereby I mentioned price can be seen to be reacting at discount of 50% EQ on H4 timeframe, therefore, it is a viable alternative that price could potentially print a bullish iBOS on M15 timeframe despite internal structure being bearish.
Price has printed a bullish iBOS followed by a bearish CHoCH, which indicates, but does not confirm, bearish pullback phase initiation. I will however continue to monitor, with respect to depth of pullback.
Intraday Expectation:
Price to continue bearish, react at either M15 supply zone, or discount of 50% internal EQ before targeting weak internal high priced at 3,451.375.
Note:
Gold remains highly volatile amid the Federal Reserve's continued dovish stance, persistent and escalating geopolitical uncertainties. Traders should implement robust risk management strategies and remain vigilant, as price swings may become more pronounced in this elevated volatility environment.
Additionally, President Trump’s recent tariff announcements are expected to further amplify market turbulence, potentially triggering sharp price fluctuations and whipsaws.
M15 Chart:
USDCHF: Pullback From Resistance 🇺🇸🇨🇭
USDCHF is going to retrace from a key daily horizontal resistance cluster.
As a confirmation, I spotted a bearish breakout of a support line of a rising
wedge pattern on an hourly time frame.
We see its retest now.
Goal - 0.815
❤️Please, support my work with like, thank you!❤️
I am part of Trade Nation's Influencer program and receive a monthly fee for using their TradingView charts in my analysis.
