EURUSD Sell PositionHello traders!
As we discussed in the last daily analysis, our overall view is bearish.
You can see the full analysis in the related article.
We are aiming for a short-term sell here.
Targeted price is 1.14432
Manage your risk and trade safe!
Multiple Time Frame Analysis

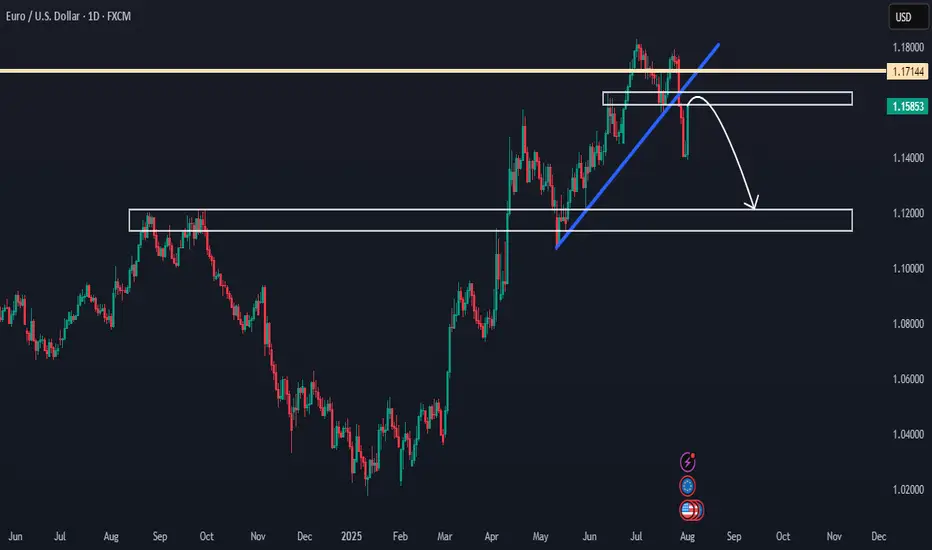
EURUSD Showing Reversal Signs After 7-Month Bullish TrendHello everybody!
After holding bullish momentum for a long time (7 months), EURUSD is starting to show signs of reversal:
1. It has been rejected from a strong resistance area.
2. It broke a support area, which is now expected to act as resistance.
3. It broke a solid upward trendline with a strong downward move.
If this area holds and price doesn't go above 1.18000, we can look to sell from here.
In that case, the most likely target will be around 1.12000.
Manage your risk and trade safe!
EurCad long term shortPatience in key in trading forex. A prime example of the EC pair where prices should rally to the upside to tap into the supply OB before shorting to the downside.

BTC_TRADING IDEA 08/01/25So we had a nice retracement. I’m now patiently waiting in a discount zone, aiming for a MTF LQ.
I have plenty of reasons to wait here:
– FVG
– OB
– OTE
If it doesn’t play out, I’ll look for another PD Array.
Let’s see!

Bitcoin Short SetupHi everyone.
In Bitcoin 1H TF we have a CHoCH followed by a BOS and a pullback, I think it is possible the price meet this area and then continue to go down...
Let's see what happens...
Good luck

EU Scalp (wrong bias) - Trump speech Came into the day with a neutral bias looking for some kind of retracement deeper into the hourly leg.
After a bearish London with bearish H1 order flow showing (H1 wicks + rejecting the Order block) we sell our liquidity shakeout right in the middle of New York session.
It's really got me interested was how close we came to the daily DOL (or so I thought) before retracing

XAUUSD - 4-Hour Chart with Smart Money Concepts - Long BiasThis trading plan takes a bullish bias outlook based on the Smart Money Concepts framework and fundamental analysis of a weakening USD. The current price action shows Gold approaching a critical Base 1 zone (demand/order block) around the 3375-3390 level, which acts as a key support area where institutional buying pressure is likely to emerge.
Above the current price, there is a well-defined High Time Frame (HTF) Supply Zone that represents a potential resistance area filled with liquidity. This zone provides a target for the expected upward move and highlights where sellers may enter to push prices lower again after the rally.
This setup also incorporates the concept of Fair Value Gap (FVG) visible near the Base 1 area, indicating a price imbalance that price often revisits to fill before continuing its trend. The FVG adds confluence to the potential demand zone, reinforcing the likelihood of a strong bounce from this area.
Fundamentally, the USD is considered weak at this moment, which further supports the bullish outlook for Gold prices, as USD weakness generally propels Gold higher due to its inverse relationship.
The proposed price path anticipates a short-term pullback into the Base 1 zone or FVG area, followed by a strong rally toward the HTF Supply Zone near 3430-3440. This reaction is expected to offer favorable risk-to-reward opportunities for long positions.
Key Points:
Bias: Long, looking for buying opportunities near Base 1 demand zone and FVG area.
Supply Zone: HTF Supply Zone above as a target and liquidity cluster.
Liquidity: Presence of buy liquidity within the Base 1 and FVG zones to fuel the upward move. Fundamental Support: USD weakness supports Gold rally.
Smart Money Concept: Trading around institutional order blocks and FVG for optimal entries.
Price Expectation: Pullback to Base 1/FVG then rally to HTF Supply Zone.

LCIDUSDT Ending Diagonal Near Strong DemandLucid Group continues its broader bearish move but now approaches a critical juncture with a well defined ending diagonal formation, often signaling trend exhaustion. Price action is nearing a historically strong demand zone, increasing the probability of a sharp reaction.
The trading plan is clear patiently accumulate within the projected buy zone as outlined on the chart, with focus on tracking price movement along the mapped reversal path. The setup presents a potential high reward-to-risk opportunity targeting the main sell-off resistance area, where major decisions will be reassessed.
Watch price closely as the ending diagonal matures. A strong bullish reaction could mark the start of a mid-term reversal phase.
📍 Drop your stock requests in the comments for quick technical updates only US stock assets will be analyzed under this post.

COINBASE Bearish RSI Divergence Signals Impending ABC CorrectionCoinbase Global has completed a full wave cycle and is now positioned for a corrective leg toward the base of Wave 4, following a classic Elliott Wave structure. The unfolding scenario aligns with a potential ABC corrective move, with Wave A currently in development.
A strong bearish RSI divergence has also emerged price continues to make higher highs while RSI prints lower highs indicating underlying weakness and increasing the probability of a deeper retracement.
The strategic plan is to monitor for short opportunities or pullback zones as the market unfolds this corrective leg, with the base of Wave 4 serving as the target zone. All eyes on the momentum breakdown and support reaction.
💬 Share your views on this setup in the comments.

CAD_JPY STRONG UPTREND|LONG|
✅CAD_JPY is trading in an uptrend
Along the rising support line
Which makes me bullish biased
And the pair is already making
A bullish rebound from the support
So a further move up is expected
With the target of retesting the
Level above at 107.705
LONG🚀
✅Like and subscribe to never miss a new idea!✅

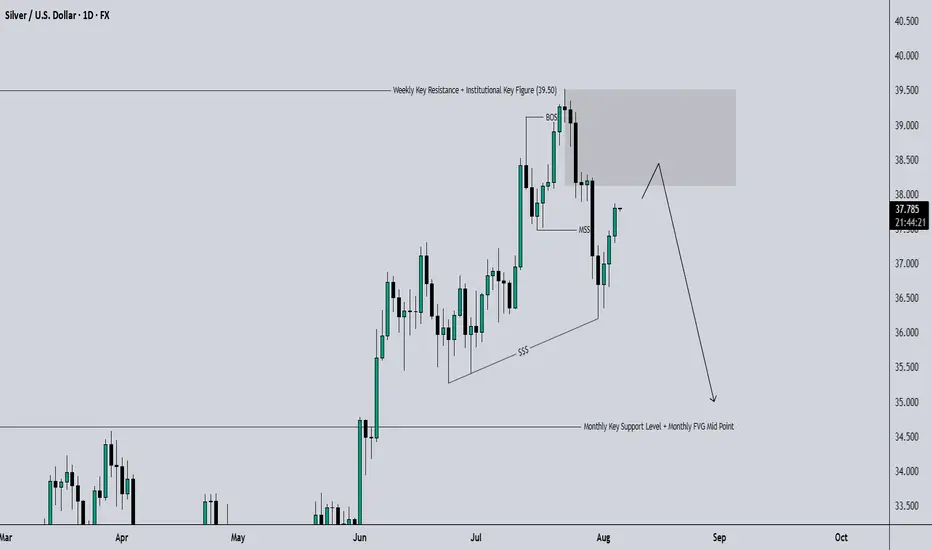
XAGUSD SWING: SHORT-TERM BEARISH OPPORTUNITY Hi there,
For Silver, I am long term bullish but we have a set up for some short opportunity.
As annotated, we are primed to see lower prices... between 34 - 34.5
If this happens, I'd resume looking for massive long opportunities.
You might want to keep this on your radar.
Cheers,
Jabari
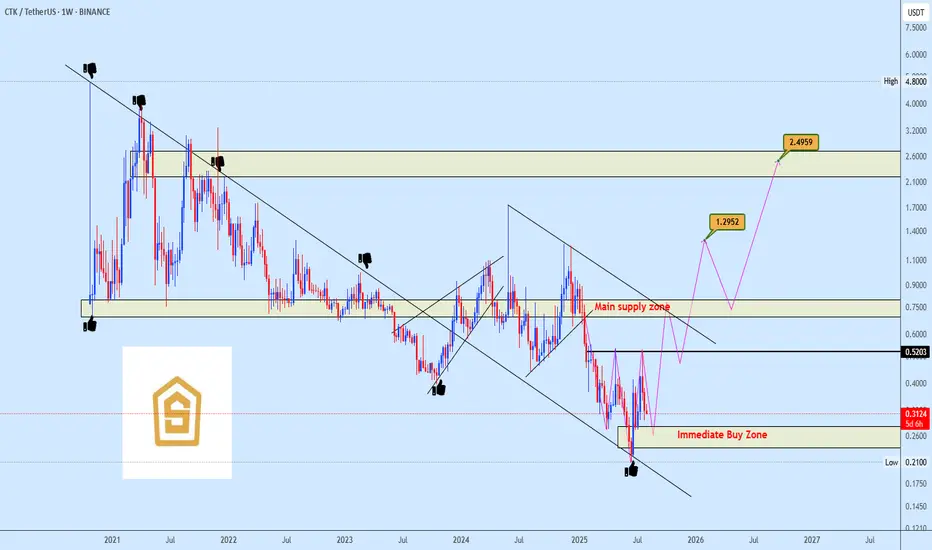
CTKUSDT Trendline Flip Impulsive Wave Build-Up in FocusCTKUSDT has completed a meaningful retest of a long-standing trendline, previously acting as resistance and now confirming its role as structural support. Price is reacting firmly around this key demand zone, signaling potential for a bullish reversal.
The plan is to accumulate within the immediate buy zone, targeting a move towards $2.495 as the structure develops into a likely impulsive wave sequence.
Share your thoughts
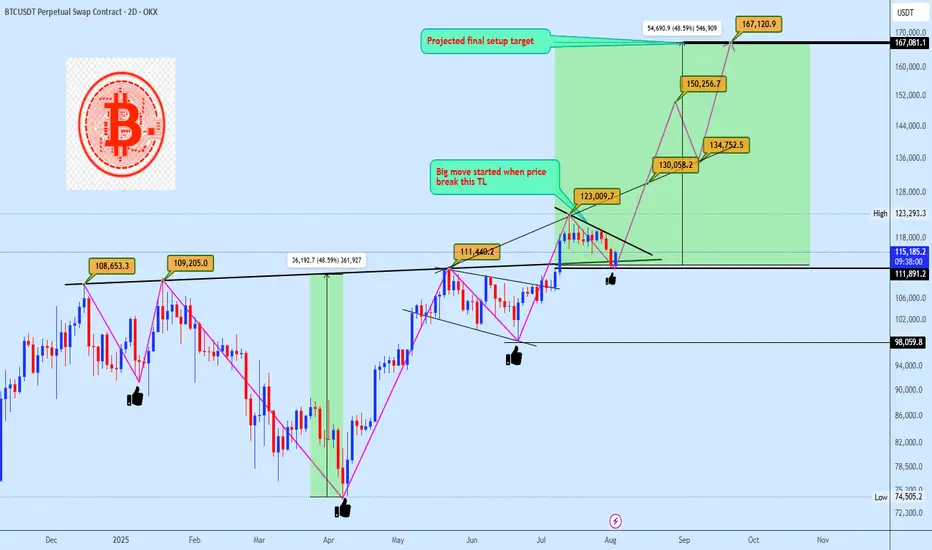
Bitcoin Preparing for Explosive Breakout Toward $167KBitcoin is currently respecting a clean trendline resistance following a bullish pennant formation. Price is holding firmly above the neckline breakout from the inverse head and shoulders (ISHS), confirming demand strength around the $111K–$113K region. The structure implies another 48% rally projection, mirroring the previous measured move, which points toward a potential target at $167K.
A breakout above the immediate diagonal resistance would likely trigger an impulsive continuation, replicating earlier moves from similar setups as annotated. Bias remains bullish while price holds above the neckline pivot.
Technical Confluence
Pattern Structure: Bullish Pennant + Retest of ISHS neckline
Market Geometry: Symmetrical move projection based on previous breakout leg
Momentum Flow: Higher lows forming against compressing resistance
Volume Expectation: Volatility expansion likely on breakout confirmation
Key Trendline: "Big move started when price break this TL"
Key Price Levels
• Support Zone: $111,800 – $113,000
• Confirmation Zone: Above $123,000
• Primary Target: 🎯 $167,000
• Invalidation Level: ❌ Below $105,000
Execution Plan
• Entry: Watch for bullish pennant breakout and retest of diagonal TL
• Trigger Method: Limit buy post-breakout or confirmation on volume surge
• SL: Just below $105K zone
📥 Let us know your thoughts in the comment section, and feel free to tag your preferred altcoins for analysis.
Attention: Our August Altcoin requests will be managed through this post. Kindly submit your preferred altcoins in the comment section below.
GBPNZD SHORT Market structure bearish at HTFs 3
Entry at both Weekly and Daily AOi
Weekly Rejection at AOi
Weekly Previous Structure Point
Daily Rejection At AOi
Daily EMA retest
Previous Structure point Daily
Around Psychological Level 2.25000
H4 Candlestick rejection
Levels 4.48
Entry 110% GVIBEZ
REMEMBER : Trading is a Game Of Probability
: Manage Your Risk
: Be Patient
: Every Moment Is Unique
: Rinse, Wash, Repeat!
: Christ is King.

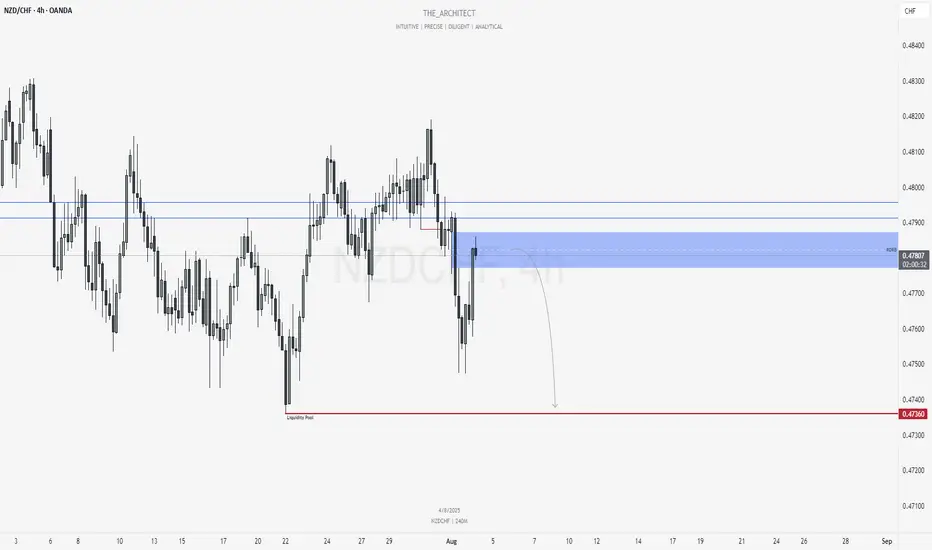
NZDCHF: Bearish Continuation from Re-Delivered Re-Balanced ArrayGreetings Traders,
In today’s analysis of NZDCHF, recent price action confirms the presence of bearish institutional order flow. As a result, we aim to align ourselves with this directional bias by identifying strategic selling opportunities.
Key Observations on H4:
Bearish Market Structure Shift: The H4 timeframe has recently confirmed a bearish shift in market structure, providing us with a clear framework to seek short setups in line with institutional momentum.
RDRB Resistance Zone: Price has retraced into a Re-Delivered Re-Balanced (RDRB) array—an area where prior institutional selling took place and has now been re-engaged. This region is expected to serve as resistance, offering a high-probability zone for confirmation entries to the downside.
Trading Plan:
Entry Strategy: Monitor lower timeframes (M15 and below) for bearish confirmation setups within the RDRB array.
Target Objective: The current draw on liquidity remains the liquidity pool residing at deeper discount levels, which aligns with our short bias.
For a detailed market walkthrough and in-depth execution zones, be sure to watch this week’s Forex Market Breakdown:
As always, stay disciplined, wait for clear confirmations, and manage your risk responsibly.
Kind regards,
The Architect 🏛️📉
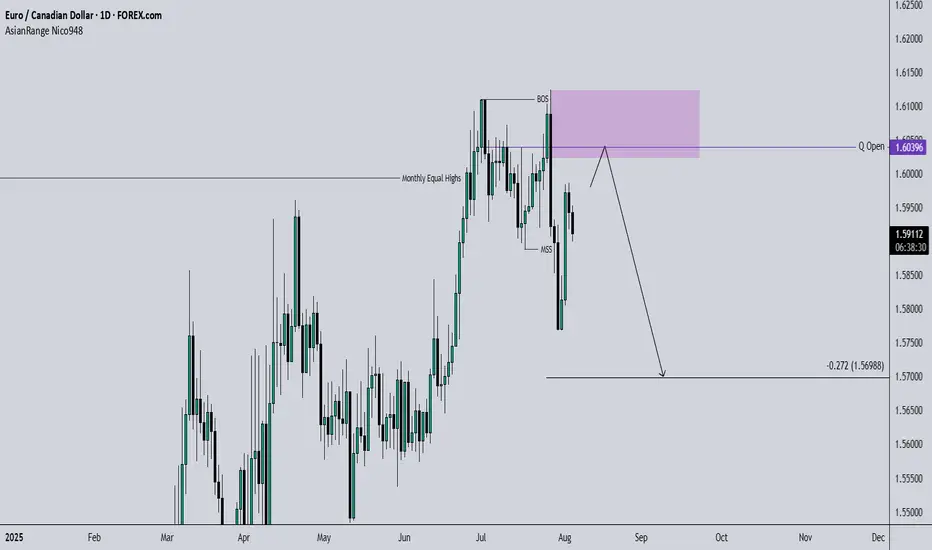
EURCAD SWING: SHORT-TERM SHORT OPPORTUNITYHi there,
Been a while... I was motivated resume sharing my trade ideas by a follower turned Pal (Shloydo). I say this to say - I'd be sharing my thoughts on price more often.
After running equal highs on the monthly chart, price created a MSS and I'd like to see a short-term bearish movement in price.
Once price trades into the highlighted key level (which aligns with the quarterly open price), I'd be looking for a setup to go short.
You could add this to the pairs on your radar.
Cheers,
Jabari
05/08/25 Gold Swing LevelsTuesday 05/08/25 levels are marked; expecting a downtrend
Trade parameters
Entry on 5 min chart
Sl: 30-50pips
TP: 2-4x SL

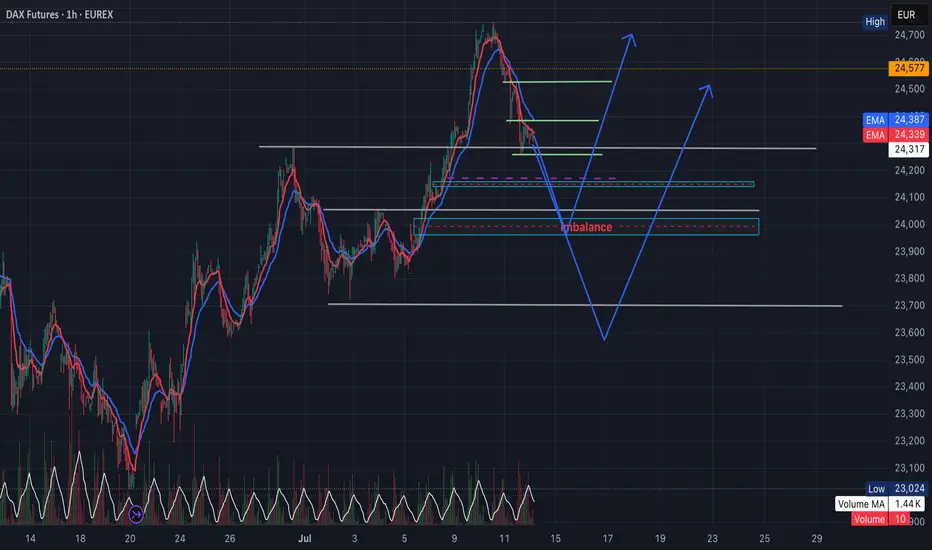
DAX Futures FDAX1!) Imbalance Fill Before Bullish Continuation?Analysis Summary:
1. Current pullback after a strong impulse move suggests a short-term retracement.
2. The imbalance zone (highlighted in red) around 23,970–24,010 may act as a magnet.
3. Alternatively, price may continue lower to tap into 4H demand / liquidity zone before reversing upward.
📌 Educational purpose only. Not financial advice.
Let me know your thoughts or if you see it differently — open to feedback!
August 5th - Decred (DCR) 1800% in 150 daysOn the above 6 day chart price action is shown with a 95% correction since April 2021. A number of reasons now exist for a bullish outlook, including:
Support and resistance
Price action confirms support after 4 years of resistance. On both downtrend and horizontal resistances.
Trend reversal
The support confirmation is followed by higher low and higher high prints in RSI with higher low print in price action.
1st and 2nd impulsive waves
A measured move from the first impulsive wave will see price action move to the previous all time high between $210 and $250
Summary
The flag set up is fairly reliable with a high success rate for continuation at 60% probability. However avoid greed at the forecast area, many people entered the market at $210 in 2021. For every seller there was a buyer at those levels now experiencing extreme despair eager to exit. Do not be their exit liquidity!
Whether the forecast is met or not expect a significant correction in price action to follow after September.
Is it possible price action continues lower? Sure.
Is it probable? No.
Ww

SHORT ON US30US30 Has given us a nice CHOC (Change of Character) to the downside.
This indicates a huge potential of US30 dropping more after it pulls back into the supply zone that created the change.
Dollar news is also a catalyst today for this play. If news comes out good for PMI and makes the dollar rise... US30 could fall almost 3000 points over the next few days.
Take Advantage.

CADJPY: Bullish Move Confirmed?! 🇨🇦🇯🇵
CADJPY is going to bounce from a key daily support.
With a high probability, 107.28 level will be reached soon.
❤️Please, support my work with like, thank you!❤️

EURUSD TRADING IDEA 08 05 25Here's another one:
Looking for a strong rejection in the discount zone before going long.

XAU/USD 05 August 2025 Intraday AnalysisH4 Analysis:
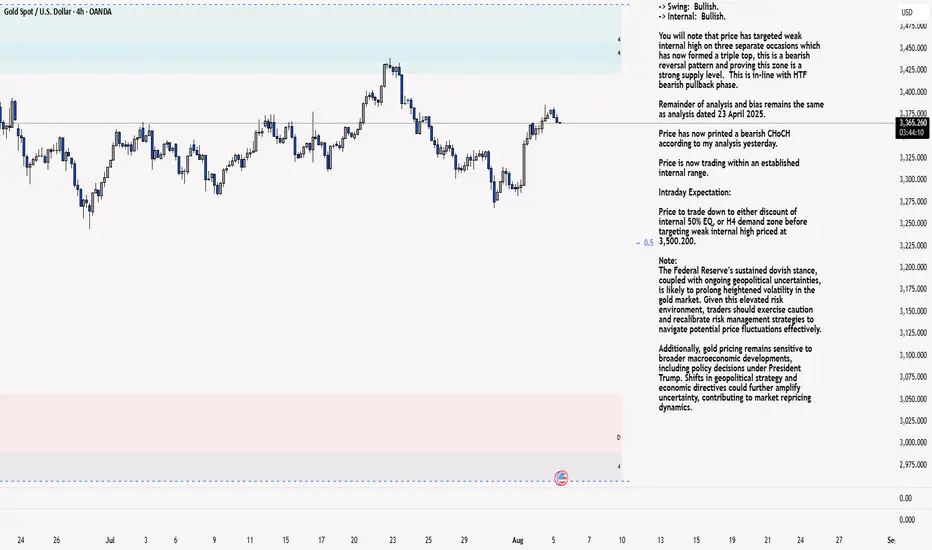
-> Swing: Bullish.
-> Internal: Bullish.
You will note that price has targeted weak internal high on three separate occasions which has now formed a triple top, this is a bearish reversal pattern and proving this zone is a strong supply level. This is in-line with HTF bearish pullback phase.
Remainder of analysis and bias remains the same as analysis dated 23 April 2025.
Price has now printed a bearish CHoCH according to my analysis yesterday.
Price is now trading within an established internal range.
Intraday Expectation:
Price to trade down to either discount of internal 50% EQ, or H4 demand zone before targeting weak internal high priced at 3,500.200.
Note:
The Federal Reserve’s sustained dovish stance, coupled with ongoing geopolitical uncertainties, is likely to prolong heightened volatility in the gold market. Given this elevated risk environment, traders should exercise caution and recalibrate risk management strategies to navigate potential price fluctuations effectively.
Additionally, gold pricing remains sensitive to broader macroeconomic developments, including policy decisions under President Trump. Shifts in geopolitical strategy and economic directives could further amplify uncertainty, contributing to market repricing dynamics.
H4 Chart:
M15 Analysis:
-> Swing: Bullish.
-> Internal: Bullish.
H4 Timeframe - Price has failed to target weak internal high, therefore, it would not be unrealistic if price printed a bearish iBOS.
The remainder of my analysis shall remain the same as analysis dated 13 June 2025, apart from target price.
As per my analysis dated 22 May 2025 whereby I mentioned price can be seen to be reacting at discount of 50% EQ on H4 timeframe, therefore, it is a viable alternative that price could potentially print a bullish iBOS on M15 timeframe despite internal structure being bearish.
Price has printed a bullish iBOS followed by a bearish CHoCH, which indicates, but does not confirm, bearish pullback phase initiation. I will however continue to monitor, with respect to depth of pullback.
Intraday Expectation:
Price to continue bearish, react at either M15 supply zone, or discount of 50% internal EQ before targeting weak internal high priced at 3,451.375.
Note:
Gold remains highly volatile amid the Federal Reserve's continued dovish stance, persistent and escalating geopolitical uncertainties. Traders should implement robust risk management strategies and remain vigilant, as price swings may become more pronounced in this elevated volatility environment.
Additionally, President Trump’s recent tariff announcements are expected to further amplify market turbulence, potentially triggering sharp price fluctuations and whipsaws.
M15 Chart: