XAUUSD| Precision Entry OnlyUhhhh..... yeah, I'm actually already in this trade lol. Marked up that 4H shift early, saw the intent clear as day. Price pulled right into my killzone.
Dropped to 30M, caught shift, waited for confirmation, and took the short like a sniper.
This ain't luck. This is logic, structure, timing. Inducement? Checked. Execution? Smooth.
Welcome to the other side of trading.
Bless Trading!
Multiple Time Frame Analysis

USDJPY| Momentum Shift in MotionCaught that 4H Lower High flip, shifting structure bullish and throwing a big signal-we might be running it up.
Zoomed into the 30M to catch the continuation move. Refined structure showing its hand. Now it's all about patience...
I'm letting that internal order flow do its thing. Just waiting on the right area to get tapped for my next execution.
No hype. Just flow. I don't chase- I wait for price to clock in and pay me.
Bless Trading!

GU| Patiently Watching This Setup Cook4H gave me the (BOS) break of structure to the downside - that's my bearish intent on the higher timeframe. Price could climb into the supply zone above before delivering that reversal.
Dropped to the 30M, structure is still bullish for now, showing strong momentum. Now it's a waiting game... Do we dip to take out that sell-side liquidity (SSL) for a clean buy setup first? Or... are we already mitigating the 4H supply and about to print a bearish shift on 30M?
Either way, I'm letting price tell me the truth. No chasing. No guessing. Just real logic with structure & inducement flow.
Stay sharp.
Bless Trading!

AUDNZD 19/05/2025Weekly:
-Bearish W pattern.
-Strong weekly resistance.
-Expecting at least a bearish reaction.
Daily:
-H&S pattern.
-IC.
4H:
-Bearish W pattern.
-H&S pattern.

SHORT ON EUR/USDEUR/USD is in a overall uptrend.
I'm just looking to catch the pullback as we continue to make downtrend market structure on the pullback itself.
Looking to catch 200-400 pips to the downside.

EURUSD Sell – May 19, 2025📍Context:
Reaction from 15m Orderblock
HTF is bearish
LTF BOS as confirmation
🎯 TP:
Targeting Gap and Asia Lows

EUR/CHF For Bullishwait for pull-back near by entry point and then go long
general trend is up trend
have fun :)

WTI Update | Oil CrashSince the last update we were able to perform about two to three swing trades. One from $70 - $79, and from $79 to $68. The next move I'm looking for is another short position from current market price ~($62) to swing to the next major low $33.
We saw a rejection last week and we're currently pulling back to retest the little selloff we had.
Could say this next local move will look to selloff mid week making its way back to $57 which would be a nice short term swing.
The $33 target would be the long term swing of course and moving on I would like to see a break below $57 and a retest.

AUD/CAD For Bullishwait for pull-back near by entry point and then go long
general trend is up trend
have fun :)

GBP/CAD For Bullishyou can go long now
or
wait for pull-back near by entry point and then go long
general trend is up trend
have fun :)

EUR/JPY For Bullish as pull-backwait for pull-back near by entry point and then go long
general trend is down trend
current phase is pull-back
have fun :)

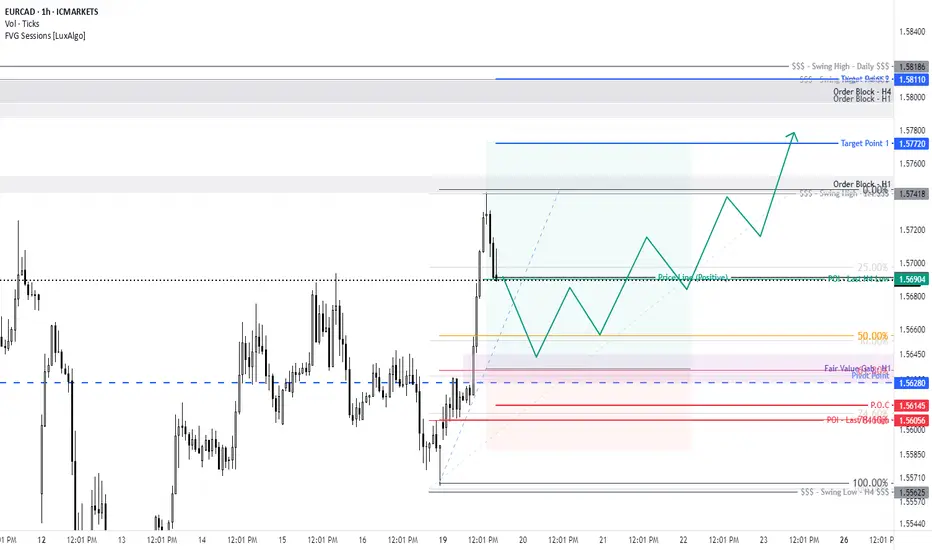
EUR/CAD For Bullish as pull-backwait for pull-back near by entry point and then go long
general trend is up trend
current phase is pull-back
have fun :)
Is NASDAQ ready to correct for a few days?We have a couple of doji candles on the daily chart forming out of a bearish imbalance range in the relative premium. This is the perfect place to test the lows for stops.
We are still bullish but I am going to go neutral for this forecast in anticipation of a slight correction.
Share this with someone who needs a complete top down analysis of where we are staring this week!

NZDJPY: Another Bullish Confirmation 🇳🇿🇯🇵
If you remember, I already posted a bullish outlook for NZDJPY on Friday.
This morning, I spotted one more intraday bullish confirmation.
I see a breakout of a resistance line of a bullish flag pattern on an hourly time frame.
I expect a bullish movement at least to 85.9 level soon.
❤️Please, support my work with like, thank you!❤️
I am part of Trade Nation's Influencer program and receive a monthly fee for using their TradingView charts in my analysis.

XAUUSD - Will Gold Reach $3,300?!Gold is trading above the EMA200 and EMA50 on the 1-hour timeframe and is trading in its ascending channel. I expect the path ahead for gold to be bullish, but a downward correction of gold will lead to the creation of buying positions from the bottom of the channel.
Gold faced renewed selling pressure over the past week—an event that not only dragged down its price but also led many analysts and retail investors to temporarily abandon their bullish short-term outlooks. The return of investor appetite for riskier assets has momentarily weakened gold’s appeal as a safe haven.
Meanwhile, the credit rating agency Moody’s has finally acted, downgrading the U.S. sovereign rating from Aaa to Aa1. This marks the first time that even one of the major agencies no longer sees the U.S. as worthy of the highest credit rating. The downgrade was driven by factors such as an annual budget deficit nearing $2 trillion, a debt burden exceeding GDP, and elevated interest rates that have significantly increased the government’s borrowing costs—conditions which, if persistent, could serve as catalysts for gold’s resurgence.
Adrian Day, CEO of Adrian Day Asset Management, stated: “The downward trend continues. We expect prices to decline further in the coming weeks, especially with the potential restructuring of U.S. trade tariffs. That said, once this phase passes, it could set the stage for one of the best buying opportunities.”
Adam Button, Chief Currency Strategist at Forexlive.com, offered a similar outlook, saying: “Current trading sentiment is clearly tilted toward the downside. The market is searching for a new floor, although it seems likely that support will remain above the key $3,000 psychological threshold.”
Following a week full of economic data, the upcoming week’s calendar appears relatively light, with only a handful of reports likely to influence the markets. Early in the week, traders will face a lack of major catalysts, but focus will gradually shift toward Thursday’s releases: weekly jobless claims, the flash PMI from S&P Global, and existing home sales. Additionally, new home sales data on Friday will be one of the few key events of the week.
Alongside these economic updates, the coming days will feature a wave of speeches from Federal Reserve policymakers. Speakers include Jefferson, Williams, Logan, Kashkari, Barkin, Bostic, Collins, Musalem, Kugler, Daly, and Hsu, culminating with a speech from Fed Chair Jerome Powell on Sunday evening.

AUDCAD SHORTMarket structure bearish on HTFs DW
Entry at Both Daily and Weekly AOi
Weekly Rejection at AOi
Previous Structure point Weekly
Daily Rejection at AOi
Previous Structure point Daily
Around Psychological Level 0.89500
H4 EMA retest
H4 Candlestick rejection
Levels 5.21
Entry 100%
REMEMBER : Trading is a Game Of Probability
: Manage Your Risk
: Be Patient
: Every Moment Is Unique
: Rinse, Wash, Repeat!
: Christ is King.

GBPUSD sell - May 19, 2025📍Context:
Reaction from 15m Orderblock after a BOS
1m BOS confirms bearish intent from 15m OB
Entry at the 5m OB left behind
🎯 TP:
First TP at 1:3 (75% off)
Final TP at 1:7, targeting Asia lows

NAS100 - Will the Stock Market Reach Its Previous High?!The index is trading above the EMA200 and EMA50 on the four-hour timeframe and is trading in its ascending channel. If the trend line is broken, I expect corrective moves, but if the index corrects towards the demand zone, we can look for further buying positions in Nasdaq with a risk-reward ratio. Maintaining this trend line will lead to a continuation of the Nasdaq upward trend.
The strong rally in U.S. equities that had pushed the S&P 500 close to record highs for 2025 came to a halt on Friday, following the release of disappointing consumer sentiment data. A report from the University of Michigan revealed a drop in consumer confidence and a surge in inflation expectations to levels not seen in decades—factors that have amplified concerns about the economy’s outlook.
Despite this, some analysts remain hopeful that robust corporate earnings and the temporary suspension of tariffs could provide needed support for the market. Meanwhile, rating agency Moody’s warned that U.S. federal debt is projected to climb to 134% of GDP by 2035, up from 98% in 2024.
Moody’s noted that while the U.S. economy and financial system remain strong, the weakening of certain fiscal indicators has diminished the ability of these strengths to offset negative effects. According to their analysis, trade tariffs will not significantly impact long-term U.S. economic growth, and substantial changes in mandatory spending are unlikely in the near future.
Although the U.S. credit rating has been downgraded, the country’s long-term domestic and foreign credit ceilings remain at AAA. However, Moody’s has revised the overall credit rating for the U.S. down from AAA to Aa1.
One noteworthy detail is that since April 21, the index has seen only one negative trading day—May 9, which experienced only a slight decline. Falling Treasury yields have reduced some market risks, while Donald Trump’s trip to the Middle East has also helped ease political tensions at home. The market clearly reflects growing investor appetite for risk, though the possibility of a correction at these levels remains real.
Looking ahead to this week, traders will closely monitor preliminary purchasing managers’ index (PMI) data for May on Thursday. They will also pay attention to speeches from several Federal Reserve officials to gauge whether the Fed remains focused on economic growth or has shifted more attention to inflation, especially in light of recent U.S.-China trade agreements.
A rise in PMI figures may suggest that business sentiment has improved since tensions eased between the U.S. and China, but investors are also eager for clear guidance on the Fed’s next policy steps. Key speakers include John Williams (New York Fed), Raphael Bostic (Atlanta Fed), Lorie Logan (Dallas Fed), and Mary Daly (San Francisco Fed). If these officials continue to express concerns about elevated inflation risks, the U.S. dollar could continue to strengthen, as markets may price in fewer rate cuts ahead.
As for the equity markets, their reaction remains uncertain. Recently, equities have risen even as expectations for rate cuts have diminished—primarily due to a reduced fear of recession following tariff adjustments. However, with recession fears now less pronounced and a growing narrative around sustained higher rates due to sticky inflation, Wall Street may pull back if Fed officials emphasize upside inflation risks.
In related news, President Donald Trump harshly criticized Walmart’s pricing strategy, stating that the company should absorb the cost of tariffs rather than passing them onto consumers. In a public statement, Trump pointed out that Walmart made billions in profit last year and argued that American shoppers should not bear the burden of higher prices caused by trade tariffs.
Trump also implicated China in the issue, stating that either Walmart or China should take responsibility for these added costs. He warned that both he and consumers are closely watching how Walmart handles the situation.

Watching 3265 — The Key Level for Gold BuyersHey traders and investors!
📊 GOLD / W + D
📍 Context
On the weekly timeframe: a seller candle with increased volume but no result — the close is above 3201. This gives buyers a chance to take over the initiative.
On the daily timeframe: the buyer has brought the price back into the range (lower boundary at 3201), which also keeps the door open for bullish scenarios.
🎯 Trade Idea
Consider long positions after the price holds above 3265
Potential targets: 3435 and 3500
📌 Conclusion
Bulls have a chance — it's important to watch the price behavior around 3265 and look for long setups on lower timeframes. For example, a retest of 3265 after a breakout and absorption of the retest candle by the buyer, similar to what happened at the 3167 level on the hourly timeframe.

USDCAD Bullish Continuation PatternStill in this trade, I entered about 1.5 weeks ago based on the weekly bullish trendline. Now on the lower timeframes ( 4hr, 1hr, 30m ) we can see a nice pattern formation being formed. I believe it will continue bullish based on the weekly trendline confluence.


Long trade
🟩 Buyside Trade Log
📈 Pair: BONK/USDT
🏷️ Type: Intraday | LND Session AM
🧠 Setup: Breakout
📅 Date: Sunday, 18th May 2025
🕥 Time: 10:00 AM
🔹 Entry Price: 0.00001972
🔹 Profit Target: 0.00002159 (+9.48%)
🔹 Stop Loss: 0.00001924 (-2.43%)
🔹 Risk-Reward Ratio: 3.90
🔍 Reasoning:
The trade was initiated during the LND session AM window, where price action showed a clear breakout from short-term resistance. Momentum aligned with a surge in volume, suggesting strong buyside intent.

Long trade
1Hr TF overview
🟩 Buyside Trade Log
📈 Pair: PEPE/USDT
🏷️ Type: Intraday | LND Session AM
🧠 Setup: Breakout
📅 Date: Sunday, 18th May 2025
🕥 Time: 10:45 AM
🔹 Entry Price: 0.00001317
🔹 Profit Target: 0.00001480 (+12.38%)
🔹 Stop Loss: 0.00001312 (-0.38%)
🔹 Risk-Reward Ratio: 32.60
🔍 Reasoning:
This buyside trade capitalised on a breakout from consolidation during the London AM session.
