DXY. Midterm Analysis of the US Dollar IndexHey traders and investors!
📍 Context
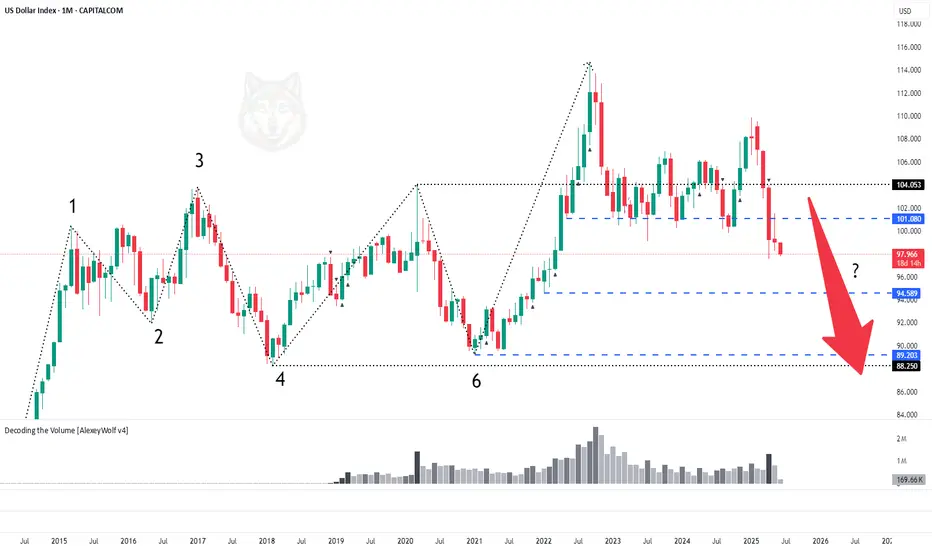
On the monthly timeframe, the market was in a range. The price broke above the upper boundary and was long supported around the 101.080 level. This level was repeatedly tested by sellers and now appears to have been broken.
📊 Monthly targets: 89.20 and 88.300.
🔎 Analysis
Why might the downward movement continue?
Daily TF
On the daily chart, we can see that on the day buyers returned to the 101.080 level, the main volume was accumulated in a buyer candle right at and slightly above the level. This suggests the level was defended by sellers. This indicates they are currently in control, and the decline may continue. Let’s look at the nearest potential buyer activity levels.
11-day TF
The price has once again broken downward out of the range. Below, there is a small consolidation area formed during the previous upward movement. Its boundaries are: upper boundary — 97.385, lower boundary — 94.589.
🎯 Trade Idea: Rebounds from the upper boundary at 97.385 are possible, but overall the priority remains with a move into this range and towards the 95.00–94.589 zone.
This analysis is based on the Initiative Analysis concept (IA).
Wishing you profitable trades!
Multiple Time Frame Analysis
EURUSD| Riding the Real FlowInitially waited for price to return to my first POI — didn’t happen. Instead, price BOS’d and unlocked fresh liquidity. No panic. I’m not here to force old zones — I follow structure.
Now we’ve got:
✅ 4H bullish momentum still active
✅ Fresh BOS creating new intent + liquidity
✅ 30M heavy bullish push showing strength
✅ Top-down alignment from 4H → 30M → 5M
✅ Mitigation + sweep + OB entry on deck
That clean demand zone is holding value — I’m just staying patient, letting price do its thing. As always: “We sit. We wait. We strike.”
When it aligns — I’m in. Until then, I’m chilling like the sniper I am.
#SMC #JuicemannnFlow #TopDownMastery #ForexSniper #StructureTalks #InducementKing #EURUSD #RideTheMomentum #4HTo5M #LiquidityReads #FundedTraderMoves
Bless Trading!


GBPCHF 11/06/2025Weekly:
-Bullish M pattern.
-Weekly support.
Daily:
-Inverse H&S pattern.
-Liquidity Sweep.
4H:
-Bullish M pattern.

USDCAD 11/06/2025Weekly:
-Weekly resistance.
-Last weekly bearish candle could get filled.
Daily:
-Bearish W pattern.
-IC.
4H:
-Bearish W pattern.

Bitcoin H4 – UpdatePrice consolidating just under $110K with low sell volume. This is bullish compression, not weakness.
📍 Key support: $109K
📍 Breakout above: $110.3K → 🚀 $112K+ in sight
📍 Invalidated below: $108K
This is the calm before the next leg up.

SHORT ON SPY (SPX/USD)SPY has failed to create higher highs and given us a head and shoulders pattern.
I will be selling spy to the next level of demand looking to catch 50-60 points.

XAU/USD 11 June 2025 Intraday AnalysisH4 Analysis:
-> Swing: Bullish.
-> Internal: Bullish.
Analysis and bias remains the same as analysis dated 23 April 2025
Price has now printed a bearish CHoCH according to my analysis yesterday.
Price is now trading within an established internal range.
Intraday Expectation:
Price to trade down to either discount of internal 50% EQ, or H4 demand zone before targeting weak internal high priced at 3,500.200.
Note:
The Federal Reserve’s sustained dovish stance, coupled with ongoing geopolitical uncertainties, is likely to prolong heightened volatility in the gold market. Given this elevated risk environment, traders should exercise caution and recalibrate risk management strategies to navigate potential price fluctuations effectively.
Additionally, gold pricing remains sensitive to broader macroeconomic developments, including policy decisions under President Trump. Shifts in geopolitical strategy and economic directives could further amplify uncertainty, contributing to market repricing dynamics.
H4 Chart:
M15 Analysis:
-> Swing: Bullish.
-> Internal: Bearish.
Analysis and bias remains the same as analysis dated 22 May 2025.
In my analysis from 12 May 2025, I noted that price had yet to target the weak internal high, including on the H4 timeframe. This aligns with the ongoing corrective bearish pullback across higher timeframes, so a bearish internal Break of Structure (iBOS) was a likely outcome.
As anticipated, price targeted strong internal low, confirming a bearish iBOS.
Price has remained within the internal range for an extended period and has yet to target the weak internal low. A contributing factor could be the bullish nature of the H4 timeframe's internal range, which has reacted from a discounted level at 50% of the internal equilibrium (EQ).
Intraday Expectation:
Technically price to continue bullish, react at either premium of internal 50% EQ or M15 demand zone before targeting weak internal low priced at 3,120.765.
Alternative scenario:
Price can be seen to be reacting at discount of 50% EQ on H4 timeframe, therefore, it is a viable alternative that price could potentially print a bullish iBOS on M15 timeframe.
Note:
Gold remains highly volatile amid the Federal Reserve's continued dovish stance and persistent geopolitical uncertainties. Traders should implement robust risk management strategies and remain vigilant, as price swings may become more pronounced in this elevated volatility environment.
Additionally, President Trump’s recent tariff announcements are expected to further amplify market turbulence, potentially triggering sharp price fluctuations and whipsaws.
M15 Chart:

Gold stuck slowly correcting the bearish imbalancesExplained in video. Please let me know if there is anything I missed in this analysis!
Don't forget to like and share 🔑

GBPCAD Counter-Trend SELL(Weekly) - Price hit previous extreme high at (1.85932 - 1.87820) and was rejected forming double top neckline at (1.81470 - 1.80561) .
(Weekly) - Previous Week Candle Close is Shooting Star showing sellers taking action at Key Resistance level.
(Daily) - Price formed double top inside our resistance level at (1.85932 - 1.87820).
(Daily) - Price broke double neckline at (1.85533 - 1.85774).
(H4) - Price was in distribution at (1.86602 - 1.85774).
(H4) - Rising Trendline that price broke connecting (1.80561 - 1.86011).
Trade Entry.
(H4) - Wait for price to retest our daily double top neckline & low of the distribution at (1.85533 - 1.85774) to join the reversal.
(H4) - Take profit at Weekly Double Top Neckline at (1.81470 - 1.80561).

GBPUSD ANALYSISAfter seeing the previous daily candle close bearish and below support, we could expect the move to continue since the 4hr also has structural type move pushing to the downside

EURJPY ANALYSISAfter seeing the previous daily candle close really bullish above 165.000 key weekly are, we could expect the bullish momentum to continue with confirmations on the 4hr structure making HH and HL

XAUUSD 10/06/2025Weekly:
-Bullish M pattern.
-FVG.
-Last weekly bullish candle could get filled.
Daily:
-Bullish M pattern.
4H:
-Bullish M pattern.

possible trend shift on XAUUSD on the lower TFright now , we are following current price movement
so be realistic and apply proper risk management

EURUSD| Buy Flow In PlayGot price respecting my top-down flow — 4H to 5M is in full alignment right now. We swept key liquidity levels and price held structure clean, giving me reason to look for a buy continuation.
Could’ve posted a more detailed breakdown (order blocks, FVGs, etc.), but I’ll save that sauce for another time. Just curious what y’all see here — feel free to share your take on this play. I’m always open to sharp minds tapping in.
Let’s see how this unfolds. 🧠💧
#EURUSD #SmartMoneyConcepts #LiquiditySweep #PriceActionTrading #TopDownAnalysis #InducementKing
Bless Trading!

SHORT ON NZD/JPYNZD/JPY has given us a CHOC (change or character) to the downside breaking a previous low.
I will be looking for NZD/JPY to retouch the supply area before dropping.
Aiming for 100-200 pips easy!

XAU/USD 10 June 2025 Intraday AnalysisH4 Analysis:
-> Swing: Bullish.
-> Internal: Bullish.
Analysis and bias remains the same as analysis dated 23 April 2025
Price has now printed a bearish CHoCH according to my analysis yesterday.
Price is now trading within an established internal range.
Intraday Expectation:
Price to trade down to either discount of internal 50% EQ, or H4 demand zone before targeting weak internal high priced at 3,500.200.
Note:
The Federal Reserve’s sustained dovish stance, coupled with ongoing geopolitical uncertainties, is likely to prolong heightened volatility in the gold market. Given this elevated risk environment, traders should exercise caution and recalibrate risk management strategies to navigate potential price fluctuations effectively.
Additionally, gold pricing remains sensitive to broader macroeconomic developments, including policy decisions under President Trump. Shifts in geopolitical strategy and economic directives could further amplify uncertainty, contributing to market repricing dynamics.
H4 Chart:
M15 Analysis:
-> Swing: Bullish.
-> Internal: Bearish.
Analysis and bias remains the same as analysis dated 22 May 2025.
In my analysis from 12 May 2025, I noted that price had yet to target the weak internal high, including on the H4 timeframe. This aligns with the ongoing corrective bearish pullback across higher timeframes, so a bearish internal Break of Structure (iBOS) was a likely outcome.
As anticipated, price targeted strong internal low, confirming a bearish iBOS.
Price has remained within the internal range for an extended period and has yet to target the weak internal low. A contributing factor could be the bullish nature of the H4 timeframe's internal range, which has reacted from a discounted level at 50% of the internal equilibrium (EQ).
Intraday Expectation:
Technically price to continue bullish, react at either premium of internal 50% EQ or M15 demand zone before targeting weak internal low priced at 3,120.765.
Alternative scenario:
Price can be seen to be reacting at discount of 50% EQ on H4 timeframe, therefore, it is a viable alternative that price could potentially print a bullish iBOS on M15 timeframe.
Note:
Gold remains highly volatile amid the Federal Reserve's continued dovish stance and persistent geopolitical uncertainties. Traders should implement robust risk management strategies and remain vigilant, as price swings may become more pronounced in this elevated volatility environment.
Additionally, President Trump’s recent tariff announcements are expected to further amplify market turbulence, potentially triggering sharp price fluctuations and whipsaws.
M15 Chart:

Why I Think Gold Will Continue Buying...Technical AnalysisHey Rich Friends,
Happy Monday! I think Gold will continue to buy today and maybe this week. This is only my technical analysis so make sure to check the news and cross-reference any indicators you have on your charts.
- The candles have crossed and closed above the previous high on H1 and H4 showing bullish momentum.
- After the break of the previous high, H1 was resistance has been retested as support confirming bullish momentum.
- The stochastic is facing up, the fast line (blue) is above the orange line (slow) and 1 or both lines have crossed above the 80% line. These are bullish confirmations for me.
Additional information:
- Wait for the current candle to close for more bullish confirmation.
- I would set buy stops/TPS to 3400. I will be using previous highs as TPs and previous lows as SL.
Only enter this trade if it make sense to you.
Peace and Profits,
Cha

Rivian Kicking Off Potential UptrendHey, all. I'll get down to it. Obviously NASDAQ:RIVN has been an incredibly tough stock to own. Fake out after fake out. It has been brutal - unless you have been nimble enough to buy the dips and sell the rips.
I would like to posit, however, that NASDAQ:RIVN is going to start marching back higher here over time. In the signal system I have been taught via the T@M strategy, Rivian is putting in a range expansion to the upside on the weekly time frame. If you take the range of the past monthly consolidation period, attach it to the "mode" (or central zone of the consolidation range), it gives you a target of $25 over the next few months. Now, whether this is another fake out just to reverse on us... again... remains to be seen of course. It is early in the idea. But potentially offers a decent risk/reward position here.
I just do not see Rivian really going away at all and, if they can keep refining their business, they could see some success going forward. Anyway, hope you enjoy this idea! As always, position carefully as the market is risky business.
Including the Daily Chart below for your reference as well.

AUDNZD 09/06/2025Weekly:
-OB.
-Liquidity sweep.
-Weekly low acting as support.
Daily:
-Inverse H&S pattern.
-Bullish M pattern.
-IC.
4H:
-Bullish M pattern.


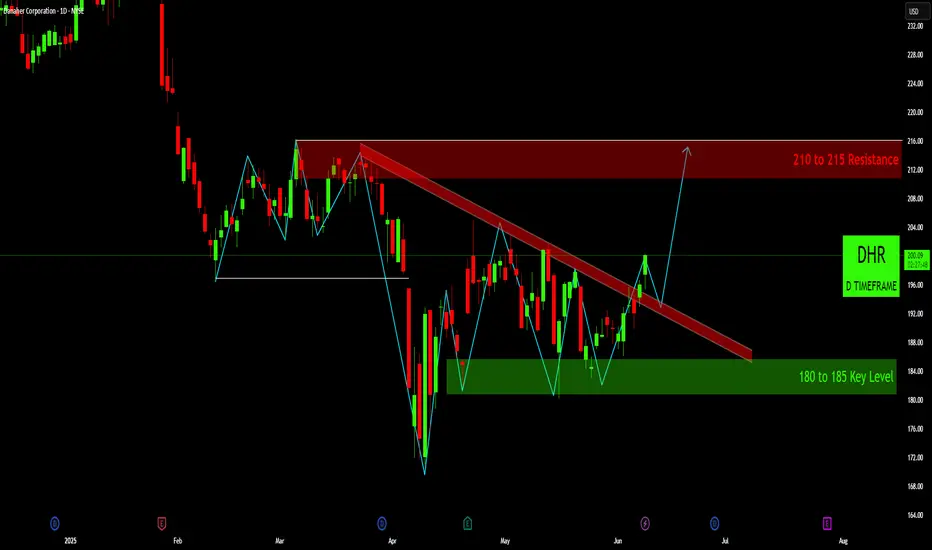
DHR: Bullish Breakout from Descending TrendlineOverview: Danaher Corporation (DHR) on the daily chart appears to have undergone a significant bearish pattern followed by a period of consolidation. The recent price action suggests a potential bullish reversal, as the stock has now broken above a key descending trendline, signaling a shift in momentum.
Context & Price History:
Prior Topping Pattern: From roughly February to April, DHR exhibited classic signs of a topping formation. The price repeatedly failed to break above the 210 to 215 Resistance zone (red shaded area), indicating strong supply in this region. The price action leading to the sharp April decline could be interpreted as a Head and Shoulders pattern or a triple top, with the white horizontal line around 196- 197 acting as a critical "neckline" or support level.
Sharp Decline & Key Support: Following the breakdown from the neckline in April, DHR experienced a significant sell-off, finding strong demand and bottoming out within the 180 to 185 Key Level support zone (green shaded area). This zone has proven to be a robust area of buyer interest.
Consolidation & Descending Trend: Since the April lows, DHR has been trading within a range, largely constrained by a descending trendline (thick red diagonal line) acting as dynamic resistance, while finding support at the 180-185 key level. This price action formed a descending triangle or wedge-like pattern.
Key Levels & Patterns:
Major Resistance (210 to 215): A strong supply zone where sellers have repeatedly stepped in. This will be the primary upside target if the current bullish momentum sustains.
Key Support (180 to 185): A critical demand zone that has held up well, providing a strong foundation for the recent recovery.
Descending Trendline (Red): This dynamic resistance has capped rallies since March/April. A decisive break above it is a bullish signal.
Pivotal Level (~196-197, White Line): This level acted as prior support (neckline) before the April drop. Now, it serves as a minor horizontal resistance that the price has recently overcome, potentially flipping to support on a retest.
Current Situation (As of Analysis):
DHR is currently trading around $200. Critically, the price has made a strong move above the long-standing descending trendline. This breakout suggests that bullish sentiment is gaining control after a prolonged period of consolidation.
Potential Scenarios:
Bullish Continuation (Primary Indication on Chart):
Confirmation: The chart's projection anticipates a retest of the broken descending trendline (which now acts as support) or the ~
196=197 pivotal level, followed by a bounce and continuation higher.
First Target: Upon a successful retest and bounce, the immediate target for buyers would be the 210 to 215 Resistance zone.
Why: A confirmed breakout from a multi-month descending trendline, especially after holding strong key support, is a strong bullish reversal signal.
Bearish Rejection / Fakeout:
Confirmation: If DHR fails to hold above the broken descending trendline and closes convincingly back below it (and potentially below the ~196-197 level), it would suggest that the breakout was a "fakeout."
Downside Potential: In such a scenario, the price could re-enter the consolidation range and potentially retest the 180 to 185 Key Level.
Confirmation & Invalidations:
Bullish Confirmation: A successful retest of the descending trendline (now support) with a clear bounce, or a sustained daily close above the ~196-197 level, preferably with increasing volume.
Invalidation of Bullish Setup: A decisive daily close back below the descending trendline and the ~ 196-197 pivotal level would suggest that the bullish momentum has faltered and the current breakout might be false.
Conclusion:
DHR has presented a compelling technical setup with a breakout from a significant descending trendline. This breakout, combined with the stock holding firm at the 180-185 key support, suggests a potential shift in trend from bearish consolidation to a renewed bullish advance. Traders should look for confirmation of the breakout (e.g., a successful retest and bounce) before targeting the 210-215 resistance zone.
Disclaimer:
The information provided in this chart is for educational and informational purposes only and should not be considered as investment advice. Trading and investing involve substantial risk and are not suitable for every investor. You should carefully consider your financial situation and consult with a financial advisor before making any investment decisions. The creator of this chart does not guarantee any specific outcome or profit and is not responsible for any losses incurred as a result of using this information. Past performance is not indicative of future results. Use this information at your own risk. This chart has been created for my own improvement in Trading and Investment Analysis. Please do your own analysis before any investments.
Skeptic | USD/JPY Analysis: Sharp Uptrend Triggers Ready!Hey, traders, it’s Skeptic! 😎 CMCMARKETS:USDJPY is gearing up for a sharp uptrend move, and if you sleep on it, you might miss it, jump in late, and get stopped out. So, let’s set our scenarios and triggers now to make quick, sharp decisions instead of lagging.
Daily Timeframe: The Big Picture
We were in a major bearish trend but now seem stuck in a triangle. The heavy bearish momentum and support zone at 142.232–142.604 —our key level—has held strong with reactions every time we hit it. But, the bearish moves are getting weaker , with shallower slopes and smaller, choppier candles, signaling fading momentum and a higher chance of a reversal. Still, we need a trigger to go long—without it, jumping in is risky. As a skeptical trader , I need solid reasoning for every move. That’s our vibe! :)))
Now, let’s hit the 4-Hour Timeframe for our triggers.
We’ve got a descending trendline , and breaking it upward could spark an uptrend. But here’s the deal: this isn’t a continuation pattern—a break means a trend reversal, so we need extra confirmation beyond just the break.
Our main long trigger is a break above resistance at 145.071 .
Stop loss? Place it below the trendline, previous support, or last low—depends on your strategy.I’m a breakout trader myself
( check my article for deets! ).
For confirmation, watch RSI hitting overbought—it backs the uptrend momentum and can push you to your R/R faster. 😊 I’ll drop an RSI tutorial soon , so stay tuned! If we lose the support zone ( 142.232–142.604 ), expect the bearish trend to continue, so focus on shorts then.
Final word: No FOMO . Wait for your triggers and confirmations. Our motto? No FOMO. No hype. Just reason :)
💬 Let’s Talk!
If this analysis helped you, smash that boost—it means a lot! 😊 Got a pair or setup you want me to hit next? Drop it in the comments. Thanks for chilling with me—keep trading smart! ✌️
