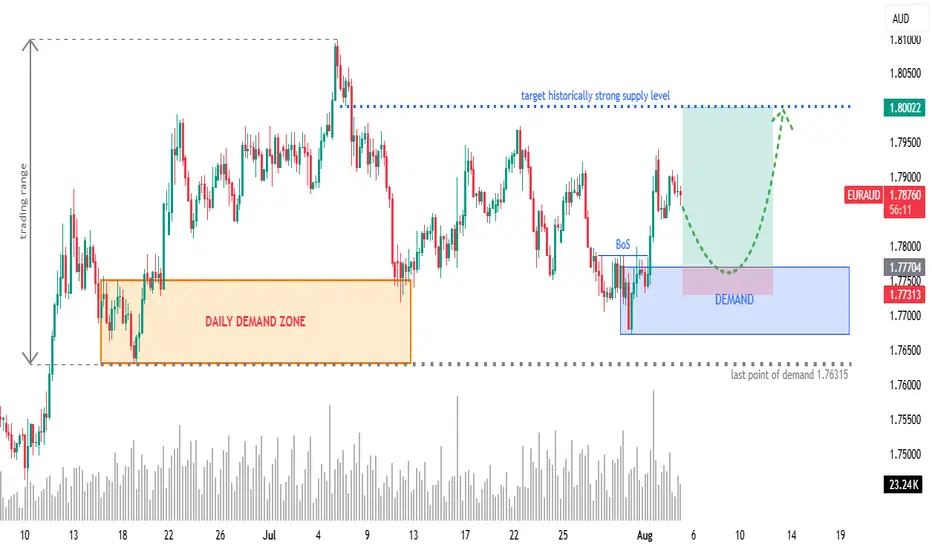
EURAUD 4H: Long Setup from Fresh Demand ZoneOverview:
OANDA:EURAUD retracing into a newly formed 4H demand zone after a bullish Break of Structure (BoS). Eyes on continuation towards a historically significant supply zone at 1.8000.
🧩 Setup Details
• Asset & Timeframe: EURAUD, 4H
• Bias: Bullish
• Entry Zone: 1.77300 – 1.77700 (DEMAND area)
• Targets:
🎯 T1 = 1.7900 (minor reaction level)
🎯 T2 = 1.8000 (historical supply level)
• Stop-Loss: Below 1.77300 (last valid demand)
• Risk-Reward: Approx. 1:6+
🧠 Why Now? (Trade Rationale)
• ✅ Fresh 4H Demand Zone: Price is retracing into a clear demand zone after rejecting lower prices.
• ✅ Break of Structure (BoS): Bullish BoS confirms shift in order flow.
• ✅ Volume Confirmation: Increasing demand near current price levels.
• ✅ Clear Liquidity Sweep: Price likely swept short-term lows before BoS.
• ✅ Target Supply Zone: 1.8000 is a well-respected historical supply/resistance level — clean magnet for price.
⏱ Multi-Timeframe Context
• Daily Chart: Price is reacting off a larger DAILY DEMAND ZONE. Trend bias is bullish.
• 4H Chart: Structure break + demand formation suggest continuation.
• 1H/Entry Level: Monitor price action in the blue zone for lower-timeframe confirmation (e.g. bullish engulfing, flip zones, LQ sweep, etc.) and potentially greater risk-reward.
📉 Risk Management & Duration
• Stop below 1.76315 keeps you protected from deeper invalidation.
• Trade Duration: Short to mid-term (1–4 days).
• Position Size: Scale based on volatility; ideal for swing trade conditions.
📌 Trade Plan Summary
📍 Watch for bullish PA on re-entry into demand (1.77300–1.77700)
📍 Set SL below 1.76315
📍 TP1 at 1.79000 — partials advised
📍 TP2 at 1.80000 — strong historical level
📍 Adjust SL to BE on momentum breakout
Multiple Time Frame Analysis
EURUSD BuyLIT cycle, daily cycle. Price took liquidity from the low and asia has equal highs which is first TP.

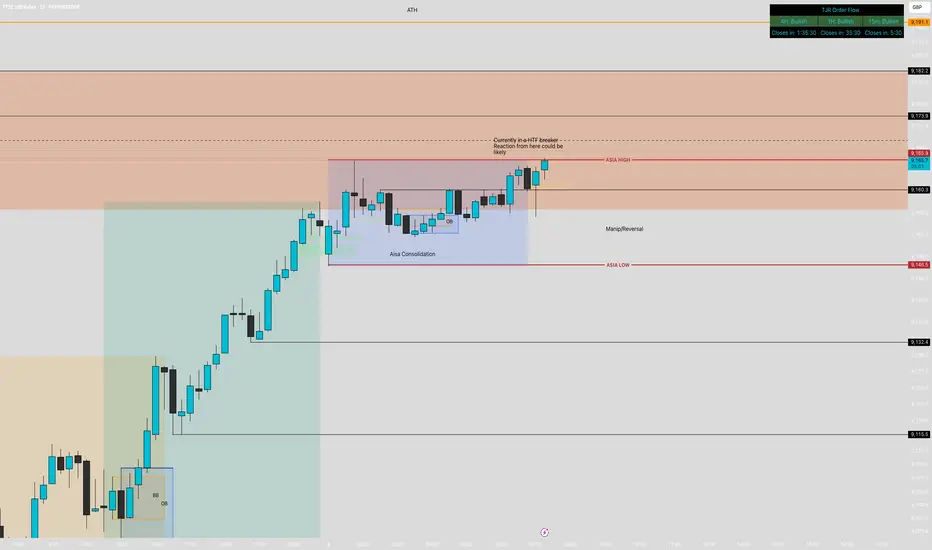
UK100 potential bearishCurrently in a HTF breaker and Order block.
Asia has consolidated for the whole session but seems to be sweeping the liquidity to the upside.
Waiting on a sweep to the upside with a break of structure to the down side. Plenty of liquidity to the downside to collect before we could see new ATH formed.
ETH forming double topETH is forming a double top, nice confluence to what BTC is doing rn
Maybe that's the turnaround and its going back down for now.

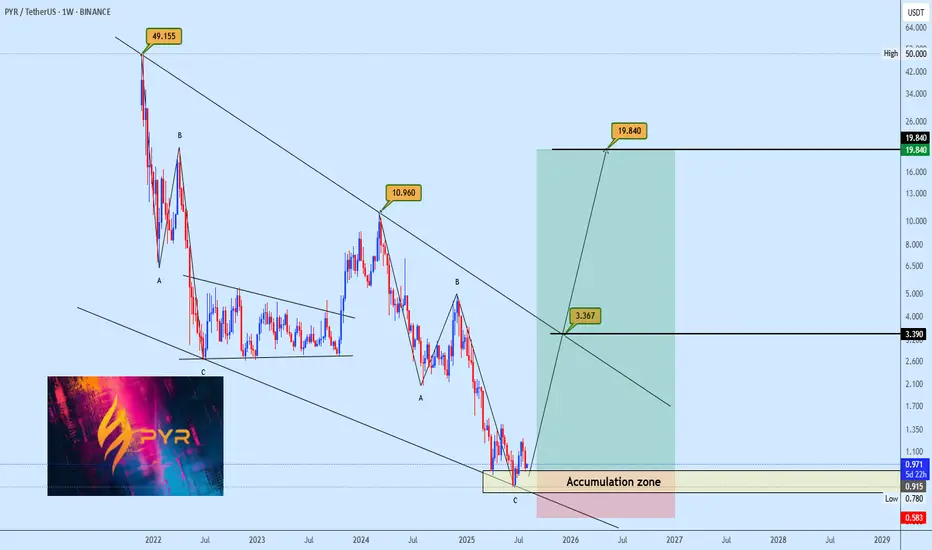
PYR Falling Wedge OpportunityPYR is currently forming a potential falling wedge, with price recently bouncing off the bottom support zone. The plan is to accumulate within the lower region of the wedge and anticipate a move toward the upper boundary. Profit targets are highlighted on the chart for clearer decision making. Keep your risk management in check and let us know your view.
Your feedback is always welcome
Altcoins Recovering: TOTAL3 Bounces from Key Support ZoneIn my previous analysis on TOTAL3, I mentioned that I'm working with two possible bullish scenarios for altcoins. It now seems we're firmly in Scenario #2.
📉 The price dropped exactly into the highlighted support zone, then yesterday we saw a clean recovery and reversal starting right from that area — a textbook technical reaction.
📈 At the time of writing, TOTAL3 sits at $986B, and a break above the $995B–$1T resistance could trigger a new leg up for altcoins.
🎯 Short- and mid-term targets remain:
• $1.08T (recent top)
• $1.15T
• Potential for new all-time highs if momentum builds
✅ As long as price holds above the $920–$930B support zone, bulls remain in control. This keeps the door open for selective altcoin entries — ideally, projects with real structure, strong tokenomics, and clear momentum.

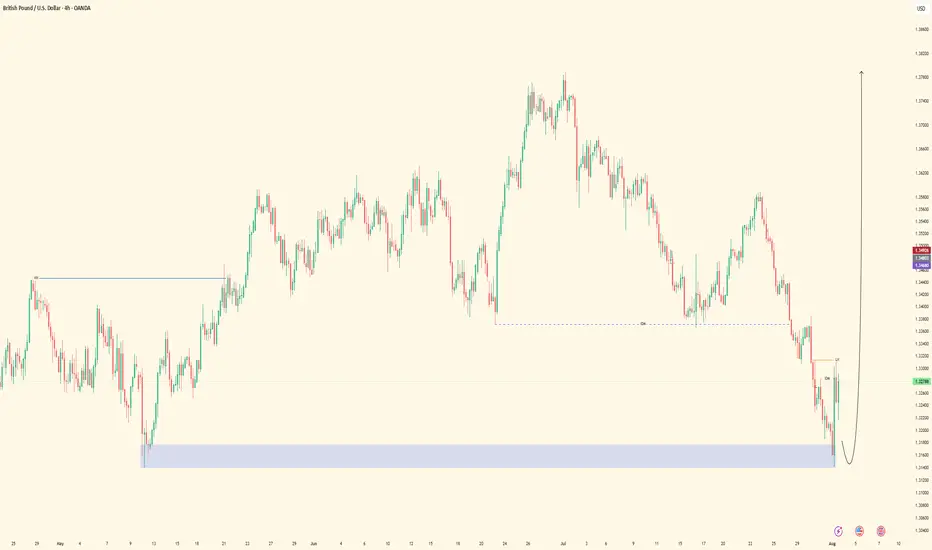
GBPUSD ANALYSISAfter seeing the previous day close and reject an area of resistance and a break below the trendline area of support on the lower timeframe, but with the daily still bearish the 4hr is pushing to the upside. A break of 4hr structure support could be a clear signal that sellers are now pushing price.

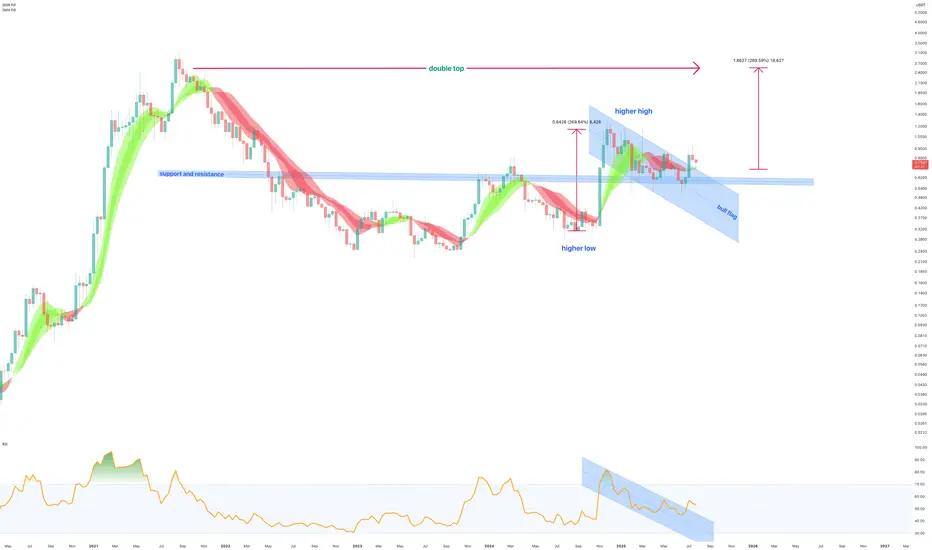
August 4th - Cardano (ADA) bull flag to print 250% move to $2.50
On the above 10 day chart price action is shown with a 40% correction since December last year. A number of reasons now exist for a bullish outlook, including:
Support and resistance
Price action confirms support on past 3 year resistance around 60 cents
Trend reversal
The support confirmation is followed by higher low and higher high prints.
The Bull flag
A measured move from the first impulsive wave will see price action move to the previous all time high of circa $2.50
Summary
The flag set up is fairly reliable with a high success rate for continuation with 60% probability. However avoid greed at the forecast area, many people entered the market at $2.50 in 2021. This was the worst possible moment and have been waiting for this opportunity to exit. Do not be their exit liquidity!
Is it possible price action continues lower? Sure.
Is it probable? No.
Ww
EURJPY ANALYSISAfter seeing the previous weekly candle close bearish and the daily from Monday close below the low of the last bearish candle which is a sign of sellers strength, we could expect further sells to continue but a simple retracement on the 4hr back to an area of interest for a potential LH structure point before further sells

ARUSDT Gearing Up for a Powerful Wave 3 LaunhARUSDT has completed its corrective phase via a well defined ending diagonal, followed by a strong impulsive move completing wave 1. Price recently tested a significant supply zone, leading to a sharp retracement toward $4.48, aligning with the previous bottom structure.
This zone is projected to form the immediate base, and our plan is to accumulate within this range, targeting the anticipated wave iii, historically known as the strongest and most extended move in the Elliott Wave sequence.
The entry plan and potential targets are clearly outlined on the chart. Feel free to share your view.

USDCHFHello Trader
I expect the price to start growing from these areas
The stop loss for this scenario is also visible in the image above❌
I hope you make the most of it...

CADJPY: Bearish Move From Resistance 🇨🇦🇯🇵
There is a high chance that CADJPY will drop
from a key daily resistance cluster.
As a confirmation, I see a triple top pattern
on an hourly time frame and a violation of its neckline.
Goal - 106.9
❤️Please, support my work with like, thank you!❤️
I am part of Trade Nation's Influencer program and receive a monthly fee for using their TradingView charts in my analysis.

LONG ON NZD/JPYNZD/JPY has given us a CHOC (change of character) on the lower timeframe after finding support.
I expect NJ to pullback to demand and then rise to the next level of supply for over 100 pips.

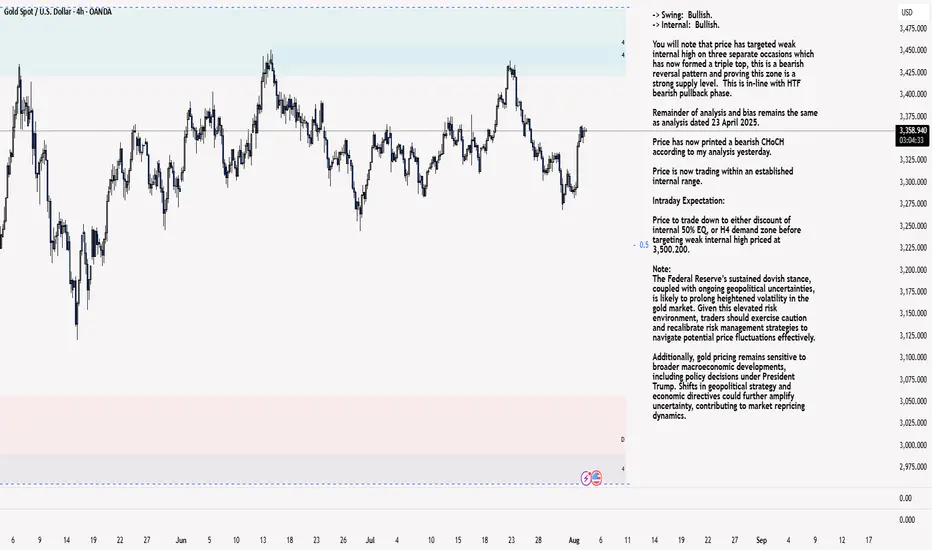
XAU/USD 04 August 2025 Intraday AnalysisH4 Analysis:
-> Swing: Bullish.
-> Internal: Bullish.
You will note that price has targeted weak internal high on three separate occasions which has now formed a triple top, this is a bearish reversal pattern and proving this zone is a strong supply level. This is in-line with HTF bearish pullback phase.
Remainder of analysis and bias remains the same as analysis dated 23 April 2025.
Price has now printed a bearish CHoCH according to my analysis yesterday.
Price is now trading within an established internal range.
Intraday Expectation:
Price to trade down to either discount of internal 50% EQ, or H4 demand zone before targeting weak internal high priced at 3,500.200.
Note:
The Federal Reserve’s sustained dovish stance, coupled with ongoing geopolitical uncertainties, is likely to prolong heightened volatility in the gold market. Given this elevated risk environment, traders should exercise caution and recalibrate risk management strategies to navigate potential price fluctuations effectively.
Additionally, gold pricing remains sensitive to broader macroeconomic developments, including policy decisions under President Trump. Shifts in geopolitical strategy and economic directives could further amplify uncertainty, contributing to market repricing dynamics.
H4 Chart:
M15 Analysis:
-> Swing: Bullish.
-> Internal: Bullish.
H4 Timeframe - Price has failed to target weak internal high, therefore, it would not be unrealistic if price printed a bearish iBOS.
The remainder of my analysis shall remain the same as analysis dated 13 June 2025, apart from target price.
As per my analysis dated 22 May 2025 whereby I mentioned price can be seen to be reacting at discount of 50% EQ on H4 timeframe, therefore, it is a viable alternative that price could potentially print a bullish iBOS on M15 timeframe despite internal structure being bearish.
Price has printed a bullish iBOS followed by a bearish CHoCH, which indicates, but does not confirm, bearish pullback phase initiation. I will however continue to monitor, with respect to depth of pullback.
Intraday Expectation:
Price to continue bearish, react at either M15 supply zone, or discount of 50% internal EQ before targeting weak internal high priced at 3,451.375.
Note:
Gold remains highly volatile amid the Federal Reserve's continued dovish stance, persistent and escalating geopolitical uncertainties. Traders should implement robust risk management strategies and remain vigilant, as price swings may become more pronounced in this elevated volatility environment.
Additionally, President Trump’s recent tariff announcements are expected to further amplify market turbulence, potentially triggering sharp price fluctuations and whipsaws.
M15 Chart:
NAS100 - Stock Market Heading Down?!The index is trading in its medium-term ascending channel on the four-hour timeframe between the EMA200 and EMA50. However, if the index corrects upward towards the specified supply zone, it is possible to sell Nasdaq with better risk-reward.
In recent days and weeks, the Nasdaq Composite Index once again approached its historic highs, even setting a new all-time record. However, following the latest jobs data and the Federal Reserve meeting, the index experienced a price correction.
Unlike many previous bullish phases that were driven largely by short-term momentum or emotional reactions, the current upward trend in the Nasdaq reflects structural maturity and market stabilization. Institutional capital inflows and strong corporate earnings have together painted a picture of a more stable and predictable future for this index.
According to recent financial data, U.S. equity funds received over $6.3 billion in net inflows during the final week of July—marking the first positive inflow after three consecutive weeks of outflows.
The key engine behind this growth continues to be the robust performance of tech companies. Firms such as Meta, Microsoft, and AI-oriented companies like Nvidia and Broadcom posted exceptionally strong earnings reports. These results not only exceeded analysts’ expectations but also fueled significant gains in their stock prices, contributing to the Nasdaq’s momentum. Despite some sector-specific concerns—for instance, regarding Qualcomm in the semiconductor space—the broader tech sector has sustained its upward trajectory and even extended that momentum to adjacent industries, especially those involved in cloud and AI supply chains.
Meanwhile, advisors to Donald Trump revealed that he plans sweeping reforms at the U.S. Bureau of Labor Statistics (BLS). This announcement followed the July jobs report, which showed only 73,000 new jobs and sharp downward revisions to prior months’ figures.
On Truth Social, Trump accused the current BLS Commissioner, Erica McEnturfer, of politically manipulating employment data and ordered her immediate removal. Secretary of Labor Lori Chavez-DeRemer subsequently announced that Deputy Commissioner William Witrofsky would serve as acting head. Trump emphasized that economic data must be accurate, impartial, and trustworthy—and not politically skewed.
Following this leadership change, a broader debate has emerged around how employment statistics are collected and reported. While statistical revisions have long been a routine, non-political process since 1979, there are now growing questions about whether a better system for gathering and publishing this critical data could be developed.
As a nonpartisan branch of the Department of Labor, the BLS publishes its monthly employment report at 8:30 AM Eastern on the first Friday of each month. The data is gathered from surveys of around 629,000 business establishments.
Analysts have cited several reasons for the frequent need for revisions:
• Late responses from firms
• Delays from large corporations that distort preliminary figures
• Recalculations due to seasonal adjustments (e.g., holidays or weather)
• Demographic shifts impacted by immigration or deportation
• Annual revisions based on finalized tax records
With a relatively light economic calendar in the U.S. this week, traders have turned their focus to the latest developments in trade negotiations—particularly talks with countries that have yet to finalize trade agreements with Washington.
Although the U.S. has reached deals with key partners including the UK, EU, Japan, and South Korea, no formal agreement has yet been made with China to extend the current trade truce, which is set to expire on August 12.
The new U.S. tariff plan proposes a baseline 10% rate for most countries, but some—like India and Switzerland—face much higher rates of 25% and 39%, respectively. However, since implementation of the tariffs has been postponed until August 7, there’s still time for further negotiations and possible rate reductions. Sources close to the White House suggest the administration is eager to continue talks.
What’s now becoming clear is the sheer magnitude of the proposed tariff shifts—far beyond pre-trade-war averages. These changes could have more severe consequences than previously estimated, potentially pushing up U.S. inflation while simultaneously threatening global growth. As such, markets may be entering a fresh wave of volatility.
Compounding these concerns is the U.S. Treasury’s upcoming bond issuance schedule, which could add to market instability.
Also on the radar is the ISM Services PMI for July, due Tuesday. Its results will be closely watched for signs on the U.S. dollar’s direction and the Fed’s potential actions at its September meeting.
Notably, as of July 18, 2025, the widely-followed Buffett Indicator—measuring the ratio of market capitalization to GDP—was 2.3 standard deviations above its historical average. This level surpasses even the dot-com bubble era of the early 2000s. The indicator is now firmly in the “overvalued” zone, which often precedes market corrections or even crashes. For context, during the 2008 financial crisis, it was roughly 1.5 standard deviations below the historical norm.

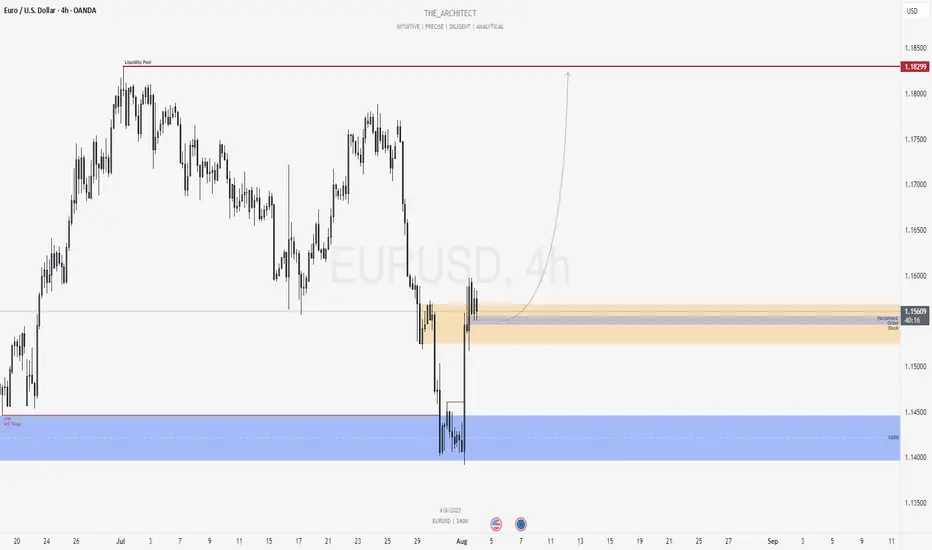
EURUSD: Bullish Continuation from Reclaimed Institutional ZoneGreetings Traders,
In today’s analysis of EURUSD, recent price action confirms the presence of bullish institutional order flow. As a result, we aim to align with this narrative by seeking high-probability buying opportunities at key institutional arrays.
Higher Timeframe Context:
On the weekly timeframe, last week’s candle retraced into a Re-Delivered Re-Balanced (RDRB) Array—a bullish structure often associated with institutional repositioning. From this zone, we anticipate continued bullish delivery towards the weekly liquidity pool, reinforcing a bullish directional bias.
Key Observations on H4:
Bullish Market Structure Shift: Price action on the H4 has decisively shifted bullish, aligning with the higher timeframe’s narrative and confirming our bias.
Reclaimed Order Block Support: Following the bullish shift, price has pulled back into a reclaimed order block—a previously institutional selling zone that, once broken and reclaimed, now acts as a high-probability support area. This becomes a key zone for seeking lower timeframe confirmation entries.
Trading Plan:
Entry Strategy: Look for confirmation entries within the reclaimed order block on lower timeframes (M15–M5).
Target Objective: The draw on liquidity resides at the long-term high, where a cluster of buy-side liquidity is expected to attract price.
For a detailed market walkthrough and in-depth execution zones, be sure to watch this week’s Forex Market Breakdown:
Remain patient and precise in execution. Let the market confirm your bias before entering and manage risk appropriately.
Kind regards,
The Architect 🏛️📈
GBPJPY: More Growth is Coming! 🇬🇧🇯🇵
GBPJPY will likely bounce from a key daily support,
following a formation of a double bottom pattern
on an hourly time frame.
I think that the price will reach 196.7 level soon.
❤️Please, support my work with like, thank you!❤️
I am part of Trade Nation's Influencer program and receive a monthly fee for using their TradingView charts in my analysis.

Dollar Index ProjectionWhere We Were – Market Structure Recap,
The Dollar Index completed a six-month range (110.176 to 96.768) with a bearish engulfing pattern, signaling long-term weakness. From March to June, DXY printed consistent lower lows and closes. July marked a shift with a higher high and close, indicating a possible retracement toward premium levels within the broader downtrend.
Where We Are Now – Current Market Conditions,
DXY is trading near the bottom of its range, interacting with a monthly price imbalance. Last week’s candle closed higher (higher high, higher close), suggesting short-term bullish control.
On the daily timeframe, structure has shifted into a potential sell-to-buy scenario. A new range is defined, and the 62% Fibonacci retracement overlaps with a bearish order block — a likely accumulation zone. The recent daily low is now critical support for this short-term bullish case.
Where We’re Going – Weekly Outlook,
The immediate outlook favors a bullish retracement targeting liquidity above last week’s high and into the monthly imbalance. If support holds, continuation toward premium levels is likely. A break below support invalidates the bullish scenario and shifts the structure bearish.
A false break and rejection (turtle soup) could still keep the bullish case intact if followed by strong buy pressure.
Video Link: www.youtube.com

WTI: downside potentialHi traders and investors!
This analysis is based on the Initiative Analysis concept (IA).
Weekly timeframe
A buyer initiative is tentatively developing, yet the strongest buyer candle (highest volume) produced no follow-through. It was followed by two buyer candles on weak volume. Last week volume expanded again and clustered around 69.975, showing that sellers are still defending this level. Weekly seller targets: 65.628 and 64.378.
Daily timeframe
Sellers remain in control. The chart clearly shows volume manipulation around 69.975. Daily seller targets: 65.628 and 64.736.
Wishing you profitable trades!

8/1/25 - AMZN: new SELL mechanical trading signal.8/1/25 - AMZN: new SELL signal chosen by a rules based, mechanical trading system.
AMZN - SELL SHORT
Stop Loss @ 234.11
Entry SELL SHORT @ 214.75
Target Profit @ 181.53
Analysis:
Higher timeframe: Prices have stayed below the upper channel line of the ATR (Average True Range) Keltner Channel and reversed.
Higher timeframe: Victor Sperandeo's (Trader Vic) classic 1-2-3/2B SELL pattern...where the current highest top breakout price is less or only slightly peaking higher than the preceding top price.

DYDX Approaching Make-or-Break Pivot for Major ReversalThe DYDX/USDT weekly chart outlines a complex corrective WXY structure with price currently approaching the Immediate Drop Target Zone (IDTZ) near $0.50. A failure here could lead to a drop toward the Extreme Demand Zone around $0.079. However, reclaiming $1.132 and breaking above the descending trendline could trigger a bullish reversal toward the Important Supply Zone ($4.42–$4.55).

S&P 500 Bullish Rounding Bottom in PlayS&P 500 continues its upward trajectory, supported by a clearly defined rounding bottom formation. Price has successfully broken above the neckline resistance, followed by a technical pullback which was met with a strong buy reaction, validating this zone as a key demand area.
This pullback area now acts as a critical structural base and the current bounce reinforces bullish continuation bias. The active plan is to accumulate within the buy-back zone and follow the path laid out in the chart towards the projected upside targets.
Drop your stock requests in the comments for a quick analysis, only US-listed stocks will be reviewed under this post.

GU| Bullish Structure | Waiting for 30M CHoCH + OB Mitigation(Refined & Structured):
• Pair: GBPUSD
• Bias: Bullish
• 4H Overview: Bullish structure is given with strong intent. A major higher high was broken to the upside. Price swept significant sell-side liquidity and inducement, then mitigated a refined 4H OB with a clean smart money reaction—clear buyer interest.
• 30M Structure: Currently watching for a proper change of character (CHoCH). Still in analysis mode. Waiting for the lower high on the 30M to be breached and liquidity taken before considering execution.
• Entry Zone: Once price confirms with a CHoCH and mitigates the 30M internal OB, I’ll drop to the 5M to hunt for final confirmation before executing.
• Targets: 5M to 30M structural highs depending on price delivery.
• Mindset Note: The best setups come to those who wait. No rush. Let price do the talking. My trigger isn’t just structure—it’s precision and patience working together.