My Thoughts #012The pair is in a bearish trend on the weekly time
In the bearish trend the pair seems to be making a LH
Meaning we are currently moving up and currently on the lower time frame we are in bullish trend.
The pair still has equal highs open on the weekly time frame.
It further sweeped equal lows on the daily time to fuel for the next move up.
The pair broke out, retested and after that it's been trying to gain more momentum for the upside.
Sells could still happen just use proper risk management
let's do the most
Multiple Time Frame Analysis

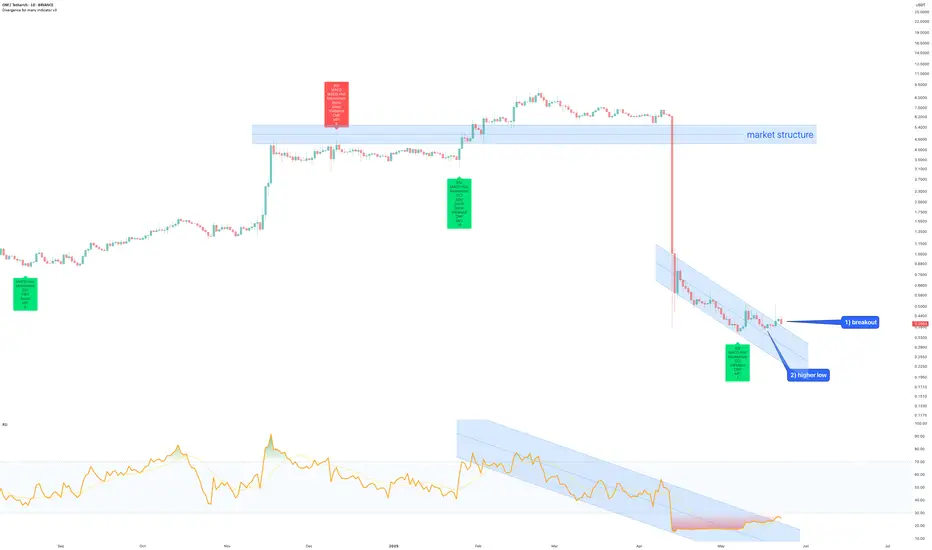
Mantra token (OM) to $4 on return to market structure40 days ago on April 13th price action corrected 95% (if this is not enough convince you the Crypto tokens are a Ponzi scheme I don’t know what is), a number of reasons now exist for traders to open a long position into the remaining sell orders of the once project faithful. The reasons?
1. Price action and RSI resistance breakouts.
2. Trend reversal, price action prints a higher low.
3. A rally followed on the same bullish divergence configuration that printed throughout the history of this token. That positive divergence has printed once more.
4. The forecast is formed on the idea price action returns to market structure before continuing the downtrend. Was about to say nothing goes down in a straight line ;-)
Is it possible price action continue to correct? Sure.
Is it probable? No.
Ww
NASDAQ Markup- Not in the Trade, But the Lesson's ClearDidn’t take this one—not trading NASDAQ right now—but I still mapped it out from the 30M perspective just to stay sharp.
4H gave bullish intent after breaking the major macro LH, so I followed the flow.
Saw a clean 30M inducement sweep, price then mitigated internal structure OB, and I marked exactly where I would’ve entered with LTF confirmation.
Didn’t trade it, but the logic’s there—and if you’ve been watching… you already know what it’s doing now. 🧠📈
Every setup teaches something.
– Inducement King
Bless Trading!

XAUUSD| Bullish Flow Still In PlayGold’s been moving with bullish intent since last week on the 4H—clean, controlled, and no signs of slowing yet.
Now I’m focused on 30M continuation structure, just waiting for the LTF to line up for my next move.
No need to force it—just staying patient and letting price unfold.
Setups come to the disciplined. 🎯
– Inducement King
Bless Trading!

UJ| Counter-Flow Intraday Setup4H structure still showing bearish signs going into next week, but I’m not forcing shorts.
Instead, I’m eyeing intraday buys to play a move back up into 4H supply.
Dropped to the 30M—now just waiting for that inducement sweep into the order flow zone.
Once mitigation hits, I’ll look to the LTFs for that final confirmation.
This is how you ride against the current without getting swept. 🎯
– Inducement King
Bless Trading!

GU| Building the Bullish Case4H showing strong bullish momentum, so I’ve dropped down to the 30M to catch continuation setups.
Right now, I’m watching for SSL to get taken before I look for LTF confirmations and entries.
Letting price do its thing first—patience is part of the play. 🧠
Waiting mode: activated. 🎯
– Inducement King
Bless Trading!

GJ| Bulish Setup Loading..Got the narrative locked in from the 4H—bias is clear.
30M structure is holding strong and pushing the story forward.
Now? Just waiting on price to mitigate the 5M order block for that sniper buy entry. 🎯
Looking to ride this into potential 30M highs.
Precision over impulse. Let price pull the trigger. 💎
– Inducement King
Bless Trading!

EU| Bullish Play in MotionBeen tracking this one from the 4H—structure gave me the bias early, and price been respecting the narrative ever since.
Now I’ve refined it down to the 30M, and bullish structure is clear. Waiting on one last piece:
5M mitigation before entry. 🔍
No rush. No guessing. Just letting price come to me.
We’re almost there. 🎯
– Inducement King
Bless Trading!

ETH/BTC Breakout Alert – Are Altcoins About to Explode?Ethereum just bounced from a multi-year support zone and is testing a critical resistance after breaking out of a falling wedge on the weekly chart!
If ETH/BTC breaks above 0.029, altcoins may finally outperform Bitcoin and start the long-awaited altseason.
📊 Key levels to watch:
Resistance 1: 0.02979
Resistance 2: 0.03740
Strong Pivot: 0.05165
Macro Resistance: 0.07797
🧠 TradeWithMky says:
"When ETH flips BTC, altcoins roar louder!"
🔥 Stay ready for the altcoin wave!
#Ethereum #Altseason #CryptoTrading #ETHBTC #TradeWithMky #Altcoins #Bitcoin #CryptoAnalysis

XAUUSD Bearish Signal | Technical + Custom AlgoSmart Trend Signal | Technical Analysis + Custom Algorithm
This signal is the result of a combination of classic technical trend analysis and a proprietary software I personally developed.

XAUUSD Bearish Signal | Technical + Custom AlgoSmart Trend Signal | Technical Analysis + Custom Algorithm
This signal is the result of a combination of classic technical trend analysis and a proprietary software I personally developed.

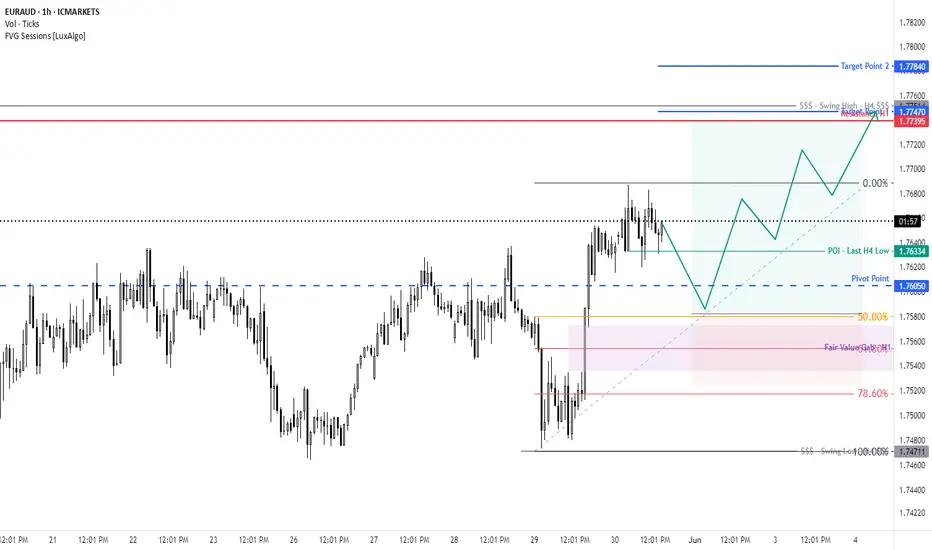
EUR/AUD For Bullishyou can go long now
or
wait for pull-back near by entry point and then go long
general trend is up trend
have fun :)
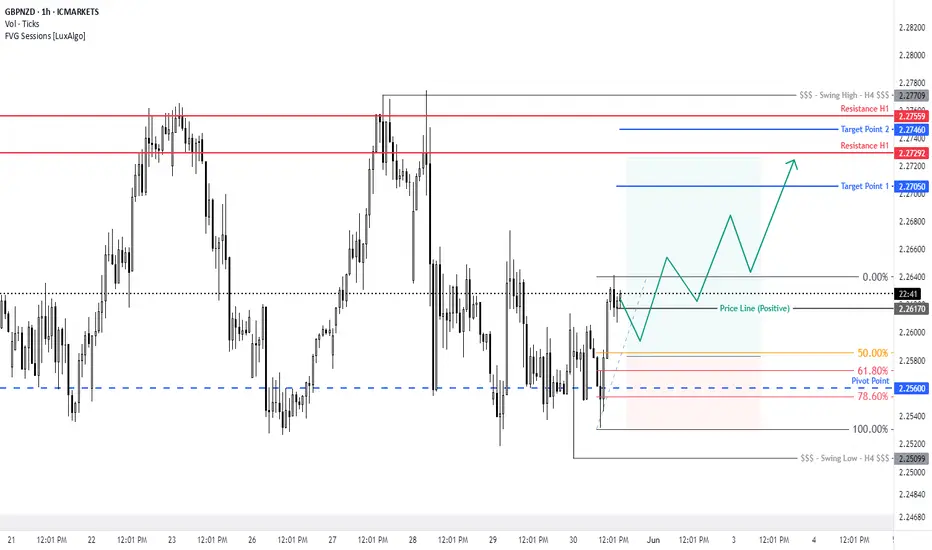
GBP/NZD For Bullishyou can go long now
or
wait for pull-back near by entry point and then go long
general trend is up trend
have fun :)
LONG ON USD/JPYUJ has given a choc (change or character) at a major demand zone.
JPY index structure is currently bearish.
I will buying UJ to the next swing high looking to catch 100-200 pips

XAUUSD Sideway in Price range?Long entry: 3280 - 3290
SL: 3273
TP: Daily Open Price, 1.5R:R
Short entry: Supply Zone or Caution message
SL: 3360, Upper Swing
TP: Lower Low, 2 R:R

EUR/USD Daily Setup TradeWithMkyPrice broke the descending trendline.
Bullish pinbar formed exactly on the midline of the bullish channel.
Buy Entry above the high of the pinbar.
Stop Loss below the pinbar low.
Target 1: 1.15244
If Target 1 is hit, consider trailing the stop above the channel’s midline.
Clean R:R setup on D1.

EUR/USD Weekly Analysis – Key Price Action Zones & ForecastWelcome back to the long-term EUR/USD roadmap, where we're not just looking at the next move, but building a vision for the next decade.
📉 What's Happening Now?
The market is currently battling between two major macro zones:
Strong Resistance at 1.22 – This is where bulls face their ultimate test. If price breaks through this zone, we could be looking at a sustained bullish trend, with 1.24 and beyond in sight.
First Strong Support at 1.08 – A level that has held in past market corrections, and a key buy signal if we see price rejection with strong confirmation.
Second Support at 1.0176 – If the first level fails, this is where the ultimate buying opportunity lies. Think long-term here. The price tends to rebound sharply from this level.
🎯 The Educational Breakdown:
Here’s how you can approach the price action using the concept of 'range trading' vs 'breakout trading':
1. Bullish Scenario:
Condition to Watch: A breakout above 1.22 would set the stage for the next leg up, with 1.24 as the initial target. This is a high-probability bullish setup. Keep an eye on strong confirmation candles around this resistance, like a bullish engulfing or a close above the level.
2. Bearish Scenario:
Condition to Watch: If price fails to break and retests the support zones, we could see a retracement back down. The first target should be 1.08, but if that level breaks, we’re looking at the 1.0176 support zone, which historically holds.
3. Major Support Opportunities (Unbeatable Long-term Buy):
The 1.06 to 0.97 zone is your "unbeatable first touch support". Price tends to reject hard from this range, offering high-reward long opportunities for those who can time the entry correctly with strong confirmation.
🔥 The Big Picture
This is not just about trading the next week. This is about building a macro trading model that looks at multiple years of price action. Understanding where the big money plays in terms of support and resistance gives you the advantage to position ahead of the market.
🧠 Key Takeaways for Traders:
Be patient with major support zones – This is where price reversals often occur.
If you're playing the breakout, wait for confirmation candles above 1.22 for sustained momentum.
Use multi-timeframe analysis to confirm key levels – Don’t just rely on the weekly chart; lower timeframes (like daily and 4-hour) can provide entry confirmation.
📈 What’s Next?
As we continue through 2025 and beyond, these key zones will play a crucial role in determining EUR/USD's long-term trajectory. Whether you're trading short-term moves or building a macro position, mastering these zones will set you apart from the crowd.
"The best traders are those who anticipate the big moves, not just react to them."
– TradeWithMky
🔔 Follow for more macro insights and exclusive trading strategies.
📈 @TradeWithMky – where the charts talk louder than the noise.

EUR/USD – The 20-Year Gameplan | How to Think Like a Macro TradWelcome to the most important EUR/USD chart you'll see this decade.
This isn't just technical analysis. This is a macro roadmap stretching from 2003 to 2045 — built for serious traders who think beyond the next candle.
@TradeWithMky #Miracle
📚 What This Chart Teaches You:
✅ Long-Term Channeling: How to map 40-year channels that actually hold.
✅ Key Reaction Zones: Learn where multi-year reversals are most likely.
✅ "Range of a Generation": Why EUR/USD could stay trapped for 5+ years.
✅ Two Futures – One Decision Point: Reclaiming the main channel = Ultra Bullish. Rejection = Controlled Descent.
🎯 Trade Plan Logic (Educational Focus)
📌 If price breaks above the range zone, target is a 50% Fibonacci expansion — with 1.36 and 1.55 as the macro resistances.
📌 If price rejects, the pair could drift within a multi-year compression channel targeting the 1.06–0.95 zone over the next decade.
📌 This model blends technical geometry, historical behavior, and trend integrity — skills every pro trader should master.
👁️ Why This Matters
This is not about predicting next week’s move.
This is about training your eyes to see structure where others see noise.
And if you can see the macro structure, you can outperform 99% of traders who zoom in too much, too soon.
⚡ Bonus Wisdom:
"Amateurs react. Professionals anticipate. Masters build maps."
– TradeWithMky
🔔 Follow me for more deep-dive macro education.
This is where Forex meets vision.
📌 TradeWithMky – where altcoins speak louder than Bitcoin... but Forex whispers the truth.

GBP/AUD For Bullishwait for pull-back near by entry point and then go long
general trend is up trend
have fun :)

Tariffs. Turbulence. OpportunityMarkets Rattle as Global Currencies Slide: Central Banks Prepare to Act
Global financial markets plunged on Monday as U.S. tariffs under the Trump administration, alongside retaliatory measures from key trading partners, officially took effect. The result: a wave of uncertainty and volatility that sent the Australian, Canadian, and New Zealand dollars spiraling to steeply discounted levels.
As this new economic reality unfolds, institutional investors and households alike are scrambling to adjust. In response, central banks across the globe face mounting pressure to stabilize their economies. The most immediate solution? Accelerated interest rate cuts.
Beyond the headline noise of trade wars, the deeper concern lies in domestic economic resilience. Economists and central bankers are increasingly turning inward, looking to bolster aggregate demand through aggressive monetary easing. The U.S. Federal Reserve, nudged persistently by President Trump, has already signaled its willingness to comply. Other central banks are expected to follow suit as nations seek to shield local industries from the impact of trade disruption.
The era of lower global interest rates appears to be more than a passing phase—it is becoming the new norm. In volatile times, disciplined strategies and a long-term lens are more essential than ever. We remain focused on seizing value where others see only risk.

Euraud final forecast!!Good day traders, I’m back with yet another update on EurAud and this time we wanna see price shoots!!

XAUUSDWe will move toward the lower gap. After absorbing liquidity, the movement toward higher highs will begin.

XAUUSD Bullish Signal | Technical + Custom AlgoSmart Trend Signal | Technical Analysis + Custom Algorithm
This signal is the result of a combination of classic technical trend analysis and a proprietary software I personally developed.
