Multiple Time Frame Analysis

GBP/CAD For Bullishwait for break the current resistance and go bullish with retest that area
general trend is up trend
have fun :)

NZD/USD For Bullishyou can go long now
or
wait for pull-back near by entry point and then go long
general trend is up trend
have fun :)

Why I Think Gold May Buy This Week...Technical AnalysisHey Rich Friends,
I think Gold will continue to buy today and potentially for the rest of the week. This is only my technical analysis, so please check the news and cross-reference the indicators on your chart. Here is what I am looking at:
- The market has been pushing up since it hit a swing low at 3285
- Bullish candles are picking up momentum with Bullish engulfing on H1. This is a bullish confirmation for me
- The STOCHASTIC is facing up, the orange line (slow) is below the blue line (fast), both have crossed above 50%.
These are all bullish confirmations for me. I will setting buy stops as marked on my chart. I will set my SL at the previous low and use previous highs as my TPs. Good luck if you decide to take this trade. Let me know how it goes in the comments below.
Peace and Profits,
Cha

Actionable Nasdaq insights: 28-May-2025Rise and shine, traders! Start your day with actionable Nasdaq insights. Let's grow your skills together, one chart at a time.

Gold trading insights: 28-May-2025Gold trading insights for today: Explore our zones for informed decision-making.

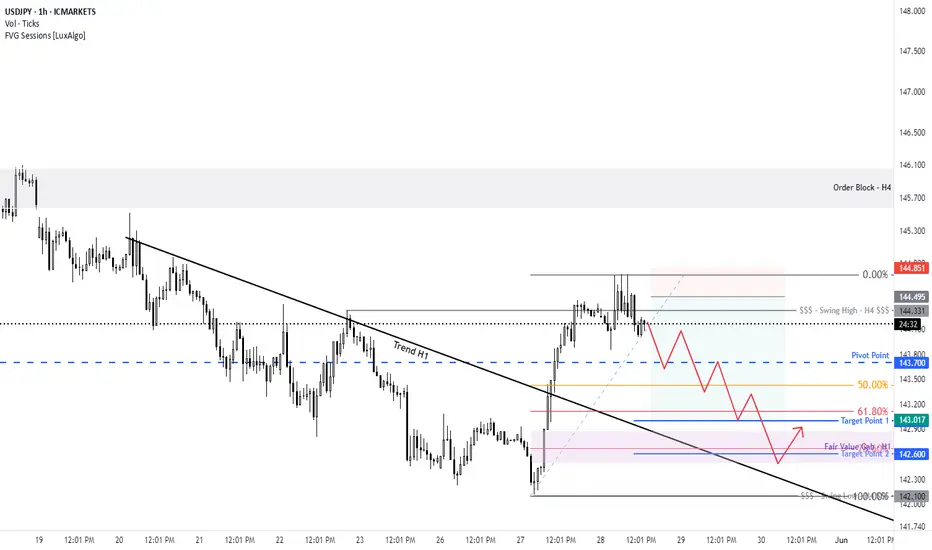
USDJPYGot a reaction off the daily/H4 major support zone. H1 resistance got broken with a retest that was made. Looking for buy signals to next resistance levels. keeping an eye on the FOMC later on.

RBA Could Still Cut Despite Higher AU CPI: AU paid in focusToday I take a quick look at Australia's inflation figures and outline why I think the RBA could still cut in July, before moving on to charts for AUD/USD, AUD/NZD, EUR/AUD and AUD/JPY.
Matt Simpson, Market Analyst at City Index and Forex.com

CADCHF 27/05/2025Weekly:
-Liqudity sweep.
-Unmitigated FVG above.
Daily:
-Bullish M pattern.
-Inverse H&S pattern.
4H:
-Bullish M pattern.
-Inverse H&S pattern.
-IC.

Algorand to $1Pattern Overview
A textbook bull flag formation has materialised and appears to be have confirmed support on past resistance. The pattern shows the classic characteristics of a strong impulse move followed by a controlled consolidation phase.
Key Technical Elements
Flag Formation Structure:
Initial strong bullish impulse creating the "flagpole"
Orderly consolidation within a defined channel (the "flag")
Decreasing volume during consolidation phase
Recent breakout above flag resistance with volume confirmation
Moving Average Support: Price action has found support at both the 50-day (blue line) and 200-day (red line) moving averages.
Recent price action bouncing cleanly off these dynamic support levels
RSI Confirmation: RSI showing healthy momentum without being overbought
The oscillator pattern mirrors the flag consolidation, suggesting controlled profit-taking rather than distribution
Technical Outlook
Bull flags are typically measured by adding the height of the flagpole to the breakout point. . The next impulsive wave forecasts price action to $1
Risk Management
While the technical setup appears strong, proper risk management remains essential. A break back into the flag structure, especially below the moving average support zone, would warrant reassessment of the bullish thesis.
Ww
___________________________________________________________________________________
This analysis is for educational purposes and represents technical observations based on price action and indicators shown on the 2-day timeframe.

Short trade
1Hr TF overview
🟥 Sell-side Trade Log
📉 Pair: BTC/USDT
🏷️ Type: Intraday | LND to NY Session AM
🧠 Setup: Breakout / Continuation
📅 Date: Tuesday, 27th May 2025
🕘 Time: 9:00 AM
🔹 Entry Price: 110654.27
🔹 Profit Target: 107536.61 (+2.82%)
🔹 Stop Loss: 110799.84 (-0.13%)
🔹 Risk-Reward Ratio: 21.42
🔍 Reasoning:
Sell-side trade was triggered during the London to New York session transition. Based on the narrative of market session - liquidity sweep of previous session high.

Short trade
5min TF overview
🟥 Sell-side Trade Log
📉 Pair: SHIB/USDT
🏷️ Type: Intraday | LND to NY Session AM
🧠 Setup: Liquidity Sweep & Time-Based Breakdown
📅 Date: Tuesday, 27th May 2025
🕘 Time: 9:45 AM
🔹 Entry Price: 0.00001457
🔹 Profit Target: 0.00001404 (+3.645%)
🔹 Stop Loss: 0.00001459 (-0.14%)
🔹 Risk-Reward Ratio: 26.5
🔍 Reasoning:
The trade setup leveraged time-based volatility dynamics around the 9:30 AM window, a high-activity period during the London to New York session crossover. A clear liquidity sweep at session highs confirmed sell-side momentum.
Entry 30sec (2.33%) Potential
9.30am to 10.30 am window

GBP/CHF For Bullishwait for pull-back near by entry point and then go long
general trend is up trend
have fun :)

EUR/CHF For Bullish as pull-backwait for pull-back near by entry point and then go long as pull-back
general trend is down trend
current phase is pull-back
have fun :)

EURAUD Swing Trade (Long)After seeing price come into the premium of the daily structure and a strong level of daily support we are now seeing an inverted head and shoulders pattern, which can be seen on the daily and 4h timeframes.
If we see a daily candle break and close above the orange resistance zone (which is also the neckline of the inverted head and shoulders pattern) then i will be looking for price to come back to retest the neckline to target the daily HH (1.8400)
