GOLD | Bullish Mitigation + Inducement Lining Up For Execution(Refined & Structured):
• Pair: XAUUSD (Gold)
• Bias: Bullish
• 4H Overview: Gold broke last week’s previous high, then pulled back and mitigated this week’s order block within the same range. A significant internal high (turnover HH) has now been broken, and price retraced to sweep liquidity and tap into the OB zone.
• 30M Structure: Now watching for a clean pullback into a refined OB after taking out sell-side liquidity/inducement. Structure is aligning perfectly for the next leg up.
• Entry Zone: Once price enters the OB zone, I’ll be watching the 5M for church-level confirmation. Execution follows once LTF speaks clearly.
• Targets: 5M to 30M structural highs depending on delivery.
• Mindset Note: I’m not rushing. Just following structure and reading price. Analysis mode right now—execution comes once price gives the sermon.
Multiple Time Frame Analysis

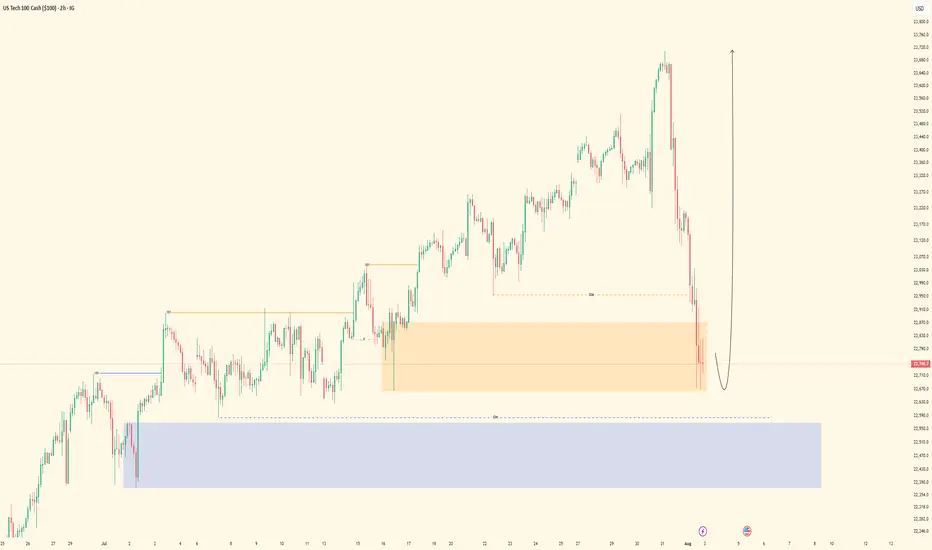
Nasdaq| Bullish Intent Maintained| Refined OB Reaction In Motion(Refined & Structured):
• Pair: Nasdaq (US100)
• Bias: Bullish / Buy
• 4H Overview: Bullish structure remains intact. Despite the congestion and noise, price maintained its upward trajectory. I refined the drop to mid timeframes for precision and clarity.
• 30M Structure: Refined bullish structure with clear intent. Price has mitigated a clean OB, setting the stage for further continuation.
• Entry Zone: Watching lower timeframes for confirmation to ride the wave higher.
• Targets: 5M to 30M structural highs depending on how price delivers.
• Mindset Note: Noise is just noise until structure filters it out. Precision comes from refining—this setup proves that. Stay focused, stay clean, let intent guide you.
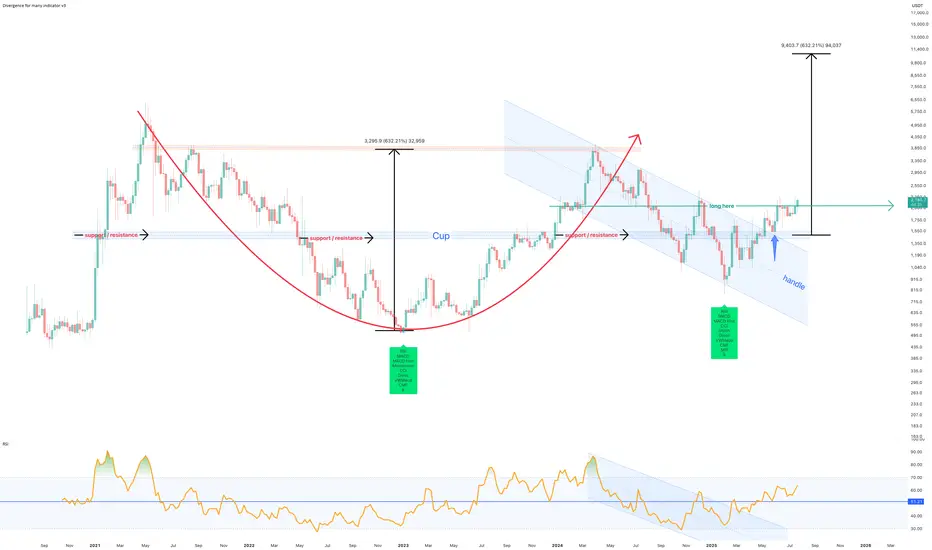
July 2025 - Marker DAO (MKR) to $10k before EthereumThe above forecast is predicted to strike before October 2025. Ethereum will never reach $10k in its lifetime, which a study for another post.
A 75% correction is shown on the above 6 day chart that began in March 2024. A number of compelling reasons now exist for a strong upward move.
Support and resistance
Look left, price action confirms support on past resistance, which follows a strong positive divergence. The resistance has held since May 2022. Incidentally on the topic of divergences, on the same time frame with the same settings, Ethereum prints a double negative divergence over the same period. (see below).
The trend
Both Price action and RSI resistances have broken out. RSI confirms a trend reversal on past resistance.
A Cup and Handle pattern confirmation
The forecast is derived from the Cup and Handle pattern topping out at around $10.5k, however it is not suggested to wait until this area before profits are taken.
Is it possible price action continues to print lower lows? Sure.
Is it probable? No.
Ww
Ethereum 6 day double negative divergencies
GJ| Bullish Outlook | IDM + SSL Sweep - OB Reaction(Refined & Structured):
• Pair: GBPJPY
• Bias: Bullish
• 4H Overview: Price broke major highs with bullish structure still intact. After pulling back into discounted territory, I dropped to mid timeframes to anticipate continuation.
• 30M Structure: Price took out sell-side liquidity and IDM, then mitigated a clean internal order block. Structure is refined and showing signs of smart money activity.
• Entry Zone: Watching LTFs for a clean change of character off fresh demand zones.
• Targets: 5M and 30M structural highs depending on delivery.
• Mindset Note: Patience wins here. When structure and liquidity align this clean, all that’s left is letting LTF confirm it. No need to chase—let the setup speak first.

UJ| Bullsih Bias | Professional Sweep Forming Off 30M OB (Refined & Structured):
• Pair: USDJPY
• Bias: Bullish
• 4H Overview: After breaking previous highs, price pulled back into a sell-side liquidity (SSL) zone. This move shows signs of exhaustion following the sweep, hinting at bullish continuation.
• 30M Structure: Price took out internal liquidity/SSL and is now reacting from a refined 30-minute order block. Looks like a professional sweep is in play, with refined structure holding.
• Entry Zone: Waiting for further confirmation on the lower timeframes once the market opens.
• Targets: 5M and 30M structural highs depending on how price delivers.
• Mindset Note: This setup is a prime example of letting price come to you. Trusting HTF structure and recognizing the sweep fuels the patience needed to strike on LTF intent.

EURUSD. Weekly and Daily AnalysisHi traders and investors!
This analysis is based on the Initiative Analysis concept (IA).
Weekly TF
Price has tapped the 50 % level of the last buyer initiative at 1.14477 and run a manipulation around 1.15569.
Daily TF
We’ve seen a manipulation of the lower boundary of the buyer initiative, and an IKC candle has printed.
Buyer targets on the daily chart: 1.17110, 1.17888, 1.18299.
Before aiming for those, buyers first need to clear the potential sell zones at 1.15994 and 1.16108.
Conservative long setup:
Wait for buyers to defend 1.15994 (or a higher level).
Alternatively, watch the 1-hour support at 1.15165; if buyers hold it, there’s scope for a move toward 1.15994 — and potentially higher after that.
Wishing you profitable trades!

Long trade www.tradingview.com
🟢 Buyside Trade
Pair: LINKUSD
Date: Saturday, 5th July 2025
Time: 8:00 PM
Session: Tokyo Session PM
Time Frame: 4Hr TF Entry
🔢 Trade Metrics
Entry Price: 13.161
Take Profit (TP): 25.814 (+96.14%)
Stop Loss (SL): 12.984 (−1.34%)
Risk-Reward Ratio: 70.32: 1
📈 Chart Analysis
Structure: Price broke the previous consolidation zone and retested key support levels near the 13.16 area before launching upward.
Indicators:
200 WMA (Yellow) & 50 EMA (Blue) both support continuation.
Break of market structure confirmed prior resistance as new support.

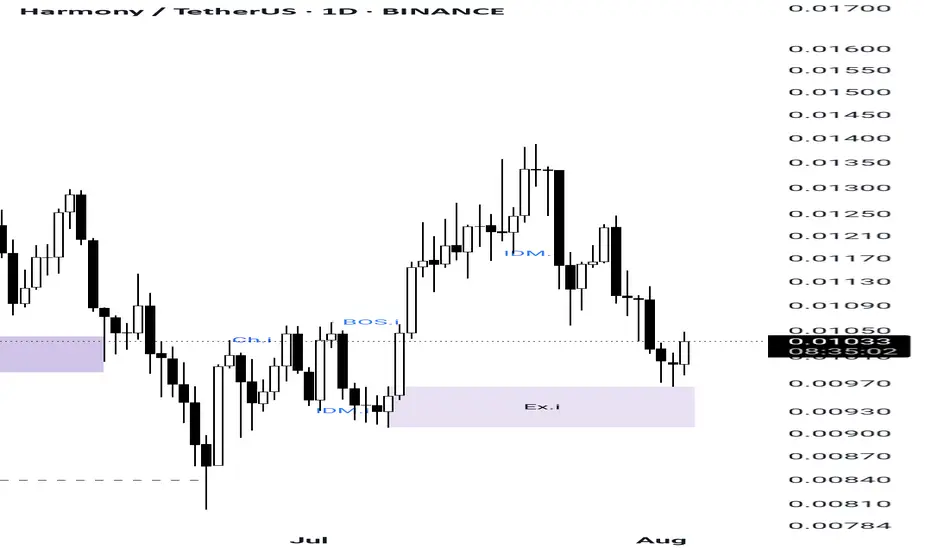
Harmony(ONE) is going to pump...As you can see in ONE Structure it made a minor structure and price touched its minor EX orderblock and for sure it made a SCOB confirmation
So now its ready to pump...
It's my own analysis and it's not investment advise , so DYOR
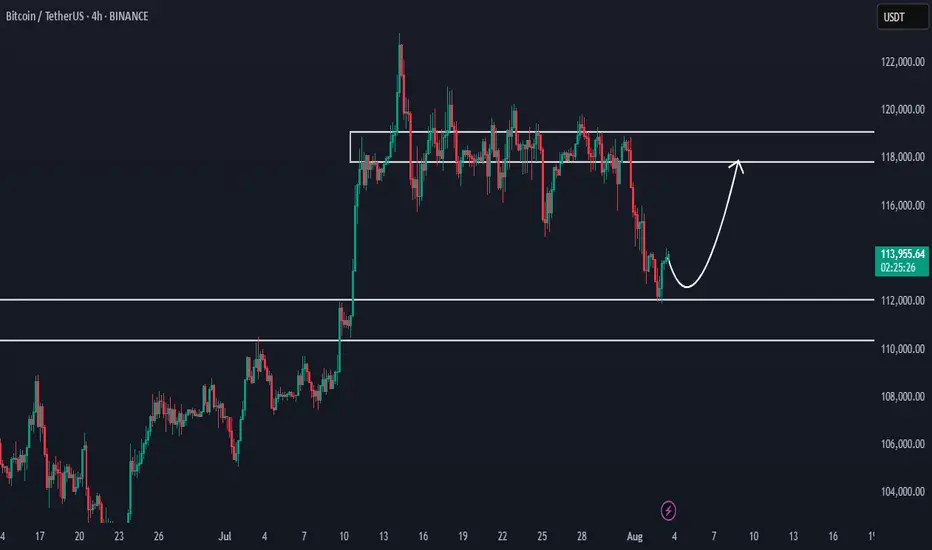
Bitcoin at Key Support - Watching for Bullish ShiftHello everybody!
Bitcoin has reached a very important demand/support zone between 110,000–112,000.
If this area holds, we could see bullish momentum building on the chart.
Currently, we are waiting for confirmations.
We're watching closely for any change in market structure or a trend shift.
If it happens, we can expect the price to move up to around 118,000.
Manage your risk and trade safe!

Bitcoin buy setupHi everyone.
I think this area has a good potential to set an order and take at least 1% profit out of it..
Let's see how it reacts to this level...
Please consider the risk management.
Goodluck
Fiber (EurUsd) Short Idea. Aug 4-8 This Idea wont be precise as my Last Euro Analysis, You can check that out on my Profile.
Now the what do i mean by it not being precise? it means that there is room for upside Movement But it should break that high (Fib high) and the target is Sell-Side Liquidity for this week Key Things in this charts are Liquidity gap, Breaker block IFVG weekly Inverse rejection block.

80% drop into the abyss for Solana? - July 2025** The months ahead **
Examination of the 3-week chart for SOLANA reveals several compelling technical signals that suggest a potential bearish trend reversal. This analysis highlights crucial patterns traders and investors of Solana should consider.
1. Formation of a 3-Week Death Cross:
A notable bearish signal prints on the chart: a ‘3-week death cross’. This follows a ‘2-week death cross’ that preceded a significant downward movement, just as in early 2022. The death cross, where a shorter-term moving average crosses below a longer-term one, is a strong indicator of a shift towards a bearish trend, especially on higher timeframes like this 3-week chart.
2. Broken Market Structure:
The chart clearly indicates a “broken market structure.” This typically occurs when the price fails to create higher highs and higher lows during an uptrend, or in this case, breaks below a significant support level that had previously held. It is absolutely possible price action backtests past support for a resistance confirmation, however on looking left, such a test never occurred on the last death cross.
3. Resistance from Previous Peaks (Head and Shoulders Pattern):
Price action leading up to the recent highs resembles a potential ‘Head and Shoulders’ pattern. The three distinct peaks, with the middle peak being the highest, suggest a classic reversal pattern. A subsequent break below the ‘neckline’ (implied support level below the peaks) would confirm the bearish outlook.
4. RSI Oscillator (bottom of chart) resistance
The lower panel of the chart displays an RSI oscillator indicator, which shows a clear pattern of "resistance." following a period of support since 2023. The RSI has clearly confirmed resistance from almost 3 years of support.
5. Solana vs Bitcoin
All the bearish observations made on the SOL-USD trading pair can be observed on the same 3 week time frame for the SOLANA - BITCOIN trading pair:
6. Potential for Significant Downside Target:
Based on the measured move from the previous death cross and breakdown and Fibonacci extension, the chart illustrates a potential downside target of approximately -70% from current levels toward the $30-40 area. While this is a projected target and not guaranteed, the historical precedent following similar bearish signals provides a context for the potential severity of the downturn if the bearish momentum continues.
Conclusion:
Considering the confluence of a 3-week death cross, broken market structure, resistance from previous peaks (suggesting a potential Head and Shoulders pattern), and the confirmation of RSI resistance, the outlook for SOLANA on the 3-week timeframe appears distinctly bearish.
Is it possible price action continues upwards after a 3200% rally? Sure.
Is it probable? No
Ww

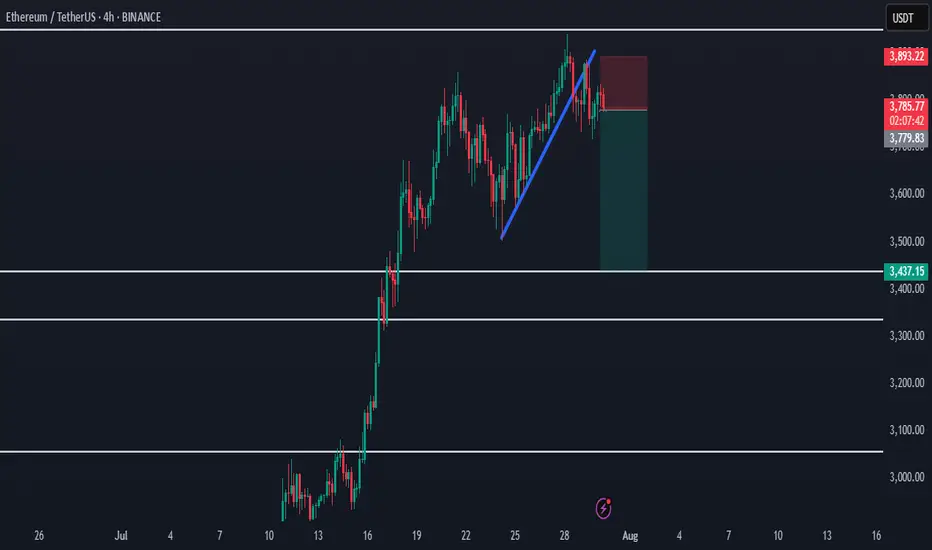
Ethereum Rejected from Supply - Bearish Shift in ProgressHello everybody!
Price has been rejected from a supply area.
The bullish trend has slowed down, and the market structure is slightly shifting bearish.
A polished upward trendline has been broken on the 1H timeframe.
We’re aiming for a target around the first untouched demand zone: 3437.
Manage your risk and trade safe!
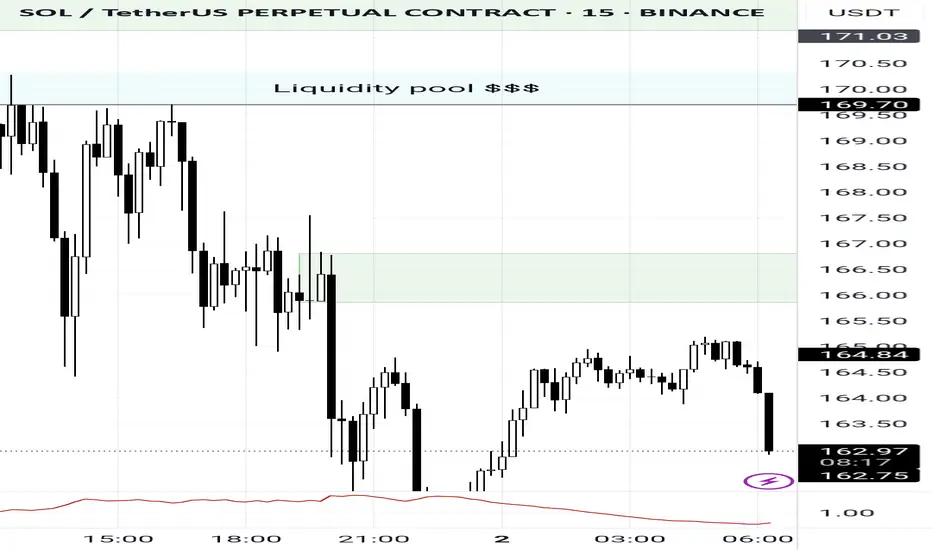
SOL BEARISH CONTINUATIONAs the market continues to create new lows, something caught my eye.
3 areas of unwicked impulsive moves (FVG's) lying around 165.18 - 166.80, 167.65 - 169.69 and 170.32 - 172
With this, I identified two order blocks
.
I'm traditionally wired to prefer the latter because there's more confluence factors;
A liquidity pool 169.70 - 170.3 established by price struggling to close above that level followed immediately by a FVG into an OB.
Price would have an instant reaction downwards if it traded to those levels.
However, the buying pressure might not be sufficient to push price to those levels before the crash.
Hence the other order block.
I'd be paying close attention to observe how it plays out.
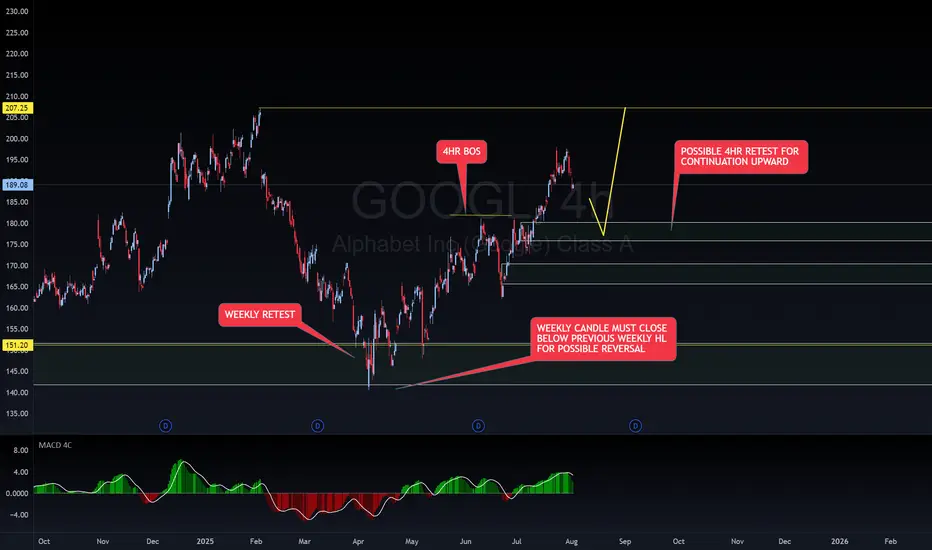
GOOGLE BUY SET UPGOOGLE is on an overall WEEKLY uptrend, coming off of a WEEKLY retest. Within that retest, we have a 4HR BOS. Waiting for 4HR retest in on of my zones for continuation to previous high. A WEEKLY candle would have to BREAK and CLOSE below the previous WEEKLY HL for possible reversal. Happy trading
~~~~I want everyone to succeed
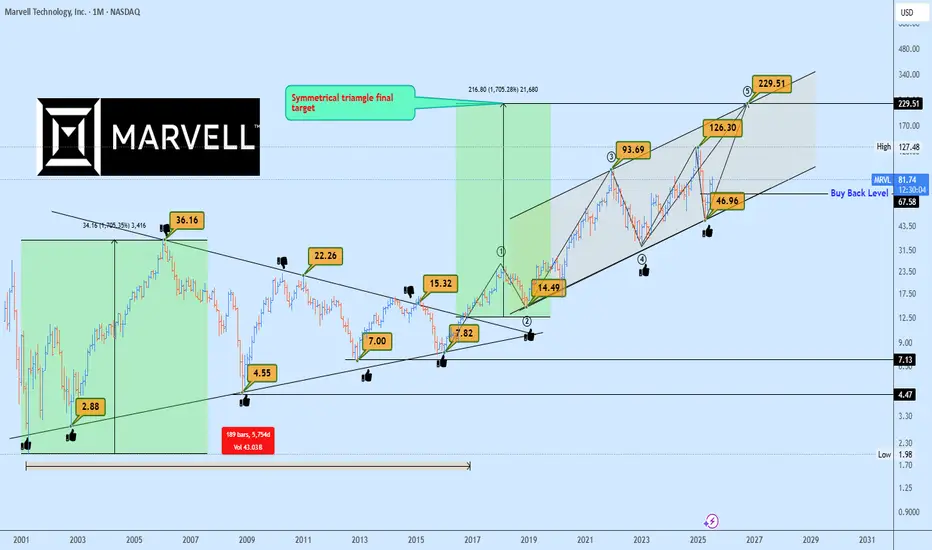
MRVL Massive 15-Years Symmetrical Breakout Targets AheadMarvell Technology (MRVL) has just completed a monumental breakout from a 15-years symmetrical triangle, a rare and powerful long-term accumulation structure. This type of macro consolidation typically precedes a major directional expansion, and in this case, the breakout confirmed bullish continuation.
Currently, MRVL is forming a rising channel structure, with price bouncing cleanly from the lower boundary confirming demand and the continuation phase of the macro move.
The 1:1 projection from the symmetrical triangle gives us a clear target trajectory, with the final leg potentially extending to $229, aligning perfectly with the upper boundary of the rising channel.
In the short to mid-term, the ideal buyback opportunity rests near $67.50, should the market retest previous breakout support or the lower boundary of the channel once more. This zone offers asymmetric risk-to-reward potential for long-term investors and swing traders alike.
Key Targets
📈 $67.50 – Buyback Opportunity Zone
📈 $229 – Rising Channel Top / 1:1 Expansion Target
A breakout this large is no coincidence, it’s backed by years of price compression and institutional positioning. Now is the time to watch closely.
📩 Drop your view in the comments and share your stock requests for quick analysis.
Only stock assets will be accepted under this post.
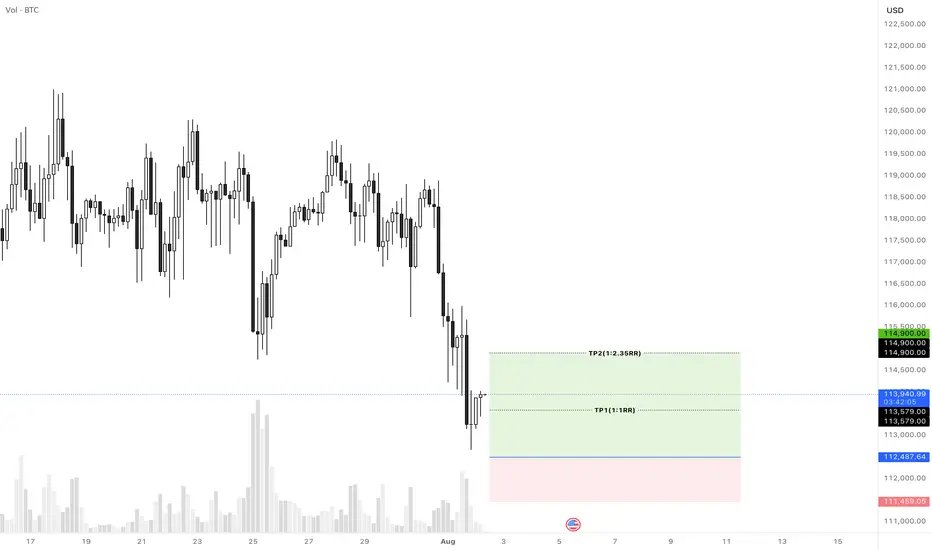
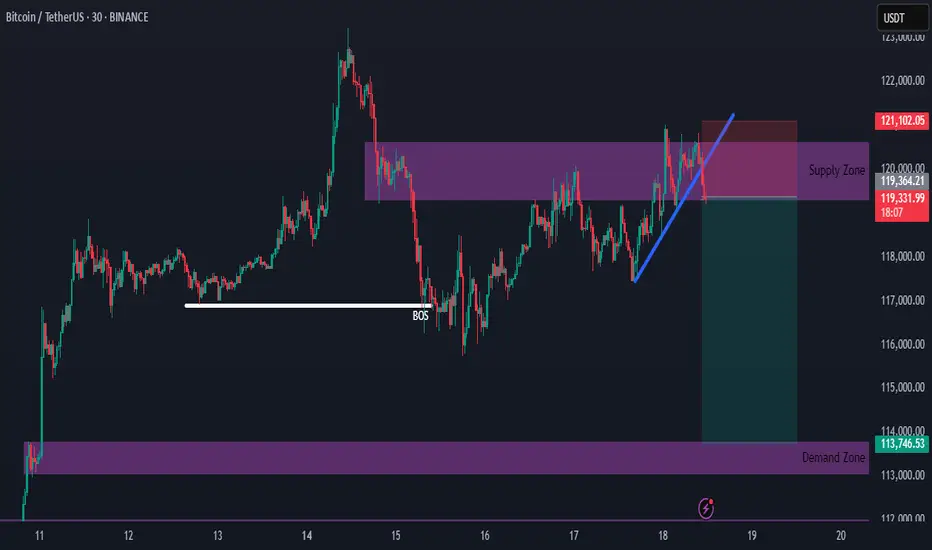
Bitcoin Supply Zone Intact — New Short Setup DevelopingHello everybody!
The supply zone we discussed in the previous idea is still holding.
We have a new opportunity to go short upon the break of the upward trendline.
The most likely target is around 114,000.
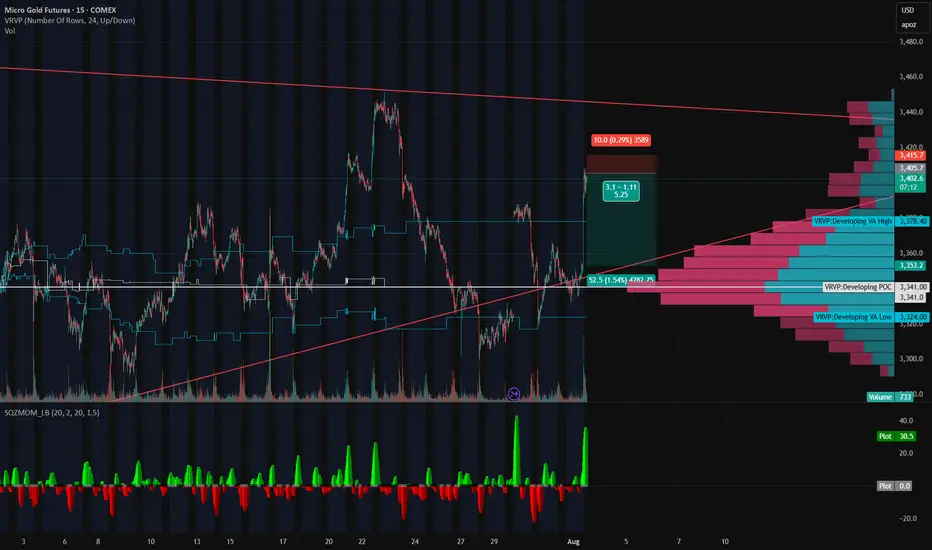
Gold’s on a Roller Coaster — and We’re Riding It Down🎢 Gold’s on a Roller Coaster — and We’re Riding It Down 🎢
Gold just snapped up like it saw Trump tweet “TARIFFS ARE BACK” — but the move smells like a knee-jerk algo pump, not real conviction. We just rejected right into a thin-volume imbalance zone and tagged the underside of a long-standing trendline.
📉 Short Setup Locked In:
💥 Entry: 3405
🛑 Stop: 3415
🎯 Target: 3353
💰 R:R ≈ 5:1
🔍 Why I'm In This Trade:
That rip? Total headline panic, not structural strength.
Low volume shelf above, with a massive POC magnet below at 3353.
We tapped the Developing VAH (3414) and got rejected — classic trap setup.
SQZMOM showing the energy is already fizzling. Green flash, no follow-through.
🧠 The Narrative:
Gold’s trying to price in volatility from every angle — Trump talk, tariffs, macro chaos — but under the hood, this pop looks unsustainable. If this is just a liquidity grab, we could see a flush back into the meat of value fast.
Grab your helmets — this roller coaster might just be heading downhill 🎢📉
Bullish Channel Intact: BTC Poised for Next Leg Toward 152KBitcoin continues to coil within a bullish consolidation zone above the critical $114.5k–$117.5k Immediate Demand Zone, firmly riding the ascending channel structure that has guided price since the March swing low. The prior wave structure confirms a clean ABC correction, followed by a powerful breakout and a structured range indicative of accumulation, not exhaustion.
The RSI shows persistent bullish divergence, confirming hidden strength, with multiple support bounces confirming demand. The current tight consolidation above former resistance now flipped demand presents a launchpad scenario for a breakout towards major projected upside targets.
Targets to Watch:
🟢 $123,053 – Range breakout threshold, aligns with channel midline and prior local high.
🟢 $134,428 – Measured move from current range and top channel boundary intersection.
🟢 $152,174 – Final leg projection based on macro channel trajectory and bullish wave extension potential.
On the downside, failure to hold $114.5k opens the door to a test of the $105k Strong Support Zone, which aligns with prior structural demand and broader trendline confluence.
💬 Drop your favorite altcoins in the comments for quick analysis , let's catch the next movers before they fly!

XAU/USD 01 August 2025 Intraday AnalysisH4 Analysis:
-> Swing: Bullish.
-> Internal: Bullish.
You will note that price has targeted weak internal high on three separate occasions which has now formed a triple top, this is a bearish reversal pattern and proving this zone is a strong supply level. This is in-line with HTF bearish pullback phase.
Remainder of analysis and bias remains the same as analysis dated 23 April 2025.
Price has now printed a bearish CHoCH according to my analysis yesterday.
Price is now trading within an established internal range.
Intraday Expectation:
Price to trade down to either discount of internal 50% EQ, or H4 demand zone before targeting weak internal high priced at 3,500.200.
Note:
The Federal Reserve’s sustained dovish stance, coupled with ongoing geopolitical uncertainties, is likely to prolong heightened volatility in the gold market. Given this elevated risk environment, traders should exercise caution and recalibrate risk management strategies to navigate potential price fluctuations effectively.
Additionally, gold pricing remains sensitive to broader macroeconomic developments, including policy decisions under President Trump. Shifts in geopolitical strategy and economic directives could further amplify uncertainty, contributing to market repricing dynamics.
H4 Chart:
M15 Analysis:
-> Swing: Bullish.
-> Internal: Bullish.
H4 Timeframe - Price has failed to target weak internal high, therefore, it would not be unrealistic if price printed a bearish iBOS.
The remainder of my analysis shall remain the same as analysis dated 13 June 2025, apart from target price.
As per my analysis dated 22 May 2025 whereby I mentioned price can be seen to be reacting at discount of 50% EQ on H4 timeframe, therefore, it is a viable alternative that price could potentially print a bullish iBOS on M15 timeframe despite internal structure being bearish.
Price has printed a bullish iBOS followed by a bearish CHoCH, which indicates, but does not confirm, bearish pullback phase initiation. I will however continue to monitor, with respect to depth of pullback.
Intraday Expectation:
Price to continue bearish, react at either M15 supply zone, or discount of 50% internal EQ before targeting weak internal high priced at 3,451.375.
Note:
Gold remains highly volatile amid the Federal Reserve's continued dovish stance, persistent and escalating geopolitical uncertainties. Traders should implement robust risk management strategies and remain vigilant, as price swings may become more pronounced in this elevated volatility environment.
Additionally, President Trump’s recent tariff announcements are expected to further amplify market turbulence, potentially triggering sharp price fluctuations and whipsaws.
M15 Chart:

AUD/JPY bulls eye 99, 100The yen is broadly weaker, which is even allowing a weaker Australian dollar to rise. And with a decent bullish trend on the daily chart, I am now seeking dips within a recent consolidation range in anticipation of a move to 99 or even 100.
Matt Simpson, Market Analyst at City Index and Forex.com

Stock Of The Day / 07.31.25 / ALGN07.31.2025 / NASDAQ:ALGN
Fundamentals. Suspected of possible violations of federal securities laws on the back of a negative earnings report.
Technical Analysis.
Daily Chart: Downtrend. Level 127.88 formed by the trend break in March 2020 is ahead.
Premarket: Gap down on increased volume. We mark the trend break level in the premarket at 140.0.
Trading Session: The price held the 140.0 level twice during the first hour after the opening of the trading session. Note the clear hold in the first case and the hold with false breakouts in the second. Also note that each subsequent pullback was smaller than the previous one. We are considering a short trade to continue the downward movement in case of the breakdown and hold of the 140.0 level.
Trading scenario: breakdown with retest (tightening with retest) of level 140.0
Entry: 139.67 after breakdown and hold the price below the level.
Stop: 140.11 we hide it above the tail of the retest candle.
Exit: We observe the strong downtrend. Cover the part of the position at 132.08 when the structure of the downtrend is broken (RR 1/17), after the downtrend resumes, hold the rest of the position until level 127.88 (1/25).
Risk Rewards: 1/21 (max. 1/25)
P.S. In order to understand the idea of the Stock Of The Day analysis, please read the following information .
