GBPAUD SHORT Market structure bearish on HTFs DH
Entry at both Weekly and Daily AOi
Weekly Rejection at AOi
Daily Rejection at AOi
Previous Structure point Daily
Around Psychological Level 2.05500
H4 EMA retest
H4 Candlestick rejection
Rejection from Previous structure
Levels 3.78
Entry 100%
REMEMBER : Trading is a Game Of Probability
: Manage Your Risk
: Be Patient
: Every Moment Is Unique
: Rinse, Wash, Repeat!
: Christ is King.
Multiple Time Frame Analysis

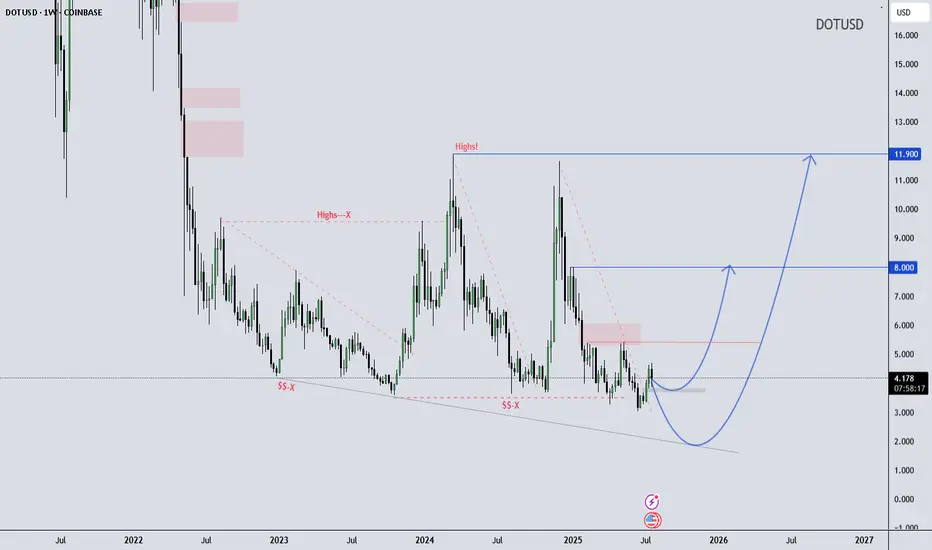
DOT/USD Weekly Structure - - Reversal Possibility Developing DOT/USD Weekly Outlook – Educational Perspective
Polkadot (DOT) is trading near the lower boundary of a long-term falling wedge structure, showing early signs of stabilization around the $4.20 support zone. Price has respected this level multiple times, potentially forming a rounded bottom, which often suggests shifting momentum.
If the structure holds, it may continue developing a macro reversal pattern. This kind of formation is typically monitored by swing traders looking for high risk-reward setups in longer timeframes.
Key Technical Levels to Watch:
$8.00 – Mid-range structural resistance
$11.90 – Historical supply / macro pivot zone
This chart is shared for educational purposes only to support market structure learning. Always follow your own analysis and risk management plan.
Wave Trader Pro
Learn & Earn
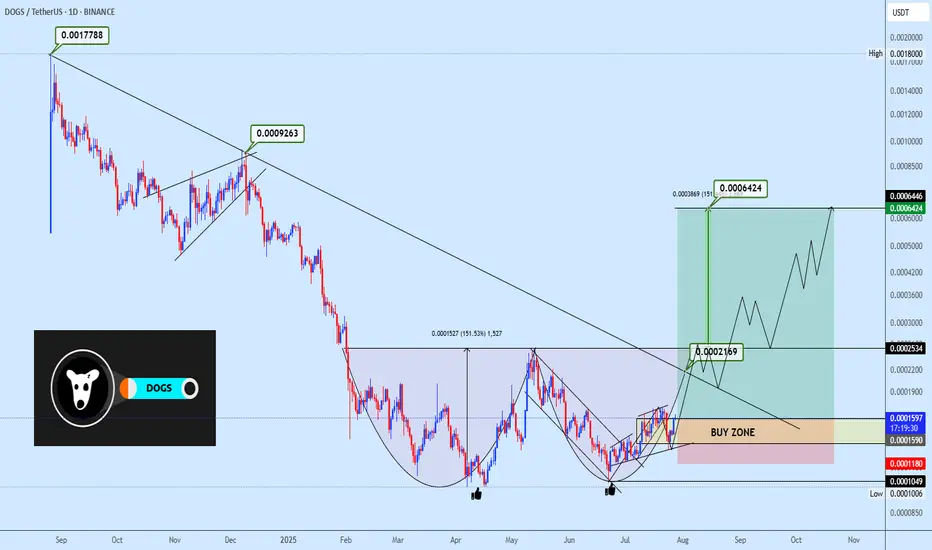
Dogsusdt double bottom formationDOGSUSDT is exhibiting a micro double bottom formation, with price rebounding from a previous support zone. The strategy is to accumulate within the highlighted area and monitor the neckline reaction around 0.0002534. A breakout above this level would validate the entire double bottom structure and set the stage for a move toward the projected targets. Enjoy.

NAS100 Gaps Up on Trump Trade Deal – Bullish Continuation The market opened with a bullish gap after Trump announced new trade deals, sparking investor optimism. Price cleanly broke above the 23,266.5 🔼 resistance level, confirming it as a fresh support zone.
Buyers are now in full control, and price is forming a strong bullish structure with higher highs and higher lows.
Support at: 23,266.5 🔽, 23,200 🔽, 23,025 🔽
Bias:
🔼 Bullish: As long as price holds above 23,266.5, the path is clear for a move toward 23,400 and possibly 23,540+. Watch for minor pullbacks into support for continuation setups.
🔽 Bearish: A break back below 23,266.5 would be the first warning of bullish exhaustion, with downside potential toward 23,200.
📰 News Insight: The bullish gap came after Donald Trump announced new trade deals, boosting risk sentiment across U.S. indices. This has become a key short-term fundamental catalyst.
📛 Disclaimer: This is not financial advice. Trade at your own risk.

NASDAQ| Bullish Bias - Refined OB Near MitigationPair: NASDAQ (NAS100)
Bias: Bullish
HTF Overview (4H):
Strong bullish structure has been the narrative, and last week’s upside intent confirmed the move. Current action suggests price is preparing for continuation after brief consolidation.
LTF Confirmation (30M):
Structure has been refined with a key OB in play. Price is approaching mitigation, and I’ve been tracking this level closely since last week.
Entry Zone: Waiting for clear 5M shift after OB mitigation. 5M OB already tapped — now I’m watching for confirmation to execute.
Targets: 5M highs first, 30M highs if price maintains momentum
Mindset Note: Focused and flowing. No forcing — I’ve tracked this from HTF to LTF and now I’m just waiting for price to invite me in. Clarity + patience = execution.

GBPUSD | Bullish Bias - Midframe Alignment After SSL SweepPair: GBPUSD
Bias: Bullish
HTF Overview (4H):
Price structure is clearly bullish with strong intent. Looking to ride momentum as price continues toward 30M and 4H highs.
LTF Confirmation (30M):
Structure has been refined. Price swept sell-side liquidity and cleanly mitigated a key 30M OB — now I’m monitoring for LTF alignment to catch the continuation.
Entry Zone: Waiting for 5M CHoCH to flip bullish. Entry comes on the pullback into demand once the shift confirms.
Targets: 5M highs, 30M highs — trailing based on delivery and momentum
Mindset Note: No emotion, no forcing. Waiting for alignment from Smart Money and letting price invite me in. Clarity leads, execution follows.

EURUSD| Bullish Bias - Refined OB Play into ContinuationPair: EURUSD
Bias: Bullish
HTF Overview (4H):
Bullish structure remains intact — recent break to the upside was followed by a healthy pullback. Now price is continuing the push toward external 4H highs.
LTF Confirmation (30M):
Structure refined from last week. Price recently mitigated a 30M demand OB and is now showing signs of continuation. Watching for clean 5M shift to confirm the next leg.
Entry Zone: 5M CHoCH flip followed by pullback into demand zone
Targets: 30M highs, then extended target at 4H highs
Mindset Note: Keeping it clean and reactive. No guessing — I’m tracking Smart Money flow, structure shift, and waiting on my cue.

GBPJPY| Bullish Bias - Range Play Before The SweepPair: GBPJPY
Bias: Bullish
HTF Overview (4H):
Structure remains bullish, but price is currently sitting inside a tight top-of-range formation. No clear breakout yet — still waiting on a deeper sell-side liquidity sweep to fuel the next leg. Until then, the focus is on how price dances within mid-range liquidity.
LTF Confirmation (30M):
Still watching for a clean sweep of previous internal lows from last week. 30M OB is refined and marked — once it’s mitigated, I’ll wait for LTF confirmation.
Entry Zone: Will monitor for 5M shift and intent after OB mitigation.
Targets: Initial target = 5M highs; extended = 30M highs depending on price delivery.
Mindset Note: Sitting on hands until Smart Money shows its hand. No rushing range plays. Patience = precision.

XAUUSD | Bullish - Deep Liquidity Grab + OB MitigationPair: XAUUSD
Bias: Bullish
HTF Overview (4H):
Structure remains bullish, with continuation expected toward prior 4H highs. Last week’s strong bullish intent signaled Smart Money’s directional commitment. Price reached deeper to seek liquidity beneath major sell-side lows, setting the stage.
LTF Confirmation (30M):
Price cleanly mitigated a 30M order block resting just under the swept liquidity. This reinforces the bias, and I’ll now be watching for LTF confirmations once the market opens.
Entry Zone: Within or just above the 30M OB
Targets: 5M and 30M internal highs. Trailing targets will depend on how price delivers.
Mindset Note: Patience is key here. I’m waiting for clean confirmation before executing — no rush. The story is written. I just need the trigger.

USDCHFHello Trader
I expect the price to start falling from these areas 🩸
The stop of this scenario is also visible in the image above❌
I hope you make the most of it...

XAUUSDHello Trader ❤
I expect the price to start growing from these two areas🚀
The stop of this scenario is also visible in the image above❌
I hope you make the most of it...

The move is up to the buyersHi traders and investors!
The price has already played out the upper boundary of the scenario, rising above 120,500. Then it also reached the lower boundary by dropping below 115,222.
Now we are at an interest moment: will the price continue to move upward or not?
This situation is clearly visible on the 8-hour timeframe.
On the 8H chart, we see a sideways range, similar to the 1D timeframe. The lower boundary is 115,736 and the upper boundary is 123,218. The active initiative is currently with the buyers, and their target is 120,998 и 123,218.
There is a notable bar attacking the lower boundary (115,736) with very high volume. The high of that bar is 118,451. We’re watching to see whether buyers absorb this bar — that will determine how the next move plays out.
There are three key levels where buyers may step in: 116,782, 116,128, and 115,736. If the price drops to any of these, we can look for a long setup.
Above, we also have three resistance levels from the sellers: 118,451, 119,676, and 120,247. We’ll be watching how sellers react if the price tests these zones.
This analysis is based on the Initiative Analysis concept (IA).
Wishing you profitable trades!

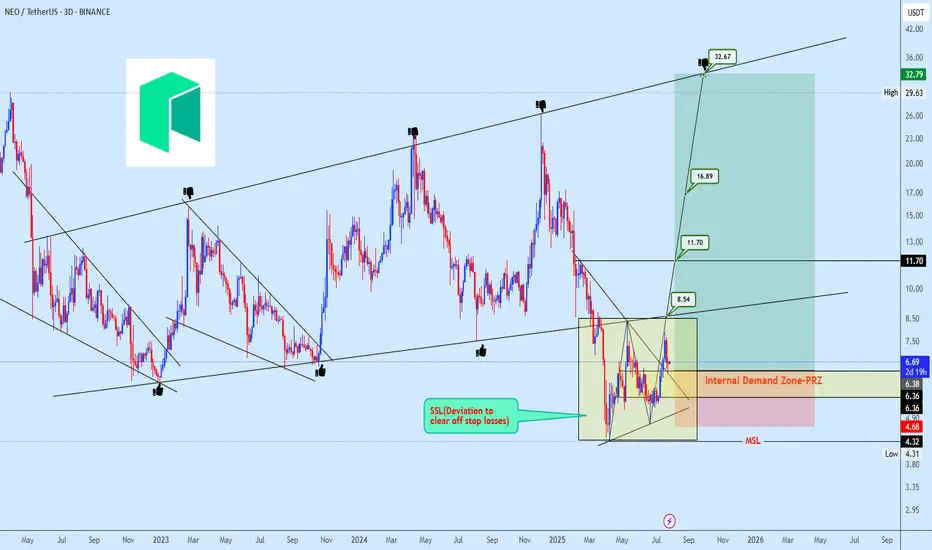
NEOUSDT Accumulation in Progress After Strategic Stop-Loss SweepNEOUSDT broke below its micro ascending broadening structure in what appears to be a strategic deviation to trigger stop-loss liquidity. Following this flush, price action has settled into a brief consolidation phase, often indicative of underlying bearish weakness losing momentum.
Our focus shifts to the internal demand zone, which is currently acting as a strong platform for accumulation. With price reclaiming the prior range low and reacting positively from the projected reversal zone (PRZ), we are positioning for a potential multi-leg bullish expansion.
Targets are projected at 8.54 → 11.70 → 16.89, with a final extension towards 32.67, aligning with the macro channel resistance.
Risk is clearly defined below 4.68, which serves as invalidation of this bullish view.
ETHUSDBroke above H4 resistance and retested multiple times. Also broke above minor H1 resistance with a retest. Looking at 4,000 as main target

EURUSD BUYSEU is bullish. It has been consistently making HHs & HLs. I’d look for price to push towards the daily resistance @ 1.83000 then I’d look for price to push towards 1.19000.

XAUUSD Gold closed bearish and I’ll continue looking for sells. I’d prefer gold to retrace and create a LH and continue selling towards 3310. Last time price was around 3310, it had a massive bullish run so that’ll be the only area I’d sell to unless price breaks that support.

Vicusdt buy opportunityVICUSDT broke out of a falling wedge but encountered strong resistance at the supply zone, leading to a pullback for a potential retest of the wedge structure. The plan is to re-accumulate within the highlighted zone and monitor price action as it progresses toward the outlined targets on the chart.

Copper Eyeing Key Reversal Point – Will It Break Above 4.68152 ?Copper is currently hovering near the 4.68152 🔼 resistance after rebounding from the 4.50280 🔽 support. Price is reacting to the 50-period SMA, which is slightly above current levels and may act as a dynamic resistance. The overall structure remains mixed with recent lower highs, but bulls have stepped in at key support.
Support at: 4.50280 🔽, 4.27241 🔽, 4.04129 🔽
Resistance at: 4.68152 🔼, 4.83230 🔼, 4.95323 🔼
Bias:
🔼 Bullish: A breakout and retest above 4.68152, and ideally a clean move above the 50 SMA, could signal bullish continuation toward 4.83230 and 4.95323.
🔽 Bearish: A strong rejection at 4.68152 or a drop below 4.50280 could send price back toward 4.27241.
📛 Disclaimer: This is not financial advice. Trade at your own risk.

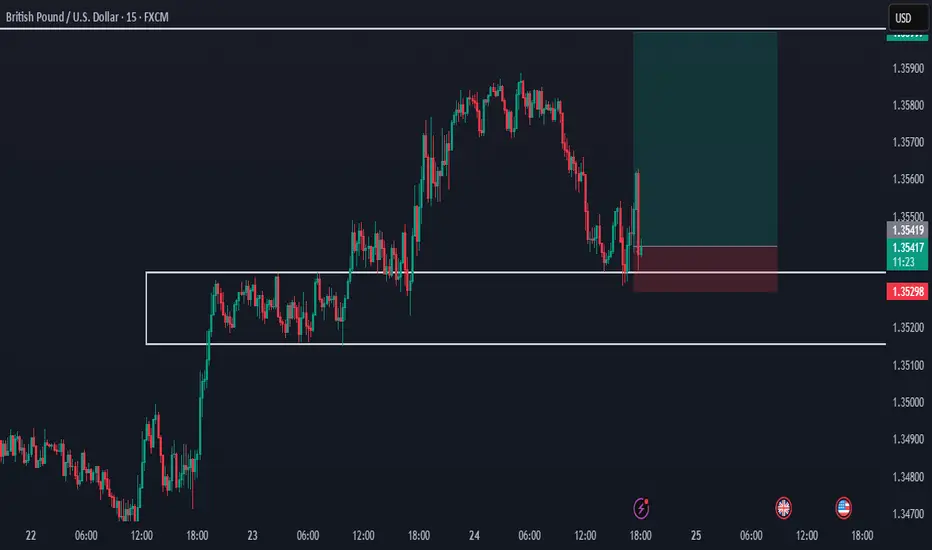
GBP/USD Retraces to Demand — Buy Setup FormingHello traders!
Price has been in a strong bullish trend throughout the week.
After forming a demand zone around 1.35300 and retracing back to it, we are looking to take a buy position in this area.
Manage your risk and trade safe!
Fiber (EU) This is my Analysis for the Eurousd, Fiber has been in down trend for years now and comparing the US Central bank interest rates with the European Central bank it shows that the Dollar is Stronger compared to the Euro, Blending the Fundamentals with Technical Analysis.

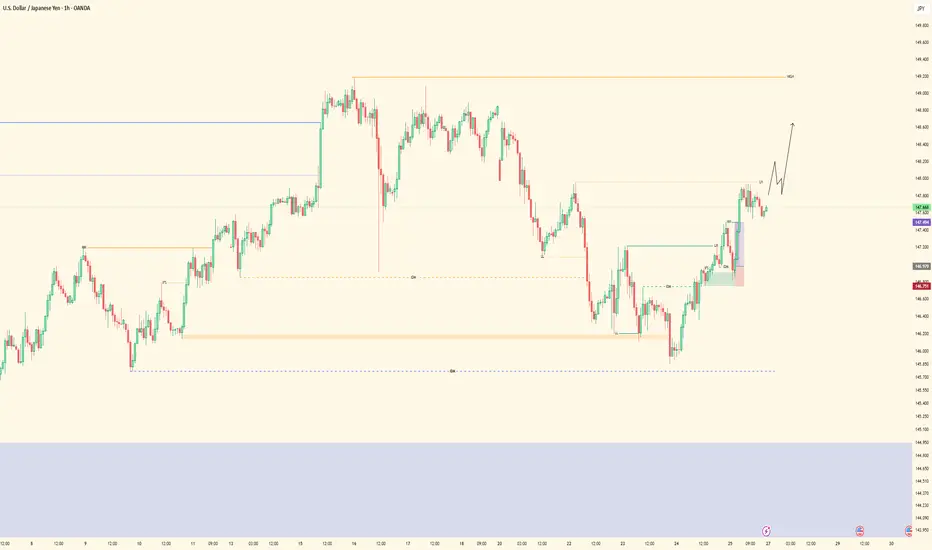
UJ| Bullish Structure Ride | 5M Demand ExecutionPair: USDJPY
Bias: Bullish
HTF Overview: 4H structure stayed bullish with clean intent. Internal liquidity resting above prior highs, and price is still pushing through the 30M range toward those 4H targets.
LTF Confirmation: 30M showed a clean continuation range with a lower high (LH) inside structure — price never broke character. I tracked it into 5M where the OB was sitting patiently.
Entry Zone: Tapped into the 5M OB with a short-term sweep right before — no need for extra confirmation. The move had structure, inducement, and momentum on its side.
Target: TP hit at the 5M highs, but overall I’m watching for the 30M LH to go first, then ultimately expecting price to run the 4H internal highs this upcoming week.
Mindset Note: When the story is clear on the HTF, all you need is one clean LTF entry to ride with conviction. I’m letting the higher timeframe breathe and staying ready.
Xvgusdt buy opportunityXVGUSDT is showing a strong move within a rising channel following a well-defined rounding bottom reversal. The focus is on the neckline of the rounding bottom, where wave 5 of the channel is expected to complete before a possible correction. This correction could evolve into either a cup and handle or an inverse head and shoulders (iH&S) pattern, time will reveal the structure. Watch the highlighted demand zone for potential accumulation opportunities.
