Mtl is above breakout level of 624Mtl is above breakout level of 624, and it is expected to cross 650 and 700 level.
Note: this is not a buy sell trade call. Trade at your own will and use stop loss.
MTL

MTL Rebuy Setup – Perfect Entry Ahead! (3D)MTL (Metal DAO) is currently developing within Wave C of a classic diametric pattern, based on Elliott Wave theory. This structure suggests a high-probability corrective phase that typically leads to sudden and sharp movements before a potential reversal.
As of now, MTL has not yet reached the identified green buy zone, but price action is approaching it. This zone has been highlighted by analysts as a major area of interest for a potential rebuy scenario once touched, based on market structure and historical behavior.
Importantly, the setup includes a clearly defined invalidation level. If the price closes a daily candle below this invalidation level, the current wave count would no longer be valid, and traders should reassess the market outlook.
Until this invalidation occurs, the current count remains intact, and market participants may monitor the ongoing price action for potential bullish continuation after Wave C completes.
For risk management, please don't forget stop loss and capital management
Comment if you have any questions
Thank You

MTLUSDT 1WMTL ~ 1W Analysis
#MTL Buy gradually from here with a short -term target of at least 20%+.

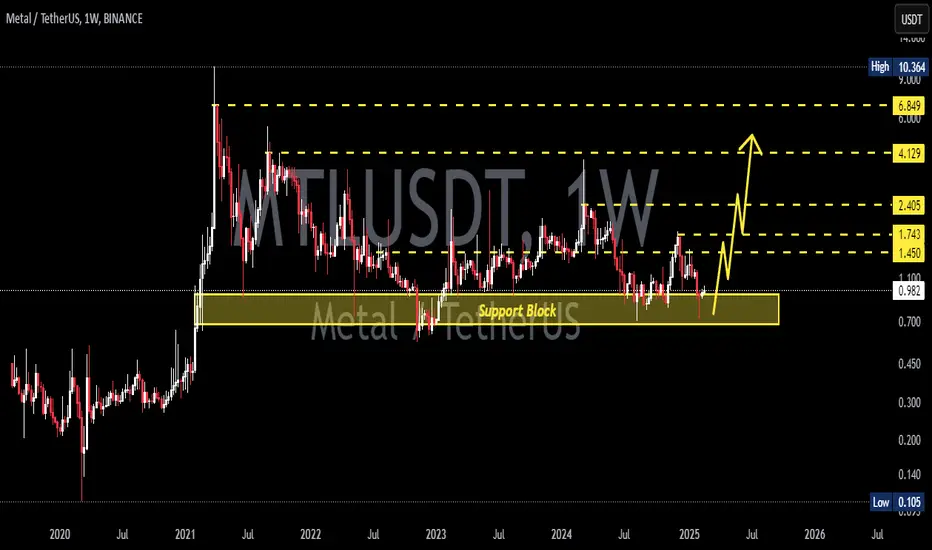
MTLUSDT 1WMTL ~ 1W Analysis
#MTL So far it continues to maintain this support block. Buy gradually from here if you still have a Conviction on this Coin.
MTLUSDT | AN OPPORTUNITY MIGHT OCCUR BUT BE CAREFUL!MTLUSDT looks strong, although there is a possibility of clearing the monthly liquidity line below.
In the S/R Flip area shown in the chart,
You can enter when the resistance in the support area, which is currently working as resistance, is broken with volume and turns into support.
Low Timeframe Entries: Looking for confirmation on smaller timeframes after liquidity clearance.
S/R Flip Confirmation: Waiting for the current resistance to break with volume and turn into support before entering.
A couple of things to watch for:
If liquidity is taken out below and price reclaims a key level, it could indicate strong bullish momentum.
Volume confirmation is key, fakeouts are common if the breakout lacks strong participation.
Monitoring order flow and wicks can help identify potential reversals.
Let me tell you, this is something special. These insights, these setups—they’re not just good; they’re game-changers. I've spent years refining my approach, and the results speak for themselves. People are always asking, "How do you spot these opportunities?" It’s simple: experience, clarity, and a focus on high-probability moves.
Want to know how I use heatmaps, cumulative volume delta, and volume footprint techniques to find demand zones with precision? I’m happy to share—just send me a message. No cost, no catch. I believe in helping people make smarter decisions.
Here are some of my recent analyses. Each one highlights key opportunities:
🚀 RENDERUSDT: Strategic Support Zones at the Blue Boxes +%45 Reaction
🎯 PUNDIXUSDT: Huge Opportunity | 250% Volume Spike - %60 Reaction Sniper Entry
🌐 CryptoMarkets TOTAL2: Support Zone
🚀 GMTUSDT: %35 FAST REJECTION FROM THE RED BOX
🎯 DEXEUSDT %180 Reaction with %9 Stop
🐶 DOGEUSDT.P: Next Move
💎 ETHUSDT.P: Where to Retrace
🟢 BNBUSDT.P: Potential Surge
📊 BTC Dominance: Reaction Zone
🌊 WAVESUSDT.P: Demand Zone Potential
🟣 UNIUSDT.P: Long-Term Trade
🔵 XRPUSDT.P: Entry Zones
🔗 LINKUSDT.P: Follow The River
📈 BTCUSDT.P: Two Key Demand Zones
🟩 POLUSDT: Bullish Momentum
🌟 PENDLEUSDT.P: Where Opportunity Meets Precision
🔥 BTCUSDT.P: Liquidation of Highly Leveraged Longs
🌊 SOLUSDT.P: SOL's Dip - Your Opportunity
🐸 1000PEPEUSDT.P: Prime Bounce Zone Unlocked
🚀 ETHUSDT.P: Set to Explode - Don't Miss This Game Changer
🤖 IQUSDT: Smart Plan
⚡️ PONDUSDT: A Trade Not Taken Is Better Than a Losing One
💼 STMXUSDT: 2 Buying Areas
🐢 TURBOUSDT: Buy Zones and Buyer Presence
🌍 ICPUSDT.P: Massive Upside Potential | Check the Trade Update For Seeing Results
🟠 IDEXUSDT: Spot Buy Area | %26 Profit if You Trade with MSB
📌 USUALUSDT: Buyers Are Active + %70 Profit in Total
🌟 FORTHUSDT: Sniper Entry +%26 Reaction
🐳 QKCUSDT: Sniper Entry +%57 Reaction
📊 BTC.D: Retest of Key Area Highly Likely
This list? It’s just a small piece of what I’ve been working on. There’s so much more. Go check my profile, see the results for yourself. My goal is simple: provide value and help you win. If you’ve got questions, I’ve got answers. Let’s get to work!

XAUUSD Sell Opportunity Incoming!Hello Chat DegenJake here, i hope you find yourselves well from health & mind. Let's get right into it shall we?
VISUAL GUIDE:}
Blue lines: Represent Active Weekly liquidity.
Yellow lines: Represents Active Daily liquidity.
White lines: Represents Active 4HR liquidity.
Orange line: 0.5 Fibb Level on the Weekly Time frame from the swing low to swing high.
As we can notice chat we have a very interesting chart formed on Gold. What do we see? We see gold wanting to perhaps take out liquidity level {Price level 2690: White horizontal 4 hr liquidity line} and then shove towards the bottom side to take various liquidity prices below.
the major point of reversal whenever it decides to crash either soon or after march 14 our first lunar cycle. Well be updating you chat.
I personally entered an extremely low risk position as i would like to acquire heavier positions once it takes liquidity to the upside first. i still see this market being a little early for the sell off but incase it happens quick without warning is why i have decided to start my first small position. the master plan would be to start DCA positions towards a SELL at price levels
2690
2720
2790
This is a super clean set up chat don't fade it!

BTC.D Bitcoin Dominance Setting Up For A Sell Off!What's up cat DegenJake here, Welcome all to a new trading week were going to start zeroing in on crypto as things are really starting to heat up in the crypto scene. With much anticipation we wait for a bullish Run, but for now we definitely see bears in control of BTC.
Here on BTC.D we definitely see it wanting to go upwards and take out some white horizontal lines of 4hr liquidity zones. & in another case scenario even be able to take liquidity
on the daily Yellow horizontal line.
Theres no denying that this chart has so much more liquidity to grab to the downside than it does to the upside anymore, But the market markers seem to be loving to shake out the retail investors and newcomers to crypto that aren't adapted to such rad volatility.
Personally i see these opportunities as further buy entries for ALT's and BTC.
Based off this chart we can see ALT's correcting about 16% in the incoming days then pumping to VALLHALLA.

EUR/USD Looking like Bearish chop, Into Bullish Liquidity Grab'sHello Chat DegenJake_ Here once again. We have a strong sensation of EUR/USD playing out like we have drawn. We would like to see price come down ever lower and take out the buyside liquidity of the 4HR Time Frame. After doing this we would like to see it chop side ways maybe m,ake one last lower high with a wick off the orange Horizontal Line (Which is pinned to the Fibbonacci retracement tool, and the last point of support to the left side of the chart.
{VISUAL GUIDE:}
Black Lines: Represent Active Monthly liquidity.
Blue lines: Represent Active Weekly liquidity.
Yellow lines: Represents Active Daily liquidity.
White lines: Represents Active 4HR liquidity.
Green Triangles: Gaps in the market that price will fill eventually.

MTLUSDT 1WMTL ~ 1W
#MTL If you still have Conviction on this coin,. Buy gradually within this support block,. with a target of 20%+
#MTL/USDT Ready to go higher#MTL
The price is moving in a descending channel on the 1-hour frame and sticking to it well
We have a bounce from the lower limit of the descending channel, this support is at 1.10
We have a downtrend on the RSI indicator that is about to be broken, which supports the rise
We have a trend to stabilize above the moving average 100
Entry price 1.15
First target 1.19
Second target 1.22
Third target 1.27

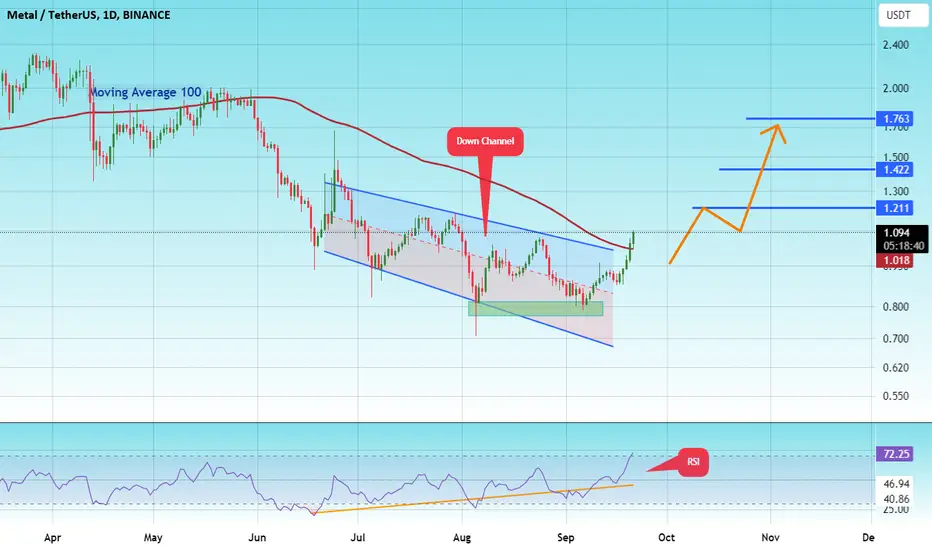
#MTL/USDT#MTL
The price has broken the descending channel on the 1-day frame upwards and is expected to continue.
We have a trend to stabilize above the 100 moving average again.
We have an upward trend on the RSI indicator that supports the rise by breaking it upwards.
We have a support area at the lower limit of the channel at a price of 0.0780.
Entry price 1.00.
First target 1.21.
Second target 1.42.
Third target 1.76.
METAL (MTL)data according to www.crunchbase.com, data measured monthly.
metal is most active in China.

MTL looks bearishMTL seems to be completing an ABC.
We now seem to be at the end of the b/x wave from B.
The best range for sell/short positions is the red range.
The targets are clear on the chart.
Closing a daily candle above the invalidation level will violate the analysis
For risk management, please don't forget stop loss and capital management
When we reach the first target, save some profit and then change the stop to entry
Comment if you have any questions
Thank You

We have a descending trendline that MTL is attempting to breakThe trend of Metal is completely bearish, and it is moving straight downwards. We have a descending trendline that MTL is attempting to break, with buyers applying pressure.
The scenario involves breaking this trendline, if it breaks and retests, we could see an upward movement.

Strong buying interest for MTLMTL is holding the support area at $1.33, indicating strong buying interest at this level. The price is attempting to bounce from this support, suggesting that buyers are stepping in to defend this area and potentially drive the price higher. This bounce attempt is crucial as it could signal the start of a new upward movement.
The key resistance area to watch is $1.54. This level acts as a barrier where selling pressure might emerge, potentially hindering further upward movement.

MTL TRENDING NEW LONGHi Traders,
I hope you all are doing well and navigating the crypto market with your best strategies.
This update is for MTLUSDT.
MTL is looking interesting over the next time frames and may show increased volume. That's why we're keeping an eye on this coin.
$2.00 is a key confirmation zone. If the coin breaks this level, there's a high chance it could reach $2.68
Remember, there are no guarantees in the market. Always follow a consistent system based on your own strategies and analysis.
Good times, everyone.
This update is not trading or financial advice.

#MTL/USDT#MTL
We have a bearish channel pattern on a 4-hour frame, the price moves within it, adheres to its limits well, and is expected to break it upwards in a strong manner.
We have a support area at the lower border of the channel at 1.50
We have a tendency to stabilize above moving average 100
We have a downtrend on the RSI indicator that supports the price higher
Entry price is 1.60
The first goal is 1.83
The second goal is 1.94
the third goal is 2.07

MTLUSDT.4HThe 4-hour MTL/USDT chart provides a view of the market's movements along with RSI and MACD indicators to gauge momentum and trend strength.
The RSI is at 54.21, which indicates a slight bullish bias as it is above the neutral 50 mark but not yet into overbought territory (above 70). This level of RSI suggests a moderate amount of buying momentum.
The MACD is just above the signal line, also indicating mild bullish momentum. However, it’s close to the zero line, so the upward momentum isn’t particularly strong at this point.
Price action is currently between the first level of support (S1) at $1.731 and the first level of resistance (R1) at $2.323. The presence of the second resistance (R2) at $2.452 indicates that this is a significant area to watch if R1 is breached. Similarly, if the price were to break below S1, the next significant support lies at S2 at $1.529.
For a trading strategy based on this chart, I would monitor for a potential breakout above R1 with increased volume, which could signal a move towards R2. A fall below S1, especially with significant volume, could indicate a potential short opportunity or an exit signal for existing long positions.
The importance of risk management can't be overstated; setting stop-loss orders around S1 could mitigate downside risk in the event of a price reversal. The strategy would also include being vigilant for any signs of a trend reversal indicated by the RSI or MACD diverging from the price movement.

MTL/USDT In this support area, need to bounce for continue UP!💎 MTL has recently exhibited significant market dynamics, with a notable bounce from the support area. However, it appears that the price is poised for a back test of this support level.
💎 If MTL manages to rebound from this support, there is potential for the price to resume its upward trajectory and continue towards a retest of the strong resistance area.
💎 On the other hand, if MTL fails to demonstrate strength by either failing to bounce from the support area or breaking down below it, there is a possibility that the price may descend to the demand area around 1.345.
💎 It's crucial to monitor how MTL reacts around the demand area. A successful bounce from this level is imperative as it signifies robust support. However, if MTL fails to sustain itself above the demand area, it could signal further downward movement.

MTL is starting a mega trend! 1588% profitMTL looks absolutely promising! We are breaking out of the bullish flag pattern on the weekly chart with a strong engulfing candle. The bearish structure is broken, and a new uptrend is beginning. A 1588% profit is very likely if you buy this coin right now. If you want to take a profit early, you can use my first profit target in the short-term.
Let me know what you think about my analysis, and please hit boost and follow for more ideas. Trading is not hard if you have a good coach! Thank you, and I wish you successful trades.
About Metal DAO
Metal DAO (MTL) is a utility token that currently governs the stablecoin Metal Dollar (XMD), in addition to providing tiered trading discounts to MTL holders when using the Metal Pay cash & crypto app. Metal Pay customers who own 10,000+ MTL can enjoy 0% fees on all cryptocurrency purchases.
Metal DAO's future utility includes the ability to propose new stablecoins for the Metal Dollar basket, including their allocation ratios, and the option to vote in new stablecoin issuers such as community banks or fintechs.
Metal Pay was developed and launched by Metallicus in 2016.
Let me know what you think about my analysis, and please hit boost and follow for more ideas. Trading is not hard if you have a good coach! Thank you, and I wish you successful trades.

MTL looks bullishFrom where we wrote "start" on the chart, a large degree triangle is finished.
The move after this triangle cannot be this small. So, according to our timing rules, if this triangle is finished, this pump was the only a/w wave, and the recent correction was b/x, and finally a bullish wave (c/y) remains.
It can be pumped by maintaining the green range.
Closing a daily candle below the invalidation level will violate the analysis
For risk management, please don't forget stop loss and capital management
When we reach the first target, save some profit and then change the stop to entry
Comment if you have any questions
Thank You

MTL POSSIBILITY FOR BREAK UP $3Thank you for reading this update.
MTL can show in the coming time an interesting break what could effect up $3
we will follow the trend for confirmations.

#MTL/USDT#MTL
The price chose the downward channel to the upside, and the channel has now been retested again at the 1.65 level, and it is expected to bounce back up.
We have an uptrend on RSI
We have a higher stability moving average of 100
Entry price is 1.65
The first goal is 1.27
Second goal 1.83
Third goal 1.98
