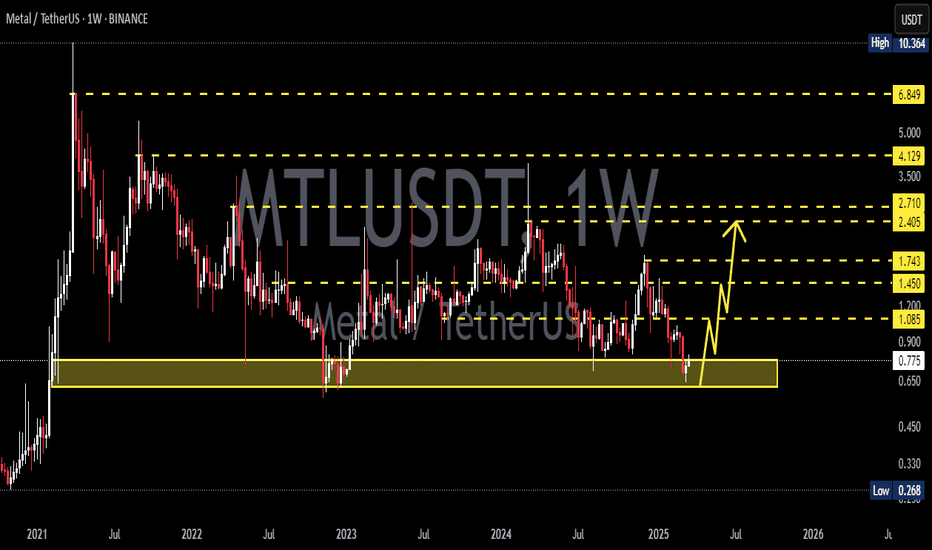
Mtlusdtlong
#MTL/USDT Ready to go higher#MTL
The price is moving in a descending channel on the 1-hour frame and sticking to it well
We have a bounce from the lower limit of the descending channel, this support is at 1.10
We have a downtrend on the RSI indicator that is about to be broken, which supports the rise
We have a trend to stabilize above the moving average 100
Entry price 1.15
First target 1.19
Second target 1.22
Third target 1.27
#MTL/USDT#MTL
The price has broken the descending channel on the 1-day frame upwards and is expected to continue.
We have a trend to stabilize above the 100 moving average again.
We have an upward trend on the RSI indicator that supports the rise by breaking it upwards.
We have a support area at the lower limit of the channel at a price of 0.0780.
Entry price 1.00.
First target 1.21.
Second target 1.42.
Third target 1.76.
MTL/USDT is on the verge of a big breakout!🚀 MTL/USDT is on the verge of a big breakout! 🚀
The MTL/USDT trading pair is showing promising signs of a potential breakout as it nears a critical resistance level. 📈 If it manages to break through, it could spark a strong bullish rally, driving prices higher. 🔥
💡 Here’s what to watch for:
- Key resistance levels: A breakout above this level could signal the start of a new bullish trend, paving the way for significant upward movement. 🚀
- Trading volume: Keep an eye on buying volume, as a surge could indicate growing market interest and support for a breakout. 📊
- Market sentiment: Pay attention to overall market trends, as they may influence the strength and continuation of the breakout. 🏦
👀 Stay tuned: This setup could provide a great opportunity for traders looking to capitalize on a potential upward trend. However, always remember to trade responsibly and manage your risk. 🧐
⚠️ Disclaimer: This is not financial advice. Always do your own research (DYOR) before making any investment decisions.
#MTL/USDT#MTL
We have a bearish channel pattern on a 4-hour frame, the price moves within it, adheres to its limits well, and is expected to break it upwards in a strong manner.
We have a support area at the lower border of the channel at 1.50
We have a tendency to stabilize above moving average 100
We have a downtrend on the RSI indicator that supports the price higher
Entry price is 1.60
The first goal is 1.83
The second goal is 1.94
the third goal is 2.07
#MTL/USDT#MTL
The price chose the downward channel to the upside, and the channel has now been retested again at the 1.65 level, and it is expected to bounce back up.
We have an uptrend on RSI
We have a higher stability moving average of 100
Entry price is 1.65
The first goal is 1.27
Second goal 1.83
Third goal 1.98
MTLUSDT#
i expect there will be a correction move we have very important and strong support zone and we are in over sold area MACD is showing bullish RSI showing bullish EMAs is neutral ZELMA is showing uptrend-move Ichimoku cloud is neutral Fib retracement is showing bullish Accumulation distribution is bullish buy and hold it to the next targets at the chart
MTLUSDT AnalysisHello friends.
Please support my work by clicking the LIKE button(If you liked).Thank you!
Everything on the chart.
open pos: market and lower
target: 3.7 - 4.7 - 5.7
after first target reached move ur stop to breakeven
stop: ~under 2.5 (depending of ur risk). ALWAYS follow ur RM .
risk/reward 1 to 5
risk is justified
Good luck everyone!
Follow me on TRADINGView, if you don't want to miss my next analysis or signals.
It's not financial advice.
Dont Forget, always make your own research before to trade my ideas!
Open to your questions or suggestions.
MTLUSDT Daily TimeframeSNIPER STRATEGY (new version)
It works ALMOST ON ANY CHART.
It produces Weak, Medium and Strong signals based on consisting elements.
NOT ALL TARGETS CAN BE ACHIEVED, let's make that clear.
TARGETS OR ENTRY PRICES ARE STRONG SUPPORT AND RESISTANCE LEVELS SO THEY CAN ACT LIKE PIVOT POINTS AND REVERSE THE WAVE (or act like a mirror that can reflects light) BASED ON STRENGTH OF THAT LEVEL.
ENTRY PRICE BLACK COLOR
MOST PROBABLE SCENARIOS TARGETS GREEN COLOR
LEAST PROBABLE SCENARIOS TARGETS RED COLOR
TARGETS ARE NOT EXACT NUMBERS THEY ARE MORE LIKE A ZONE.
DO NOT USE THIS STROTEGY FOR LEVERAGED TRADING.
It will not give you the whole wave like any other strategy out there but it will give you a huge part of the wave.
The BEST TIMEFRAMES for this strategy are Daily, Weekly and Monthly however it can work on any timeframe.
Consider those points and you will have a huge advantage in the market.
There is a lot more about this strategy.
It can predict possible target and also give you almost exact buy or sell time on the spot.
I am developing it even more so stay tuned and start to follow me for more signals and forecasts.
START BELIEVING AND GOOD LUCK
HADIMOZAYAN


