EM1 Signs agreement with MTN Emerge Gaming signs a 2 year agreement with MTN to distribute and market Emerge’s mobile competition and tournament platform technology. Huge potential with big profits for both companies. Great exposure for EM1 with MTN being the eighth largest Mobile Network Operator in the world and the largest in Africa. MTN has committed to invest into the marketing support and prizes in the first 12 months of the agreement. EM1 has also stated they have efficient cash on hand to fund the launch of the MTN Arena platform.
In my analysis I have marked the support and resistance zones.
leave a comment if you have any other ideas.
MTN
MTN failed breakthrough of triangle Nope, doesn't look like it's gonna breakthrough, rather getting out of this one.
Disclaimer: The views provided herein do not constitute financial advice.
Please feel free to comment, critique or add to my view, I welcome feedback, whether it agrees with my views or not.
This idea is based on my strategy, please consider your own before using it in any way. Always use a stop-loss and manage risk.
MTN struggling here to break throughI'm holding MTN and want it to go higher, but it really seems to be struggling here, would need to break out of this triangle.
Disclaimer: The views provided herein do not constitute financial advice.
Please feel free to comment, critique or add to my view, I welcome feedback, whether it agrees with my views or not.
This idea based on my strategy, please consider your own before using it in any way. Always use a stop-loss and manage risk.
MTN at an important inflection point.The MTN share price is at a very interesting inflection point. The Level of R85 is where we find both the trendline support which formed from the September 18’ lows as well as the declining channel which has formed since June. The moving averages are configured with a slight bearish bias so I would not look for extended targets here, but given that the 200 day moving average is still pointing higher gives me some comfort that the bearish trend is not too extreme and the probability of a bounce is likely. Look to buy between R85 to R87, using a stop loss as a close below R84.00. On the upside I would look for a target of R92 which is the same level the stock recently found support (should now turn into resistance). For extended targets it is possible that the stock might retest the upper end of the declining channel which is at R96 and declining daily. I am also seeing some divergence on the RSI which matched its previous low, even though price made a new low. This could potentially be warning of a rally to come.
Enter - R85 to R87
Stop loss close below : R84
Target : R92 and R96
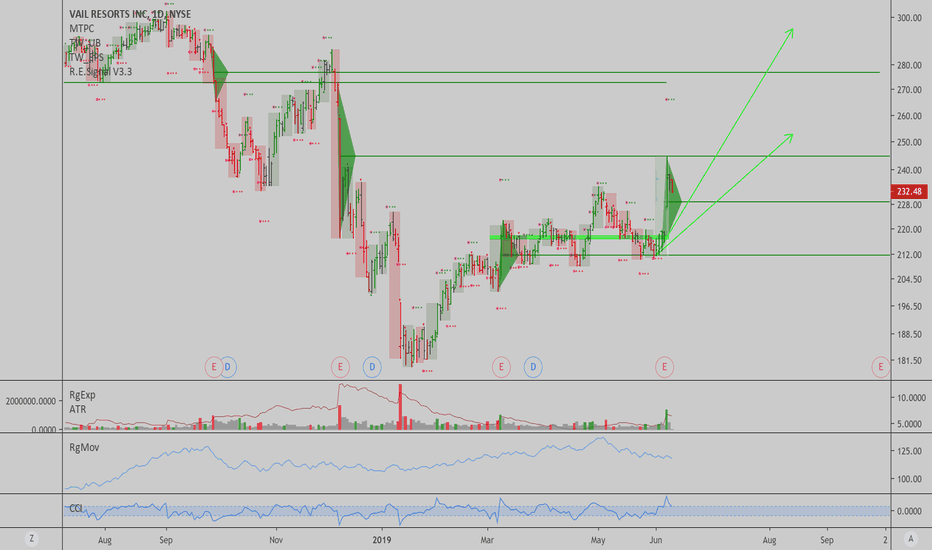
MTN: Vail Resorts has a nice weekly trend...I like the chart here, $MTN has some nice upside potential, both from a technical and valuation stand point.
As long as prices don't slide below $216, we can expect a 10 week rally from here, reaching prices as high as $295 possibly.
Best of luck,
Ivan Labrie.
MTN at strong resistanceJSE:MTN is currently at quite a strong resistance level and the expectation is that it will find resistance again. If it bounces off the resistance level, we will look to enter a short once it breaks through the fractal of 26th of July.
If it breaks through the resistance, we could possibly be looking at a potential long position.
Bearish divergence on MTNThe MTN share price has steadily improved since creating a low of R75.05 in February. The recent uptick has seen it touch a short-term high of R111.23. The upward momentum seems to be reducing however, and the stock has struggled to break above the R110.00 horizontal resistance.
This solid resistance could potentially form a turning point for MTN. Especially with the bullish run of the last few months running out of steam.
What interests me more though, is the bearish divergence on the MACD.
Have a look at the chart. MTN reached R106.47 in April and then R111.23 in June. In other words, the stock went higher, yet the MACD went lower. Now MTN is again near the high of June but the MACD is still going lower.
That is a classic bearish divergence and indicates we might see a change in trend from bullish to bearish. On top of that, the Slow Stochastic also shows MTN to be overbought at current levels. This is adding to the bearish sentiment.
Action: Place a Limit order to SELL at R110.00 or better with a Stop Loss set at R122.50. I will aim to take profit at R100.00 and R90.00 respectively.
$JSEMTN has turned technically bullish on the dailyI don't want to use this chart to give targets but merely as an illustration of what a very strong technical chart looks like. Firstly as can be seen by the price action we have seen successive higher lows and higher highs on MTN which is very much a characteristic of bullish chart. Adding to that, we have also seen all the major moving averages cross upward and above the 200 day moving average. This chart has all the characteristics in place for further upside to present itself. I would be a buyer on any dips in the MTN share price. If the stock closes below the previous high/low level of R97.00 that would be my stop loss.


