MU breaks through ATHs Bullrun does not relent LONGMU on the monthly chart 4 weeks ago crossed above the previous ATHs of 2021-2022 and has
risen without retesting. Adding $9 to the all time highs for 10% inflation since then would adjust
them to $104 and price is now in that range and above. Price is in the uppermost anchored
VWAP bands and thus prone to reversal. However, MU is not as overextended as NVDA. Its
upside is likely there as it competes in the space. Growth will accelerate once the new chip
plant in upstate NY comes online after the construction is completed. NVDA is reportedly
looking at Vietnam. I already have a large sized position in MU. I will add to it now even
if it may be overbought. There is good cause for the overbuying. I want to support the domestic
economy and understand national security interests in chip manufacturing here in the USA
consistent with the recent federal law and stimulus associated with it.
MU

MU Micron Technology Options Ahead of EarningsIf you haven`t bought the dip on MU:
Then analyzing the options chain and the chart patterns of MU Micron Technology prior to the earnings report this week,
I would consider purchasing the 95usd strike price Calls with
an expiration date of 2024-7-19,
for a premium of approximately $9.45.
If these options prove to be profitable prior to the earnings release, I would sell at least half of them.

Can we see 800?If my tech analysis is correct, this can hit 800. Stop Loss 100. Buckle Up in this AI craziness.

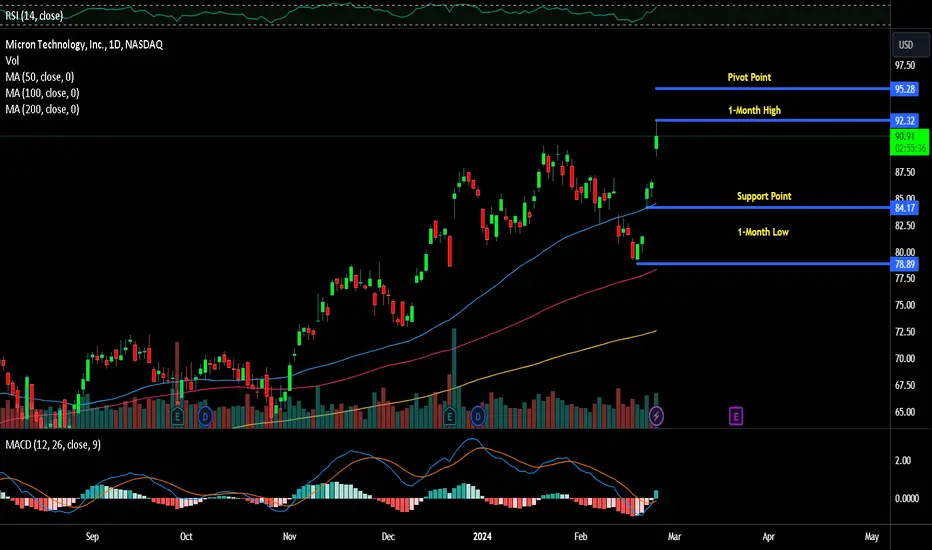
MU potential buy setupReasons for bullish bias:
- Price has given channel breakout
- Entry at 0.382 fib retracement
- Earnings date is 20 March, it might pump up
- Safe Entry will be above 102
Here are the recommended trading levels:
Entry Level(CMP): 94.16
Stop Loss Level: 78.64
Take Profit Level 1: 109.68
Take Profit Level 2: Open

Micron's Meteoric Rise: AI Server Demand Propels to New HeightsMicron Technology Inc. ( NASDAQ:MU ) stands tall as a prime beneficiary. The recent surge in Micron's stock price, following an impressive earnings report and optimistic guidance, underscores the pivotal role the company plays in powering AI-driven innovations. With CEO Sanjay Mehrotra at the helm, Micron's strategic vision and robust performance position it as a leader in the semiconductor industry's AI revolution.
Unveiling the Numbers:
Micron's fiscal second-quarter earnings report exceeded all expectations, sending its stock soaring by a remarkable 18% in after-hours trading. The Boise-based company reported adjusted earnings of 42 cents per share, a significant leap from the previous year's loss of $1.91 per share. Revenue surged to $5.82 billion, up from $3.69 billion a year earlier, far surpassing analysts' estimates.
AI's Ascendancy:
What sets Micron ( NASDAQ:MU ) apart in this era of technological advancement is its pivotal role in catering to the burgeoning demand for AI-powered applications. CEO Sanjay Mehrotra's astute observation regarding AI server demand tightening supply dynamics sheds light on Micron's strategic positioning. The company's robust performance in the memory and storage chip markets, fueled by AI-driven demand, has led to substantial price increases, further bolstering its revenue and profitability projections for fiscal 2025.
Charting New Heights:
A closer look at Micron's ( NASDAQ:MU ) stock chart reveals a compelling narrative of growth and consolidation. Breaking out from a 16-month ascending channel in late February, Micron's stock price surged to an all-time high. Despite a brief period of consolidation preceding the earnings release, the stock's post-earnings breakout signals a bullish trend. Notably, the emergence of a double top pattern around $98 suggests a potential future price support level, highlighting investor confidence in Micron's long-term prospects.
Future Prospects:
As Micron ( NASDAQ:MU ) continues to ride the wave of AI-driven demand, investors remain optimistic about its future trajectory. With a projected current-quarter midpoint adjusted earnings of 45 cents per share and revenue forecasted at $6.6 billion, Micron ( NASDAQ:MU ) is poised for sustained growth. CEO Sanjay Mehrotra's strategic vision, coupled with Micron's technological prowess, positions the company as a frontrunner in shaping the future of AI-driven innovation.

Micron Technology ($MU) Strike Partnership with NvidiaMicron Technology ( NASDAQ:MU ) emerges as a pivotal player, strategically positioning itself to capitalize on the accelerating demand for artificial intelligence (AI) infrastructure. Embarking on a promising trajectory, Micron's ( NASDAQ:MU ) recent collaboration with Nvidia ( NASDAQ:NVDA ) heralds a new chapter in its journey, propelling the company towards unprecedented growth and market dominance.
Harnessing the Power of AI:
As AI permeates diverse sectors, from autonomous vehicles to healthcare, the demand for robust computing solutions intensifies. Micron's ( NASDAQ:MU ) foresight in recognizing AI's pivotal role in shaping the future prompts strategic investments, particularly in its high-bandwidth-memory (HBM) chips. The integration of Micron's cutting-edge technology into Nvidia's latest H200 semiconductors amplifies performance, heralding a paradigm shift in AI infrastructure.
Strategic Collaboration with Nvidia:
The symbiotic partnership between Micron ( NASDAQ:MU ) and Nvidia underscores a shared vision of pioneering advancements in AI computing. Nvidia's unveiling of the H200 chip, boasting doubled inference performance over its predecessor, signifies a quantum leap in AI processing capabilities. Micron's ( NASDAQ:MU ) pivotal role in supplying HBM chips for the H200 not only underscores its technological prowess but also signifies a lucrative revenue stream, with projections hinting at generating "several hundred millions of dollars" in fiscal 2024.
Positioned for Growth:
Micron's ( NASDAQ:MU ) bullish stance on AI augurs well for its financial outlook, with projections indicating robust revenue growth amidst escalating demand for AI-related technologies. Despite an anticipated loss per share in the upcoming second-quarter earnings, Micron ( NASDAQ:MU ) remains buoyant, with revenues forecasted around $5.3 billion. CEO Sanjay Mehrotra's optimistic outlook underscores the company's confidence in navigating the burgeoning AI landscape, poised for sustained growth and market expansion.
Driving Innovation, Redefining Possibilities:
Micron's ( NASDAQ:MU ) innovative strides not only amplify AI performance but also address critical concerns such as power consumption, aligning with the industry's sustainability agenda. By enhancing memory bandwidth and capacity, Micron ( NASDAQ:MU ) empowers AI developers to unlock new frontiers of innovation, transcending conventional boundaries. As the International Energy Agency highlights the exponential growth of data centers, Micron's technological breakthroughs emerge as a catalyst, fueling the AI revolution and shaping the digital landscape of tomorrow.
Micron's Path to Recovery Signals a Bullish Trend for $MU Stock
After weathering a challenging post-pandemic downturn in the memory-chip markets, Micron Technology Inc. (NASDAQ: NASDAQ:MU ) is emerging from the storm with promising indicators of recovery. The company's fiscal first-quarter earnings report reflects higher revenue, an improving gross margin, and rising average selling prices for DRAM and NAND chips. As global shipments of PCs are poised for growth in the coming year and demand for AI-computing capacity continues to rise, Micron anticipates a record year for the memory-chip industry in 2025.
A Glimpse into Micron's Performance:
Despite still facing financial losses, Micron's recent fiscal performance showcases encouraging signs. In the first quarter, the company reported a 16% year-over-year revenue growth, reaching $4.7 billion. This growth was primarily driven by robust sales of DRAM chips. Notably, DRAM bit shipments surged by over 20% from the previous quarter, accompanied by an upward trend in average selling prices. The NAND business experienced a mixed quarter, with bit shipments decreasing by a mid-teens percentage while average selling prices soared by about 20%.
PC Market Resurgence:
One key factor contributing to Micron's recovery is the anticipated return to growth in the global shipments of PCs in the upcoming year. With inventory levels across the PC supply chain stabilizing and returning to normal, Micron is well-positioned to benefit from increased demand for memory chips. As the world adapts to new work and learning paradigms, the demand for PCs is expected to rise, driving Micron's growth in the market.
Smartphone Shipments and AI-Computing Demand:
In addition to the positive outlook in the PC market, Micron stands to gain from potential growth in smartphone shipments. After a prolonged slump, the smartphone market is showing signs of revival, presenting Micron with additional avenues for revenue generation. Moreover, the relentless demand for artificial intelligence (AI)-computing capacity is expected to buoy the market for servers, further contributing to Micron's positive trajectory.
Looking Ahead to 2025:
While Micron acknowledges that 2024 will be a recovery year, the company is optimistic about the industry's prospects in 2025. Micron envisions 2025 as a record year for the memory-chip industry, suggesting sustained growth and profitability for the company. Investors eyeing the long-term potential of the semiconductor market may find Micron's forecast compelling, as the company positions itself for a robust future.
Micron's recent performance, coupled with positive industry trends, paints a promising picture for NASDAQ:MU stock. As the memory-chip market rebounds and key sectors such as PCs, smartphones, and AI continue to drive demand, Micron appears poised for a strong recovery. While challenges persist, the light at the end of the tunnel shines brighter, making Micron an intriguing prospect for investors seeking growth and resilience in the dynamic semiconductor landscape.
Technical Analysis
Micron Technology is in a rising trend channel in the medium long term. investors over time have bought the stock at higher prices and indicates good development for the company. The price has risen strongly since the positive signal from the rectangle formation at the break through resistance at 72.28.
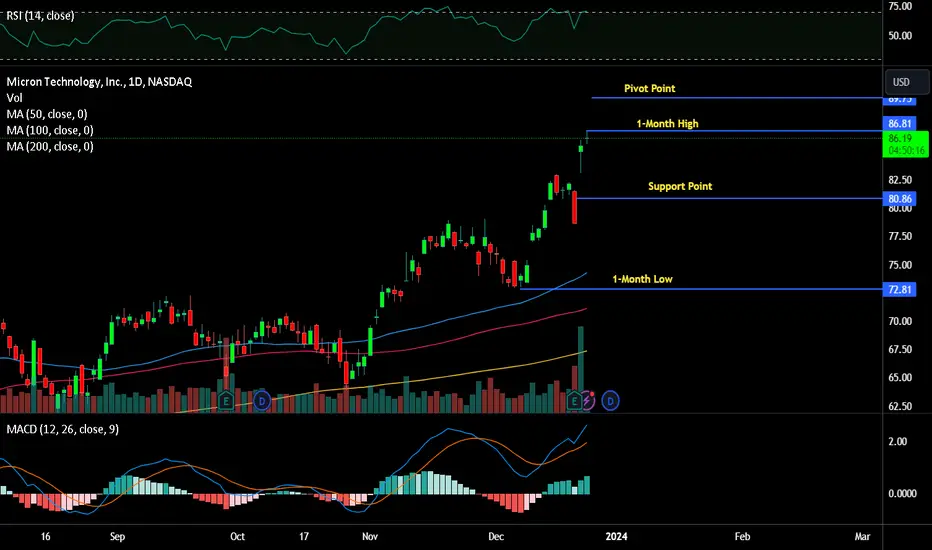
MU Micron Technology Options Ahead of EarningsIf you haven't bought MU here:
Then analyzing the options chain and the chart patterns of MU Micron Technology prior to the earnings report this week,
I would consider purchasing the 75usd strike price Calls with
an expiration date of 2024-1-19,
for a premium of approximately $3.37.
If these options prove to be profitable prior to the earnings release, I would sell at least half of them.
Looking forward to read your opinion about it.
Micron Tech forming a flag?MU is very interesting to me at the moment, it's currently formed a flag and as you can see in the chart we have had a steady up trend across the board in both price, RSI and MACD.
You could argue MACD has already broken out of a triangle type formation to the upside even.
The risk-to-reward ratio is quite good, you can place a trade with a stop loss just under the flag and it gives you almost a 9:1 RR. With a more liberal stop loss, you are still
looking at an R:R of almost 3:1.
The main concern here is if the tech sector start lagging in general, this could easily lag with it. Which is why I am inclined to buy the breakout and not the flag formation.
Cheers

$INTC - Rising Trend Channel [MID-TERM]🔹Between support 32.86 and resistance 37.24 in Rectangle Formation.
🔹In case of a NEGATIVE reaction, it has support at approximately 33.
🔹Technically POSITIVE for the medium long term.
Chart Pattern:
◦ DT: Double Top | BEARISH | 🔴
◦ DB: Double Bottom | BULLISH | 🟢
◦ HNS: Head & Shoulder | BEARISH | 🔴
◦ REC: Rectangle | 🔵
◦ iHNS: inverse head & Shoulder | BULLISH | 🟢
Verify it first and believe later.
WavePoint ❤️

MU offers 15% - 20% ROI opportunities Micron Technology Inc. (MU) in a two-sided framework, capable of contain buying and selling pressures on a weekly basis.
If (MU) were able to close above the resistance of this framework on a weekly basis, this would elicit a buy-signal where gains of 20% would be anticipated over the following 2 - 3 months.
Inversely, if a weekly settlement below the support of this framework occurred on a weekly basis, (MU) would be susceptible to losses of 15 - 20% over the following 1 - 2 months.

AFRM - Rising Trend Channel [MID-TERM]🔹Breakdown support of rising trend channel in the medium long term.
🔹Support at 13.81 and Resistance at 19.99 in Rectangle formation
🔹Slightly risen above the resistance level of 17.
🔹Technically POSITIVE for the medium long term.
Chart Pattern:
🔹DT - Double Top | BEARISH | 🔴
🔹DB - Double Bottom | BULLISH | 🟢
🔹HNS - Head & Shoulder | BEARISH | 🔴
🔹REC - Rectangle | 🔵
🔹iHNS - inverse head & Shoulder | BULLISH | 🟢
Verify it first and believe later.
WavePoint ❤️

Is NVDA done correcting? LONGNVDA shot up on earnings two months ago and more or less went sideways until
mid July when it trended up for a week and then reversed downward.
On the 2H chart, I have placed both a VWAP anchored to the earnings date as
well as a volume profile. Price is currently above the 0.5 Fib level as well
as at one standard deviation above the mean VWAP and above the POC line of
the volume profile. The mean VWAP and POC are confluent at about 422.
I suspect that it is at this level that volatility will be the highest and at where
buyers will step in to open a trade shares of NVDA that have been oversold
and are undervalued. Because of that, I will place NVDA on my watchlist for
a long trade when it trends down approaching 422. The stop loss will be
418 or about 1% while targeting the recent double top of 475 and so a zone of
horizontal resistance confluent with dynamic resistance in the red line of
two standard deviations above the mean VWAP. Confirmation of an upcoming
reversal is the histogram of the zero-lag MACD going red to green. NVDA has
had a great run this year (220%) and its heavy presence in the AI megatrend
bodes well for a good continuation.

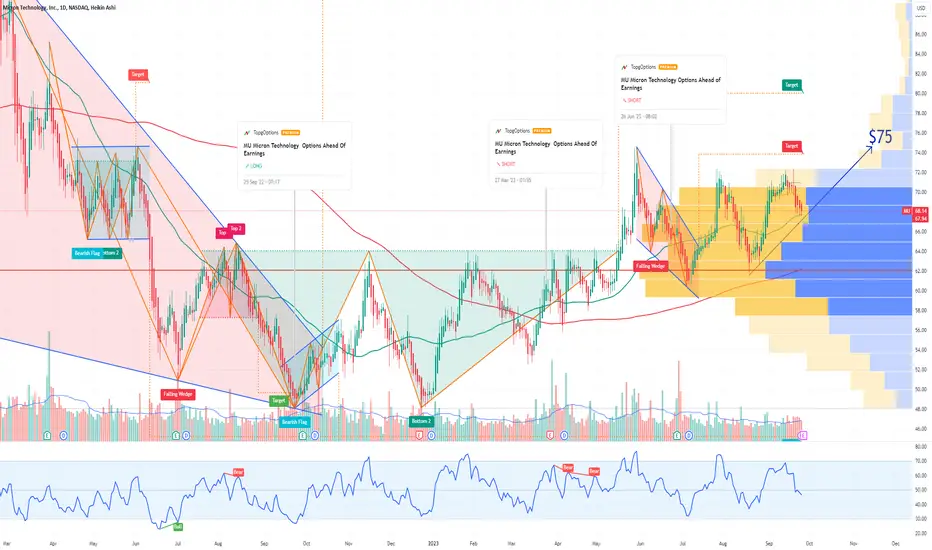
MU bullishAccording to analyst ratings, the average 12-month price target for Micron (MU) is $75.32. The forecasts range from a low of $46 to a high of $100. The average price target represents an increase of 17.36% from the last closing price of $64.69.
The 30 analysts offering 12-month price forecasts for Micron Technology Inc have a median target of 79.00. The median estimate represents a +17.23% increase from the last price of 67.39.
Micron Technology has received a consensus rating of Moderate Buy. The company's average rating score is 2.73, and is based on 23 buy ratings, 6 hold ratings, and 1 sell rating.

ASML - Rising Trend Channel [MID -TERM]🔹Forming inverse head and shoulders pattern.
🔹Breaking resistance at 793 indicates further rise.
🔹POSITIVE signal from Rectangle formation breakout resistance at 668; Next resistance at 762.
🔹Technically POSITIVE for medium-term long-term.
Chart Pattern;
🔹DT - Double Top | BEARISH | 🔴
🔹DB - Double Bottom | BULLISH | 🟢
🔹HNS - Head & Shoulder | BEARISH | 🔴
🔹REC - Rectangle | 🔵
🔹iHNS - inverse head & Shoulder | BULLISH | 🟢
Verify it first and believe later.
WavePoint ❤️

MU Long hidden strength even after bad news SL pink line
TP Blue line
breakout of resistance and turn to support now
Even big news 2 days ago from China, price manages to show strength at resistance turns support level
many top guru have this counter
Portfolio Manager % of portfolio Recent activity Shares Value
≡ Mohnish Pabrai - Pabrai Investments 79.22 Reduce 14.44% 1,592,134 96,069,000
≡ Li Lu - Himalaya Capital Management 20.20 Reduce 40.52% 6,826,079 411,886,000
≡ Prem Watsa - Fairfax Financial Holdings 16.49 Add 10.91% 3,839,849 231,658,000
≡ Guy Spier - Aquamarine Capital 6.24 200,000 12,068,000
≡ Ruane, Cunniff & Goldfarb - Sequoia Fund 3.44 1,683,406 101,577,000
≡ Harry Burn - Sound Shore 1.95 Reduce 25.01% 277,060 16,718,000
≡ Meridian Contrarian Fund 1.59 Reduce 5.49% 172,000 8,597,000
≡ Daniel Loeb - Third Point 1.18 Buy 1,200,000 72,262,000
≡ Viking Global Investors 0.81 Reduce 65.82% 2,856,599 172,367,000
≡ Yacktman Asset Management 0.38 Reduce 8.90% 639,903 38,612,000
≡ Lee Ainslie - Maverick Capital 0.02 Add 61.95% 12,760 770,000

MU Micron Technology Options Ahead of EarningsIf you haven`t bought MU here:
Or sold here:
Then Analyzing the options chain of MU Micron Technology prior to the earnings report this week,
I would consider purchasing the 64usd strike price Puts with
an expiration date of 2023-6-30,
for a premium of approximately $1.54.
If these options prove to be profitable prior to the earnings release, I would sell at least half of them.
Looking forward to read your opinion about it.

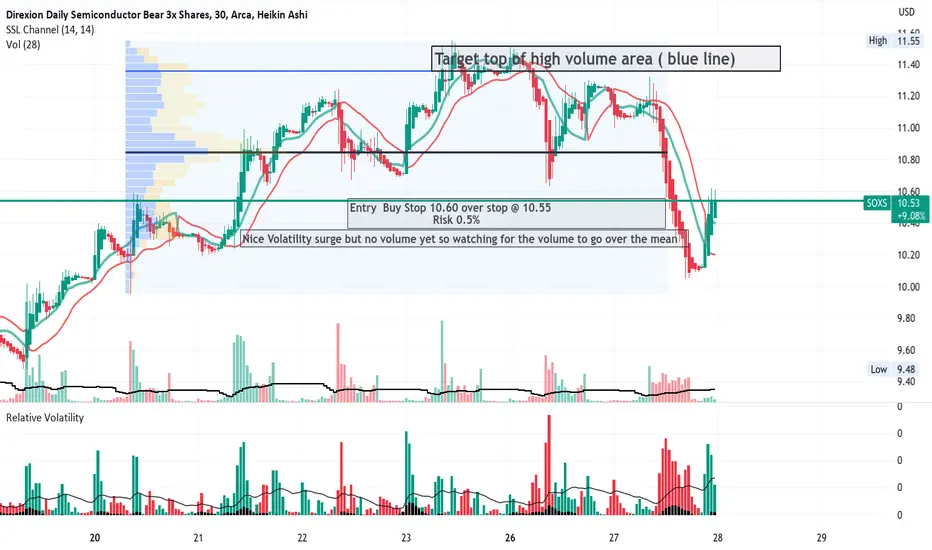
SOXS Bearish Leveraged semi-conductors ETFNVDA turned down today while SOXS rose a bit. On the 30 minute chart is shown to have
have been trending down but then reversed in the after-hours trading period albeit with
the low volumes typical of after-hours. The relative volatility indicator however showed
a dramatic reversal and will be beyond the moving average within the indicator.
Overall, I see this as a day trade for June 27th. I have marked out a tight stop loss to minimize
risk. This trade which I will enter in the premarket is expectant for 8-9% profit and so
a reward to risk of 15:1
Short Semiconductors by Trading SOXS LongThis chart shows the long-term ratio between SOXL/SOXS. The intent is to detect reversals
between semi-conductors long and short. At the pivot high, the price of SOXL compared with
SOXS is at its highest. With a retreat from the pivot high, the price of SOXL is retreating while
SOXS is rising. Historically in 2022 as shown on the chart, pivots were with a ratio of 1,25 to
2,35 while the low pivots were with a ratio of 0.2 to 0.6.
At present SOXL has run up and over-extended as part of the AI breakout phenomenon. The
ratio of 1.8 is in the reversal zone where SOXL price is dropping while SOXS price begins
a significant rise. At present, the mass index is above 27 and awaiting a drop below 26.5.
The second indicator rate of change (ROC) detects spikes in the SOXL /SOXS ratio presumptive
for a pivot. The last time SOXS ran up over a long term ( with SOXL turning down)
was August to October when price increased from $33 to $88 representing a 266% rise.
I see this as a prior supertrend that could now be repeated again.
In conclusion, this idea leads me to take a swing long position is SOXS which I expect to
trend up over a period of a couple of months or more.

PATH - Rising Volume Lifts PricesOn the 4H chart PATH was on a trend down in April. The strength momentum ( green band) was
in a narrow range. In May as can be seen on the indicators, both volume and more especially
volatility have increased significantly. The chart pattern is now that of an upward facing
megaphone reflecting the volatility. The strength momentum band is much wider. Price
is above the POC line of the volume profile reflecting a bullish dominance. Fundamentally,
PATH is a player is the exploding AI subsector. Cathie Wood is quietly accumulating shares for
her ETFs as are many other large portfolio investors. In summary, PATH appears to be
an excellent long setup. Sitting in the shadows of NVDA, MU, TSM and others whose focus is
hardware, PATH provides software and services it. Its path to hypergrowth and so price
appreciation appears to be abundantly clear.

NVDA can it fall from the ceiling after EarningseOn the 2hr chart, NVDA popped from earnings over 20% putting with a PE Ratio sky high
on the promise of semiconductor heaven and AI ecstasy. Can it stay there ? Will it lead
other technology companies ( semiconductors / cloud services / AI et cetera) higher
as well ? Is it now overbought and looking at a glass ceiling? The indictors suggest a near-term
top, I think. ( Money Flow Index. Stochastic RSI ). Accordingly, I will buy put options
striking $ 400 for expiration 7/21 and be quick to take profits expecting NVDA to
equilibrate in less than a week. In th meanwhile, I will hdege by keeping my AMD
and MU call options open figuring that they will jump up as copy cats of this move.
I will cut them loose as soon as price action and a loss of volume suggest retracement as well.
I see buyers who got in late with high FOMO to be the lad sellers fueling the put options
into easy profit.

ASML makes the technology that makes semiconductorsASML is shown here on the one-hour chart as having a great quarter with consecutive favorable
earnings It has moved above the blue volume trading range on the profile. The accumulation
distribution indicator shows persistent and high accumulation. The volume heat map shows
recent heat volume spikes. Since ASML has products essential to chip- manufacturing and is the
leader in its field it is very well positioned for the AI boom that is underway according to all
the chatter. ASML is one of the IBD Top 50 tech stocks. If the chart is zoomed out, there is a
rising wedge which might be a bit of bearish bias. Overall, I see this as a long setup worth
buying.

Update $MU , Analysing Trends, Patterns, and IndicatorsGreetings, fellow traders! I am thrilled to present my analysis and insights on TradingView, where I will be sharing trend analysis, chart patterns, and technical indicators to help you navigate the exciting world of the stock market. It's important to note that I maintain a neutral stance and base my decisions solely on identifying promising opportunities.
As an observer of market trends, my goal is to provide you with comprehensive and visually appealing charts that showcase the potential opportunities I see. Please remember that I am not a financial advisor, and any investment decisions you make should be thoroughly researched and evaluated based on your own risk tolerance and financial goals.
In each analysis, I will walk you through the patterns and indicators I have identified, highlighting key support and resistance levels, trendlines, and other critical technical aspects. My approach is to objectively present the information and allow you to interpret it as you see fit. Whether you choose to go long or short in the stock market is entirely up to you.
My main focus is to share the knowledge and insights I have gained from studying charts and technical analysis. By doing so, I hope to contribute to your trading journey and help you become a more informed and confident trader. It is important to continuously learn and adapt to the ever-changing dynamics of the market.
I invite you to join me on this exciting journey as we explore the fascinating world of trading together. Feel free to provide feedback, ask questions, and share your own perspectives in the comments section. Your engagement and participation are greatly appreciated.
Remember, trading carries risks, and it is essential to conduct thorough due diligence before making any investment decisions. I am here to provide information, but the responsibility lies with each individual trader to make their own choices.
Thank you for taking the time to explore my charts. I hope you find value in the insights I share, and may they contribute to your trading success. Happy trading!
Disclaimer: I am not a financial advisor. The analysis and opinions expressed here are solely based on my observations and should not be considered as financial advice. Please consult with a licensed professional before making any investment decisions.
