BTC multi-timeframe: bullish momentum and strong support zones__________________________________________________________________________________
Technical Overview – Summary Points
__________________________________________________________________________________
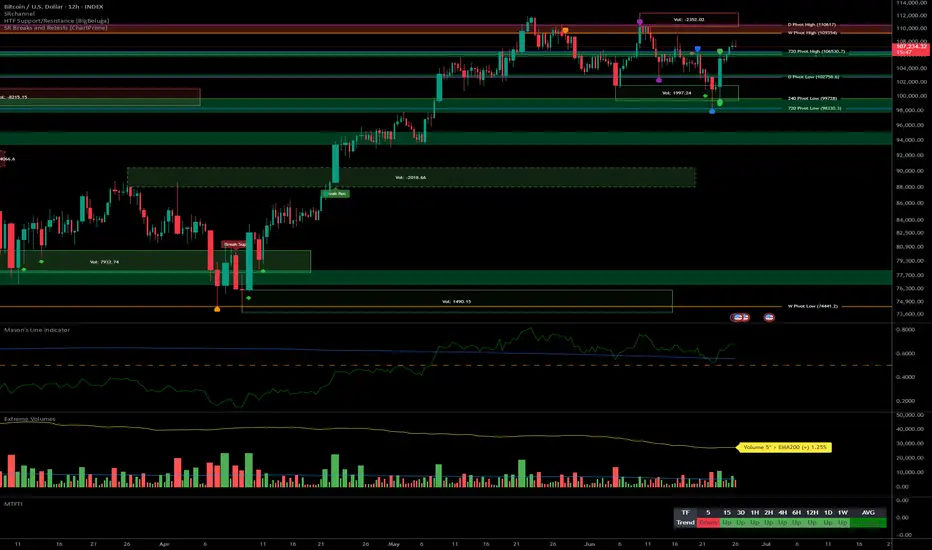
Momentum: Clear bullish bias across all timeframes (MTFTI Up everywhere except 5min). Weak selling pressure, no distribution or capitulation signals.
Support/Resistance: Key resistances: 110647–109554 (HTF). Major supports: 102756 (D Pivot Low), 98330 (720 Pivot Low). Multiple buy zones on retracement.
Volume: Recent volumes below "extreme" threshold, no euphoria/capitulation detected.
Multi-TF Behavior: Global bullish alignment, volatility present intraday, but no confirmed reversal risk. Risk On / Risk Off Indicator shows no major anomaly.
__________________________________________________________________________________
Strategic Summary
__________________________________________________________________________________
Strategic Bias: Structurally bullish market. Prioritize tactical buys on pullback, active risk management.
Opportunities: Reinforce long positions on $106k/$103k/$100k retrace. Partial targets below 110–111k.
Risk Zones: Rejection under 106500–107000 with extreme volume spike = short-term top signal. Invalidation if H1 < 106k or H4 < 102.7k.
Macro Catalysts: US calendar (GDP, durable goods, jobless claims), geopolitics (Russia/Ukraine). No systemic alert, but caution required.
Action Plan: Filter entries on technical supports, exit on extreme sell volume or macro shock.
__________________________________________________________________________________
Multi-Timeframe Analysis
__________________________________________________________________________________
1D: Compression below historical resistances (109–111k), solid momentum, potential buy zone 102750–98330.
12H: Multiple resistances, uptrend, support confluence 102756–106530 pivot key.
6H: Price under resistance cluster (106530), possible profit-taking on rejection, strong support 102756.
4H: High-range structure, reinforced supports, next breakout could trigger acceleration with volume.
2H: Pivot zone 106500–107200, caution below close, buy zone on correction.
1H: Support stacking structure, no clear breakdown, critical node, aggressive buy 106100–105800.
30min: Compression at range high, caution on buying resistance, key spots 106000/104500.
15min: Possible buyer exhaustion under 108k, tactical buy on support 106000–106500 if confirmed.
Summary: Strong bullish alignment, same key supports, no panic. Risk On / Risk Off Indicator neutral, controlled market, possible whipsaw on short-term TFs but no major reversal sign.
__________________________________________________________________________________
Macro, News & On-Chain Analysis
__________________________________________________________________________________
Macro: Fed and traditional markets calm, no monetary alert. Israel/Iran ceasefire, increased volatility in Europe (Russia/Ukraine). Moderate risk-on sentiment.
Calendar: June 26: US durable goods/GDP/jobless claims (potential volatility).
On-chain: BTC range $100–110k, fundamental support $93–100k, no panic/capitulation. Low spot volumes, bullish digestion phase.
__________________________________________________________________________________
Conclusion
__________________________________________________________________________________
Dominant bias: Up/moderately bullish in short term, focus on retracement buying.
Risk management: Stop H4 < $102.7k, H1 < $106k, scalping: break of 106k with extreme volumes.
Action zones: Reinforce on $106k/$103k/$100k retrace, partial TP below 110–111k, extension if confirmed breakout.
Monitor: Volume, support reactions, macro catalysts.
Summary:
Technical and on-chain context remains bullish; best approach is tactical buying on pullback with dynamic stops. Stay agile in case of extreme selling volume or macro shocks. Act on signals, protect capital.
__________________________________________________________________________________
Multi-timeframe-analysis
NAS100 TECNICAL ANALYSIS WITH UNCLNRBZ - PART 5Nas100: Looking at the current market conditions, price is reacting from a HTF demand.
To confirm that this demand will hold, I will be looking for further LTF confirmations and breaking of structure (HH & HL). That being said, HAPPY TRADING.

NAS100 Sell IdeaConsidering that the chart is in an overall HTF bearish state and has also not yet presented us with long setups, I'm still looking for short objectives, obviously not forgetting that on a HTF, price is consolidating inside demand. One of two things can happen and I'm going to be watching price action and will update moving forward.

btcusdtHello friends
Every time I look at the chart, I see nothing but upward movement conditions
But it all depends on the weekly candle that closes tomorrow
In terms of time, we will most likely climb on January 8th
So before that there is a possibility of suffering or a slight decrease
If you look at the weekly time frame in the picture (top right) it promises to decrease to 22 thousand

NZDCAD Ascending Channel Counter-Trend StrategySTRATEGY: NZDCAD Ascending Channel Counter-Trend Strategy
DETAILS
Long Term Trend Time Frame: 1D/4H
Focus Time Frame: 4H
Entry Time Frame: 1H
Market Condition
Long Term: Downtrend (based on 1D TF/200EMA)
Short Term: Uptrend/Consolidation (based ion 1D TF/10EMA and 50EMA) inside Ascending Channel
CHART PATTERN: Ascending Channel
Area of Value (AOV)
RESISTANCE
Static: 0.85201 - 0.85075
Dynamic:
83EMA: 0.84701
100EMA: 0.85002
SUPPORT:
Static:
Minor: 0.83774 - 0.83683
Major: 0.83385 - 0.83158
Dynamic:
- 10EMA: 0.84220
- 50EMA: 0.84146
ENTRY TRIGGER(s):
1H: Bearish Engulfing
4H: NA
1D: High Momentum Candlestick going to Resistance
Entry Price (EP): 0.84759
Stop Loss (SL): 0.84953
Take Profit (TP): 0.84059
RRR: 4.02
ANALYSIS
1D - Overall trend is showing downtrend based on 1D TF - 200EMA. Heikin Ashi is still uptrend but the price is currently struggling to break above resistance level of 0.85201 - 0.85075. It is also supported by 83EMA and 100EMA which act as Dynamic Resistance.
www.tradingview.com
4H - Looking at the 4H TF, we can see that Price is moving on an Ascending Channel. Short term trend showing uptrend which is supported by Heikin Ashi. However, as stated before, the price is currently struggling to break above Static and Dynamic Resistance on a higher Timeframe (1D). We will give more weight on a higher timeframe as Smart Money focuses on this time frame.
www.tradingview.com
www.tradingview.com
1H - Our Entry Triggers are always on 1H TF. Here we see that there's a Bearish Engulfing Price Action happened on the Static Resistance AOV. This acts as our Entry Trigger.
www.tradingview.com
www.tradingview.com
OTHER ENTRY REASON(s):
High Momentum price action approaching resistance usually reverses as it has no higher highs to support its move.
ACTION ITEMS:
1. Exit/TP on Higher Timeframes: 4H or 1D
2. Scale in on Entry Timeframe (1H).
IMPORTANT:
Always move the SL on Breakeven after significant move.
Scale in as necessary and move the TP of the initial entry to the SL of new entry. This way, we will be able to Minimize risk and Maximize potential Profit.
NOTE: This post is for my reference/journal purposes only. Trade at your own risk.

USDCAD Multi-Time Frame AnalysisANALYSIS
1D: 1D Time Frame showing Downtrend. Price is approaching 50/83/100EMA which could be a potential dynamic resistance.
4H: Looking at 4H Chart it is currently on sideways approaching minor resistance.
Action Items
If price broke above minor resistance, wait for pullback then go LONG, targeting at least 1.32822.
If the price bounced or faked-out of resistance, go SHORT targeting at least 1.31357.
Note: This is my personal analysis only. Trade at your own risk.

Trading Countertrend with MultitimeframeanalysisHi guys,
today I want to show you how I trade countertrend, piecing multiple timeframes together. Keep in mind though, that generally speaking the sentence 'the trend is your friend' is always true.
However when it comes to specific timeframes one can make use of particular price movements. Such as in this case.
As you can see the EURUSD recently had a strong bullish run after forming a tripple bottom at support. The bullish run occured with little to no pullbacks on the monthly, this is the first sign for me that this pair is overextended and in need of a pullback. As most of you will know, price 'breathes' meaning it goes up and down in a waveform. Furthermore price has begun decelerating at resistance. Last month closed as a doji, showing uncertainty in the market, and this month might be closing as a hightest. Keep in mind that this is the monthly timeframe, price action patterns and signals take way longer to form, thus have mostly way more significance, than lets say the hour chart.
Going further on the weekly chart one can see how significant the resistance/support zone at which price is sitting has been in the past. 5 Rejections have occured, most of them pretty violent. Furthermore we can see that price has really moved with little to no pullbacks and is now chopping at the resistance zone. What does this mean for us as traders?
Mostly choppiness is just uncertainty in a market. To make money in this profession, we have to act as smart traders. Smart traders dont just trade when they see something closing in on a potential reversal zone, they build a portfolio for each trade and act upon their trading plan. So far what do we have?
- A overextended bullish run
- Price is sitting at resistance
- Price has formed a doji and might be forming a hightest on the monthly
- Price is also sitting in the 0.5 fib monthly level (treat fib levels like a zone)
- Choppiness on the weekly
For me personally this isn't enough to justify a trade, so lets zoom in on the daily chart.
I used the same levels and what do we see? Massive bearish MACD divergence and a h&s pattern that formed, with a slanting neckline. Now this doesnt mean that this pair will drop with 100% uncertainty, however it gives us more confluence to put into our tradingportfolio. So adding to the confluence mentioned above, we now have:
- A h&s pattern on the daily
- Daily bearish MACD divergence
To pinpoint wether price action is going to change, i also like to look at the 4h chart:
The 4hour chart confirms what we've seen on the daily. A h&s pattern with massive macd divergence. However it also tells us that the neckline of the h&s pattern still holds strong. The first indication of a potential trendchange would be a lower high at the 4h 50 EMA. However I wouldn't enter the trade until the neckline is broken and retested.
This is how I like to put together my trades. Ofcourse the are short trading opportunities which are not showing on the monthly or weekly, however it is always good to build a portfolio for each trade, look at it from different timeframes and justify your actions with confluence.
I will keep you updated and should price move in the right direction I will ofcourse also show my PT and stop placement.
Until then have a good one!

FORECAST USDJPYShort, Entry point at red trendline break.
Stop: 1 pip over the previous relative max.
Targets:
- 102.8 first target
- 102.27 sec. target
www.fxstreet.com
