Bitcoin technical analysis _ 2023-12-19Long position
After breaking the 43334 resistance
Entry: 436000
Stop Loss: 42890
Risk Free: 44312
Save profit 1:45100
Save profit 2: 45750
Save profit 3: 46440
Save profit 4: 47145
Profit limit: 48000
-----------------------------------------------------------------
Short position
After breaking the 4790 support
Entry: 40,500
Stop Loss: 41330
Risk Free: 39670
Profit limit: 38300
Multitimeframeanalysis

GMTUSDT LONG 1HTHIS IS NOT A FINANCIAL ADVICE
Conditions
1.Fibonacci level:✅
2.Bollinger band:✅
3.Momentum:✅
4.Price action:✅
5.Volume:✅
6.1h tf:✅
7.4h tf:✅
8.1d tf:✅

Bitcoin technical analysis_2023-12-12Short position
After breaking the support formed at the price of 41360
Entry 41100
The loss limit is 42200
Risk Free 40000
The profit limit is 38800

EURUSD Top-Down Analysis-BearishTaking into account that the higher timeframes dictates the price movement I started to analyze
the Monthly and Weekly chart first.
I noticed that on Monthly the order flow is Bearish and that we are right now in a Supply Zone .
On Weekly the price Changed the Structure from the big monthly Supply by liquidating a Structural Low .
Then I noted the Supply Zones in the weekly Range.
I dropped down on the 4h chart to see what the price is doing inside the weekly Supply Zone.
On 4h chart the trend is still bullish but can confirm the bearish continuation by closing below the structural low .
On the 30m chart the trend is bearish but we can take longs on 15m chart until the Supply zone on 30m is reached.
Then we will need to wait for either a confirmation that the trend will continue bearish or a change of structure to confirm the bullish continuation on 4h.

EGLDUSDT LONGTHIS IS NOT A FINANCIAL ADVICE
Conditions:
1.Fibonacci level:✅
2.Bollinger band:✅
3.Momentum:✅
4.Price action:✅
5.Volume:✅
6.1h tf:✅
7.4h tf:✅
8.1d tf:✅

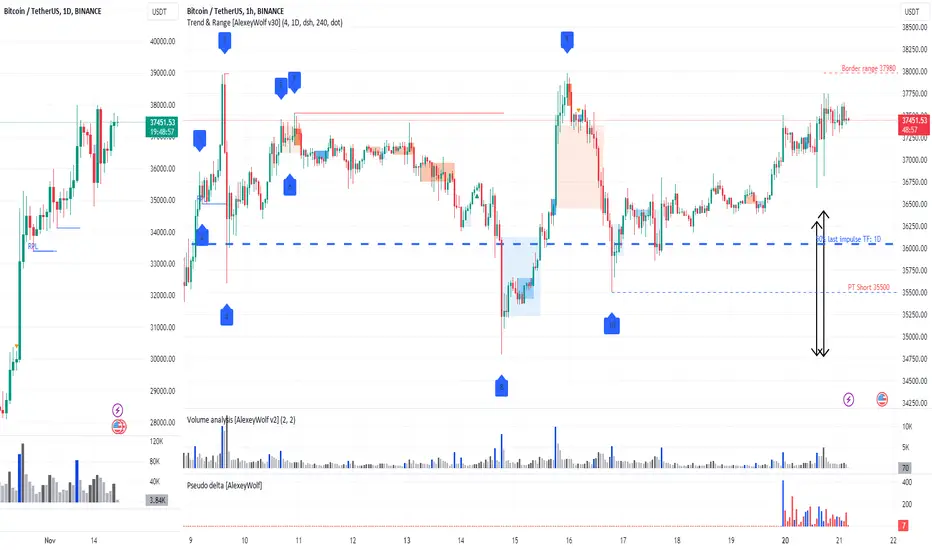
BTCUSDT. Waiting for the local high to be updated. Highlights
Waiting for the price to interact with the upper boundary of the sideways range at 37980.
Preference (buying/selling) - neutral.
Description
On the hourly timeframe, a sideways movement has been observed since November 9th. The upper boundary of the sideways range is at 37980. Judging by the wicks of yesterday's hourly candles (see chart), buyers are pushing the prices beyond the sideways range. Buying at the top of the range is not systematic. But if you really want to trade, you can aggressively look for buys when buyers defend the wicks of yesterday's hourly candles. (if the price returns there before breaking out of the sideways range).
31812, 36677 - boundaries on the five-minute timeframe
37302 - boundary on the one-minute timeframe.
BTCUSDT. Waiting for actions from buyers and sellers.Highlights
The previous scenario played out.
Awaiting actions from buyers and sellers.
Preference (buying/selling) - neutral.
Description
On the daily chart, buyers resumed from the discount zone (bottom 50%) of the last daily impulse and absorbed the seller's candle on increased volume, forming a buyer's zone (blue color, upper edge of the daily buyer zone 37337.57). This scenario was described here
On the hourly chart, the price is at the upper boundary of the range, but considering the daily context, selling immediately is risky. It is necessary to assess the actions of the seller and the buyer. If the seller breaks the level of 37337.57 and defends it, you can look for sales with the first target at 36744 (upper edge of the daily buyer zone), the second target is 36000. Conservatively look for buys if the buyer breaks the upper boundary of the range (37972.24) and defends this breakout.

BTCUSDT. Long positions are a priorityHighlights
Long entry could be considered either from buyer protection at the lower limit of the range 35600, or from the current levels, if the seller does not appear and the buyer protects his zone (upper limit - 36470) with a target of 37526.
Description
On the Daily TF, there's a long trend. On the hourly chart, there's a sideways market. The lower boundary of the sideways range is below 50% of the last daily impulse. It's interesting to see the price there and look for purchases if the buyer defends the lower boundary of the range (35600), aiming for the upper boundary of the range (37526). Long positions can also be considered from current levels if the seller doesn't protect the candle at 21:00 (exchange time) and the buyer engulfs it.

EURUSD Trade Idea for 15/NOV/2023In this video, I did a full breakdown from the weekly timeframe down to the 1h timeframe. I talked about what I'll be expecting from the market today and I also talked about why I might not trade today.
If you liked the video, please give me a boost and also follow me. Do have yourself a lovely day.

EURUSD trade idea for 14/NOV/2023This is a detailed analysis of eurusd which I started from the daily timeframe all the way down to the 1h timeframe (for the weekly timeframe analysis, visit yesterday's video on my profile). I talked about what I expect the market to do today and the levels I will be looking out for before I take any trade. If you like this kind of videos, please follow and give me a boost. Thank you.

13/NOV/2023 EURUSD ANALYSISThis is a fully detailed top down analysis on eurusd. In the video, I talked about the pair from the weekly timeframe, showing what I expect the price to do over the next week and also explaining how it relates to what I expect the price to do today. I dropped down the daily and 4h timeframes and also explained their relationship and why I expect the price to drop today. Finally, I dropped down to the 1h timeframe and talked about the levels I'm going to be watching out for before I take any trade on the pair. I also talked about what the market could do that will make this analysis become invalid.
I bet this video will be of value to you.
If you liked this video, please give me a boost. Also follow so that you can get my videos or trade ideas immediately I post them.

EURUSD TOP DOWN ANALYSIS FOR 13/NOV/2023From the daily timeframe, you can see that eurusd is in an upward channel. I will expect to see the channel last for the next few weeks because there's a possibility that the price will touch a weekly resistance zone for a retracement up above. However, the price moves in trends and made a higher high two weeks ago. Throughout last week, the price has been on a retracement move downwards and I expect the retracement to continue even lower than last week's low before the next impulse for the higher high comes.
On the 4h timeframe, we have a temporary downward channel which we expect the price to respect all the way down to 1.06500 or even lower within this week before the next move upwards again.
On the 1h timeframe, that's where I look for trading levels and from what I can see, the price is trading between 1.07000 and 1.06500. Like I already said, I expect to see the price drop so before I will take any trade, I will expect to see the price rise to the most recent resistance which is the 0.07000 level which will meet with the descending trendline resistance and act as a confluence for a possible move downwards.
In a nutshell, I will expect to see the price rise to the 0.07000 level before I start looking for selling opportunities down to last week's lows and ultimately 0.06500.
Tune in by 6:30am WAT for a video analysis on the pair.

EURUSD FORECAST 10/NOV/2023This is a detailed analysis on eurusd based off pure price action. In this video, I started my analysis from the daily timeframe and ended it on the 1h timeframe. I talked about the way the market reacted to my analysis of yesterday and how I will react to what the market will do today. I talked about the levels I'm going to be looking out for before taking a trade.
If you enjoyed this video and you would love to support me, please just follow and give me a boost, it goes a long way. Thank you very much for watching. See you in the next video.

EurUsd Trade idea for 08/Nov/2023This is a detailed multi-timefrrame analysis of eurusd where I talked about what I expect the price to do over the next few hours. It is educational and informative. I showed important levels of structures where the price was at and where I will expect the price to touch before I take a trade.

Man Industries on the verge of 17 year BOKey Levels:
Support: 130
Resistance: 240
Learning:
🚀💰 Multi-Year Stock Breakouts: Unleashing Financial Triumph! 💰🚀
1. Breaking Barriers, Igniting Prosperity: Watch stocks defy gravity as they smash through long-held resistance levels, ushering in a new era of financial success!
2. The Rise of Titans: Witness the rise of breakout stars as they conquer the charts, captivating investors with their unstoppable momentum.
3. Confidence Booster Extraordinaire: A multi-year breakout screams confidence! Feel the rush of excitement as investors flock to seize these golden opportunities.
4. From Downturn to Upturn: Say goodbye to stagnation! Experience the euphoria of trend reversal as stocks soar to new heights.
5. A Stamp of Fundamentals: Rock-solid companies are on the move! Confirming strength in the fundamentals, these breakouts mean business.
6. Trader's Paradise: Get ready to profit like never before! Traders, this is your chance to ride the wave of a lifetime.
Don't miss your ticket to financial triumph – embrace the exhilaration of multi-year stock breakouts! 📈🎉

BTCUSDT. Short and medium term analysisHi traders!
You can consider buying if the buyer protects
the hourly level of 35086.57,
the daily levels of 33390.95 and 31804.2 (associated with exiting the sideways market)
and the medium-term support level for the long-term trend at 24800.
As for selling, there is currently no context.
Take note of the 10D timeframe. After breaking out of the sideways market that lasted from January 2021 to May 2022 and initiating a short-term trend (with two waves), the price returned to the sideways range (with the lower boundary at 26700). If the buyer defends the last closed candle, then technically, the path is open to 40000, 48000, and 59000.

BITCOIN Analysis & Forecast 11.3.23 (AI Assisted)Watch the video version to see how this was generated ... your mileage may vary !!!
. . . . . . . . .
Key Statistics and Technicals:
- Bitcoin Price: $34,474.71 (A drop of $516.32 or -1.48% for the day)
- Day's Range: $34,347.89 - $34,997.81
- 52 Week Range: $15,479.25 - $60,324.21
- Volume: 94
- Average Volume (10 days): 370
- Market Cap: $673.041B
- FD Market Cap: $723.638B
Performance Metrics:
- 1 Week: +0.82%
- 1 Month: +25.57%
- 3 Months: +16.65%
- 6 Months: +19.65%
- YTD: +108.73%
- 1 Year: +70.95%
FUNDAMENTAL ANALYSIS:
News headlines reveal a mixed sentiment. On one hand, there are articles suggesting potential upside (e.g., "Bitcoin could be getting ready for a strong bull move"), while others indicate possible drawbacks (e.g., "Bitcoin price in risky territory; BTC faces "massively overvalued" stock").
The day's range, which is a difference of 654.92 USD, suggests a relatively moderate intraday volatility. Considering the 52wk range, Bitcoin is trading near its 52-week high, which can be an indicator of bullish momentum, but it also brings an increased risk of a correction or pullback.
Another critical aspect to consider is the broader macroeconomic environment.
Several news articles allude to potential regulatory changes, institutional involvement, and specific events that might influence price (e.g., "PayPal freezes Crypto kiosk after brief sell-out boom" or "Argentinian Presidential Candidate's Plan to Mine BTC Stirs Debate").
Positive Sentiment -
- "MicroStrategy gains $500 million with Bitcoin rise in Q3 2023."
- "Spot ETF 'undoubtedly' launch isn't guaranteed to sink Alts, Analysts say."
- "Bitcoin hits new ATH at $36,000 as rally seems unstoppable."
- "BTC hitting $34k could spell good news for altcoins."
- "Bitcoin's price is mostly flat as Fed holds rates steady, denies macro shift."
Negative Sentiment -
- "Is Bitcoin due a "significant" correction?"
- "ETF launch stokes fears Bitcoin and Ether trading with flash crash risks."
- "New BTC price 'breakouts see Bitcoin traders' caution lengthens to six-week."
- "Crypto volatility surges; Analysts say be ready for a drop."
- "Bitcoin's price volatility hints another increase 'On the Cards'?"
Weighting -
- Positive Sentiment: 40%
- Negative Sentiment: 60%
- Technical Indicators: Neutral with a tilt towards Strong Buy
Upside Potential -
Given the recent all-time high and positive sentiment from various news outlets, there's potential for BTC to retest its recent high at $36,000. Based on current momentum and historical performance, this could happen within the next 2-3 weeks. Probability: 60%
Downside Potential -
Considering the mixed sentiments and potential for a significant correction, BTC might see a drop towards the $32,000 - $33,000 range in the short term. This pullback might offer a buying opportunity. Probability: 40%
Misc. Observations -
Bitcoin (BTC): Currently, at $35428.53, it's up by 2.22%. Its dominance stands at 53.98%. The total market cap excluding BTC and ETH is at $368.143B.
Highest Gainers:
- Alchemy Pay / United States Dollar: +20.64%
- CELO / US Dollar: +11.06%
- Amp / United States Dollar: +8.70%
Highest Losers:
- XDC / Dollar: -3.27%
- Tezos / United States Dollar: -3.30%
- Gods Unchained / United States Dollar: -1.04%
High Volume Movers:
- Crypto Total Market Cap Exclude BTC and ETH: 88.333B
- Bitcoin / U.S. Dollar: 283.834K
- Litecoin / U.S. Dollar: 267.107K
Bitcoin remains a dominant force with more than half of the total crypto market share.
PoW cryptos such as Ethereum Classic and Horizen are seeing positive traction.
Amp, under the Currency/Remittance category, has a significant volume, making it one to watch closely.
Among investment-grade cryptos, CELO's 11.06% increase is notable, indicating increased interest or potential news driving the spike.
Contrarian Perspective:
High gains like those seen in ACH and CELO might face corrections. High gains in a short time frame can sometimes indicate overbuying, leading to potential profit-taking shortly after.
Bitcoin's dominance, while significant, means that a downturn in its price can significantly influence the entire crypto market.
. . . . . . . . .
INDICATOR SUITE:
Tesla Coil:
- len: 23.39
- 3xlen: 70.17
- len mirror: 16.61
- 3xlen mirror: -24.3
- average mirror: -5.06
- average: 34.94
Rate-of-Change (RoC):
- RoC: 32.74
- RoC + Signal Line Cross Up: 0.00
- RoC + Signal Line Cross Down: 0.00
- Various other sub-indicators including Bull, Hidden Bull, etc.
ATR + sma histogram:
- Histogram: 367.34
- ATR: 1102.50
- SMA: 735.16
OnBalanceVolume (OBV Cross):
- OnBalanceVolume: 7.579M
- Smoothing Line: 7.473M
Volume Analysis:
- Various plots ranging from 0.00 to 57892.77
HVol (dcedcow):
- Volume: 10.37K
RVol Pro:
- Value: 10.37K
Range Analysis - By Leviathan:
- VWAP: 27830.88
ADP:
- Primary ADP: 73
- Secondary ADP: 71
- Primary Signal Line: 71
- Secondary Signal Line: 68
Discretionary Weightings: Given the information and its relevance to Volume Spread Analysis (VSA) and Volatility …
- OnBalanceVolume (OBV): High importance. OBV measures the positive and negative flow of volume in a security relative to its price.
- ATR: High importance. Captures an asset's volatility.
- RoC: Medium importance. Measures the percentage change in price from one period to the next.
- Tesla Coil: Low to medium. Provides multiple layers of data related to price action.
Technical Analysis of Indicators:
- Tesla Coil: The chart seems to be in a consolidation phase, with the coil suggesting a possible breakout soon.
- Rate of Change: The ROC is relatively stable. This stability may suggest that the prevailing trend, be it bullish or bearish, is likely to continue.
- Average True Range: The ATR has remained consistent, suggesting that the current level of volatility is sustained. A higher ATR suggests increasing volatility, which might mean Bitcoin is experiencing significant price swings.
- On-Balance Volume (OBV): OBV indicates net buying/selling pressure. A declining OBV hints at a potential trend reversal, as volume precedes price. The OBV value is quite close to its smoothing line, indicating a balanced sentiment in the market.
- Time-Segmented Volume: This appears to be more bullish, suggesting institutional buying.
- Volume Spread: We see periods of high volume spread, indicating strong buying and selling forces.
- Accumulation/Distribution: The line suggests more distribution than accumulation recently, a potential bearish signal.
Price Projection: Given the current trend and indicators …
- Upside Potential: BTC could test its recent ATH at $36,000. Based on current momentum and external factors like institutional involvement, there's a 60% probability of reaching $36,500 within the next 2-3 weeks.
- Downside Risk: Considering negative news sentiment and potential regulatory challenges, BTC might face support at around $32,000. If this support breaks, we could see a further decline to $30,000 with a 40% probability over the next month.
Insights & Actionable Suggestions:
- Volatility & Volume: The ATR of 1102.50 indicates a high level of volatility for BTC in its daily price movement. The current volume is below its 10-day average, suggesting lower trading activity.
- RoC Indication: A positive RoC of 32.74 suggests the price momentum is currently bullish.
- OBV Insight: The OnBalanceVolume is slightly higher than its smoothing line, indicating that volume on up days is generally outpacing volume on down days. This can be a bullish sign.
- Performance Metrics: BTC has seen a robust performance YTD with a growth of 108.73%. It's essential to note that despite short-term fluctuations, the long-term trend over the past year has been bullish.
Visual Representation: For a visual, consider plotting the mentioned levels on your chart -
- Support at $32,000 (red line)
- Resistance or next target at $36,500 (green line)
- Current price at $34,522.66 (blue line)
- Potential zones of interest (in a shaded region) between the support and resistance.
Additional Indicator Suggestion: Considering the current market conditions and to get a better understanding of the underlying trend strength, I'd suggest incorporating the Directional Movement Index (DMI). DMI can help ascertain if the trend is strong or weak, and when used with the ADX line, it can further validate the strength of bullish or bearish sentiments. This could be pivotal in the given circumstances where the market appears to be at an inflection point.
Lastly, given the data at hand, what are your thoughts on the potential for Market Makers or institutions manipulating the current BTC price, especially considering the evident bullish sentiment? Do you believe there might be an underlying play to hunt for retail liquidity?
. . . . . . . . .
PRICE ACTION ANALYSIS (1D):
Initial Observations:
- Volume Profile: The chart showcases a fixed range volume profile to the left. The Point of Control (POC) - the price level with the most traded volume - is clearly visible around the 24848.00 mark.
- Volume-at-Time Histogram: There’s a significant volume spike around the range of $18000-$21000, indicating a possible support level or accumulation zone.
- Accumulation/Distribution & Time-Segmented Volume: The accumulation/distribution line is gradually inclining upwards, suggesting a net inflow of volume or accumulation. The time-segmented volume also points towards a bullish sentiment.
- Tesla Coil & Average True Range (ATR): The Tesla Coil's movement seems relatively stable. ATR, representing volatility, is increasing, suggesting possible strong price movements in the near term.
- Price Action: The recent price action exhibits a bullish momentum, breaking through a significant resistance level.
VSA-Derived Forecast:
- The strong accumulation and high traded volume at lower price levels hint at a bullish sentiment among traders. Institutions or market makers seem to have absorbed selling pressure around the $18000-$21000 range.
- The upward trend in accumulation/distribution points towards a continued bullish trend.
- Given the elevated ATR, expect larger price swings, both up and down, in the coming days.
Reconciliation with 1D Price Chart:
- The price is currently moving within an upward channel. Its recent breakout indicates a potential continuation of the bullish trend.
- While the price is approaching a Fibonacci level, considering the strong volume and accumulation signs, it's likely to test the next Fibonacci level upwards.
- The intersection of the VWAP at 24848.00 with the POC can act as a significant support level in the event of a pullback.
Improved Forecast:
Upside Potential: Given the strong bullish sentiment from both VSA and price action, expect Bitcoin to test the 0.236 Fibonacci level in the near term, which could act as a minor resistance. On breaking this, it could move towards the 0 level.
- Entry Point: Current level or on a minor pullback to the recent breakout zone.
- Stop Loss: Just below the VWAP at around 24000.
- Profit Target: 0.236 Fibonacci level as the first target and 0 level as the next target.
- Risk:Reward: Approximately 1:3, given the distance between the current price and the stop loss compared to the potential upside.
- Time Horizon: 2-4 weeks.
- Probability: 70% for reaching the 0.236 level, 50% for reaching the 0 level.
Downside Potential: If there's a reversal, expect Bitcoin to find strong support around the VWAP (24848.00) due to the volume profile.
- Entry Point: If the price fails to maintain the breakout level.
- Stop Loss: Above the recent high.
- Profit Target: 24848.00.
- Risk:Reward: Approximately 1:2.5.
- Time Horizon: 2-3 weeks.
- Probability: 30% given the current bullish sentiment.
. . . . . . . . .
PRICE ACTION ANALYSIS (1W):
The 1W (weekly) chart provides a wider perspective and thus offers a broader context to the previous 1D (daily) view. Here's a detailed analysis:
1. Price Action Analysis:
- Fibonacci levels: On this broader scale, we observe Bitcoin's price respecting various Fibonacci levels, notably the 0.236 and 0.618.
- Structure: The significant pullback after the previous bullish run suggests a possible correction or consolidation phase.
2. Volume Spread Analysis (VSA):
- Volume-at-Time histograms: There's a clear Point-of-Control (POC) around the $27,650 level, indicating it's a key price point where a significant amount of trading has taken place.
- Accumulation/Distribution: The accumulation phase seems prominent before the surge that occurred around late 2020, suggesting institutional involvement. Post-2020, we see a distribution phase followed by a consolidation pattern.
- On Balance Volume: This shows that the volume is moving with the trend. The current trajectory indicates possible accumulation.
3. Volatility:
- Tesla Coil: Notably calmer, implying reduced volatility on the longer time frame.
- Average True Range (ATR): Volatility seems to be tapering off from previous highs. This reduction in volatility on a weekly chart could imply a significant move is brewing.
4. Trend Exhaustion:
- We're witnessing signs of consolidation post the previous rally. The intersecting points of the VWAP and other tools can provide potential points of volatility, which we should monitor closely.
Given this wider perspective:
Upside Potential: The break above the VWAP around $27,650 and stabilizing above the 0.236 Fibonacci level suggests potential for upside momentum. A break above recent highs could target the next Fibonacci level at 0.618.
- Entry: Around the current price level.
- Stop Loss: Below the 0.236 Fibonacci level.
- Profit Target: Just below the 0.618 Fibonacci.
- Risk:Reward: Approximately 1:2.5.
- Time Horizon: 3-6 months.
- Probability: 60%.
Downside Potential: If Bitcoin's price fails to sustain above the VWAP and breaks below the 0.236 Fibonacci level, we could see a further decline towards the lower Fibonacci levels.
- Entry: On confirmed break below 0.236 Fibonacci.
- Stop Loss: Above recent swing high.
- Profit Target: Next Fibonacci level below.
- Risk:Reward: Approximately 1:2.
- Time Horizon: 2-4 months.
- Probability: 40%.
Additional Indicator Suggestion: Given the importance of trend direction in this scenario, consider integrating the Parabolic SAR (Stop and Reverse) for this timeframe. The Parabolic SAR can provide dynamic entry and exit points and can be particularly useful in trending markets.
. . . . . . . . .
PRICE ACTION ANALYSIS (1h):
Volume Spread Analysis (VSA):
- Volume Profile: A prominent high volume node appears around $33,000, indicating a strong support level. The Point-of-Control (POC) is visibly marked and rests just above this.
- Time-Segmented Volume: There's a noticeable surge in volume during the rapid price ascent, followed by a decline, suggesting a possible buying exhaustion.
Volatility:
- Tesla Coil: Relative stability is observed with slight periodic spikes, indicating contained volatility.
- Average True Range (ATR): No drastic peaks, which suggests that the price movement remains within a typical range for the time being.
Trend Exhaustion:
- The price is approaching the upper Fibonacci level (0.236). Should it break, we might expect a rally towards the next Fibonacci level (0.382). However, the consistent touch-points without breakthrough hint at resistance.
- The VWAP (Volume Weighted Average Price) sits below the current price, suggesting the asset is trading at a premium.
Indicators:
- On Balance Volume (OBV): Displays an uptrend, suggesting buying pressure. However, the recent flattening can be a sign of a possible decline in this momentum.
- Volume Spread: The lack of prominent bearish bars with increased volume indicates that selling pressure isn't dominant.
Forecast & Trading Strategy:
-Short-Term Bullish Scenario (60% probability):
- Entry: $34,200
- Stop Loss: $33,400 (near the high volume node for support)
- Profit Target: $35,500 (approaching the 0.236 Fibonacci level)
- Risk:Reward: 1:2.6
- Time Horizon: 24-48 hours.
-Short-Term Bearish Scenario (40% probability):
- Entry: $33,800 upon breaking below the support.
- Stop Loss: $34,200
- Profit Target: $33,000 (next volume node)
- Risk:Reward: 1:2
- Time Horizon: 24-48 hours.
Session-Based Volatility:Considering typical crypto market behavior, anticipate increased volatility during the overlap of the Asian and European sessions and the opening of the New York session.
Trading windows:
- Asian-European Overlap: 6:00-9:00 UTC
- New York Session Opening: 13:00-15:00 UTC
Questions:
- Are there any macroeconomic events or news catalysts anticipated which might influence BTC's price action during our forecasted horizon?
- Considering your strategy revolves around Market Makers and institutional manipulation, have you noticed any recent patterns or behaviors in other assets that might indicate a larger play in Bitcoin?
. . . . . . . . .
PRICE ACTION ANALYSIS (15m):
Price Action: The recent sharp decline indicates a strong bearish momentum, though the price has started consolidating within the $33,800 to $34,600 range. This consolidation is a good sign, showing that the decline might be temporary, or at least, we might experience some sideways movement for a while.
Volume Spread Analysis (VSA):
- We can spot a series of high volume spikes during price declines, indicating potential buying pressure or accumulation. The high volume during the decline around the 29th and subsequent upward movement confirms a potential bullish outlook.
- The Point of Control (POC) shown appears to be a significant support level where most trading has occurred. Prices tend to gravitate towards the POC, so this can be a potential target in retracement scenarios.
Indicators:
- Tesla Coil: Shows signs of potential volatility with multiple peaks, but currently, it's maintaining stability, hinting that the current volatility is diminishing and suggesting we might be entering a phase of price consolidation.
- Rate of Change (ROC): It's fluctuating around the 0 line, signaling a probable shift in momentum. However, the current consolidation means a lack of directional bias.
- Average True Range (ATR): Seems to be decreasing, aligning with the Tesla Coil's inference.
- On-Balance Volume (OBV): A mild decline is noticed, hinting that selling volume has been slightly overpowering buying volume, but not decisively so.
- Time-Segmented Volume: The chart indicates more buying during certain periods, suggesting institutional interest at these levels.
- Volume Spread: Shows accumulation rather than distribution, reinforcing the bullish bias.
- Accumulation/Distribution: Displays a divergence. Even though the price made a lower low, the A/D made a higher low, suggesting underlying buying pressure. This could suggest potential upside if this trend continues.
Harmonic Patterns: There's a completion of a bullish harmonic pattern (potential Gartley or Bat) with the price touching the 0.786 retracement level and bouncing back, reinforcing a potential bullish move. Several harmonics appear to have reached completion, suggesting potential reversal zones. The intersection of these patterns with session-based volatility peaks can give ideal entry and exit points.
Session-based Volatility:
- It's evident that the price experiences heightened volatility during the overlap of the Asian (Tokyo) and European (London) sessions, and similarly, during the overlap of the European and American (New York) sessions. This suggests two potential windows for scalping opportunities: One shortly after the Tokyo open (when European traders are still active) and another after the London open (when American traders enter the fray).
Forecast and Trading Windows:
- Short-Term Bullish Bias: The recent bounce from the 0.786 level suggests a move towards the 0.382 and 0.236 levels as immediate targets. For scalping, consider long entries on pullbacks near significant support zones, like the POC or the lower boundary of the pitchfork.
Entry Point: Around $34,600 (near POC)
Stop Loss: $34,400 (below the recent swing low)
Profit Target 1: $34,800 (0.382 level)
Profit Target 2: $35,000 (0.236 level)
Risk:Reward: Approximately 1:2 and 1:4 for the two targets, respectively.
Time Horizon: Given it's a 15m chart, this strategy might play out in the next 12-36 hours.
Probability: Medium-High. Multiple indicators and VSA align with this bullish outlook, but always be prepared for unexpected events, especially in the crypto space.
Enhancements based on the 15m chart:
- The shorter timeframe provides a granular view of price movements and allows for precise identification of entry and exit points.
- The session-based volatility observed aligns with typical forex market behaviors and can be used strategically for scalping.
Forecast: Given the indicators and chart patterns, there's a probable upside potential in the short term. The price might test the $34,600 resistance before determining its next move.
Trade Recommendations:
- Long Position:
- Entry: Around $34,100 (after confirming the breakout of consolidation)
- Stop Loss: $33,700 (below the 0.786 Fibonacci level)
- Profit Target: $34,600
- Risk:Reward ratio: Approx. 1:2
- Time Horizon: 24-48 hours (given the 15m timeframe)
- Probability: ~60% (based on current indicators and patterns)
Contrarian Perspective: While multiple signs point to a short-term bullish move, it's crucial to consider the flip side. The price could reject the upper boundaries of the pitchfork, and a decrease in volume could indicate fading buyer interest. A clear break below the POC might negate the bullish outlook.
Remember to adjust positions based on real-time data, especially during high volatility sessions. Your thoughts?
. . . . . . . . .
Trade Ideas:
1D Chart - Swing Trading
The fixed range volume profile indicates substantial support in the vicinity of $32,500, making it an optimal region for establishing a position. The VWAP, marked at $24,848.00, acts as a historical average price, and the current price is well above this level, showing bullish sentiment. The intersection of Fibonacci levels with price action is noteworthy, especially around the 0.236 region. Accumulation/Distribution indicates a strong buying pressure, and the Tesla Coil along with Average True Range confirms the present volatility.
-Optimal Long Position:
- Entry Point: $34,400 (nearest to the day's low with support indicated by the volume profile).
- Stop Loss: $33,500 (just below daily ATR value, providing a buffer).
- Profit Target: $36,000 (near the 52-week range midpoint).
- Risk:Reward Ratio: 1:3.
- Time Horizon: 2-3 weeks.
- Probability: 65%.
Short Position: Though the current trend is bullish, potential trend exhaustion can be anticipated by observing the Price Action with Fibonacci channels and overlapping Pitchforks. The region above $36,000 might act as a strong resistance given the proximity to the 52-week high and the subsequent volume gap.
-Optimal Short Position:
- Entry Point: If Bitcoin drops below $34,200.
- Stop Loss: $34,700 (considering day's high).
- Profit Target: $32,500 (slightly above the ATR's lower range).
- Risk:Reward Ratio: 1:3.5.
- Time Horizon: 1-2 weeks.
- Probability: 35%.
. . . . . . . . .
1h Chart (and below) - Scalping
- Long Position:
- Entry Point: A buy order slightly above the recent consolidation zone, around $33,200.
- Stop Loss: $31,500 (Just below the Point of Control).
- Profit Target: The first target is at the next volume void around $34,700. A secondary target, if momentum persists, is at $36,500.
- Risk:Reward Ratio: For the first target, the risk:reward is roughly 1:3. For the secondary target, it's approximately 1:6.5.
- Time Horizon: Given the 1-hour chart, anticipate this trade to play out in the next 12-48 hours.
- Probability: Estimating a 65% chance of reaching the first target and a 40% chance of hitting the secondary target, given current consolidation and volume analysis.
. . . . . . . . .

Bitcoin technical analysis - new update _ 2023-10-31
Long position
After breaking the box ceiling at 34820 resistance
Entry 35050
The loss limit is 34,500
Risk Free 35600
First save profit 36150
The second save profit is 36,700
The third save profit is 37255
Profit limit 37,600
-----------------------------------------------------
Short position
After breaking the box floor in the support of 33586
Entry 33395
The loss limit is 339000
Risk Free 32890
The first save is 32385
The second saving profit is 31,800
Profit limit is 31500

GBPNZD No sleeping tonight! Big Multi Timeframe Drop!Not sure what this looks like to you, but this will be my 5th Massive multitime frame synched drop. It happens rarely, I could probably find one every week if I dug deep but finding then by accident is so much sweeter. I tracked one of these dropping for 5 days one time. It was like watching a nuclear warhead drop! I called it the finger of GOD. RED candle just dropping straight down. Its already moving on the hour.. The way this will work is that it might pull back to mean and ever 3rd or 4th time it might go to the top BB and then drop again. The smaller time frames will dump then the next largest and so on and so forth. If you look at the higher timeframes you will see a pattern. The weekly is stuck in the up position in the middle of the W . The Daily has already came down and it is what the weekly will look like when this is done. The 4hr just finised the W at the top of the move. Not the much larger one like the Daily. The hour is already finished the W at the top and is about to drop to help the larger timeframes catch up on the move. This will most likely bounce between $2.00 and $2.10 until the Weekly is done with the middle part of the W. Then it will go back up to make the last leg of the W.
When that is finished it will set up to DUMP this might take weeks to finish but you have a move here to play over and over til it does.
by iCantw84it
10.29.23
p.s. started my trade as I was typing this its already up to $300.

S&P 500 Index. Is it time to short?On the weekly chart, there was a sideways movement from May 2022 to June 2023. It had a breakout with an upward trend (two impulses). The price returned to this sideways range six weeks ago. For the past four weeks, it has been hovering near the upper boundary of the sideways range, unable to close any weekly candles above it. There's a high probability that the price will test the lower boundary of the range at 3636. I made this note a week ago; it's time to update the forecast.
On the weekly chart, there are two seller candles on increased volume, which created a seller interest zone with the lower boundary at 4204.3. The most recent weekly candle closed within the historical weekly buyer interest zone with the upper boundary at 4141.8 (historical zones typically don't result in strong reversals). It is possible that the buyer will return from the zone and test the current seller’s zone with the lower border of 4204.3.
On the daily chart, the price broke below the lower boundary of the daily sideways range with increased volume. The lower boundary of the daily sideways range coincides with the lower boundary of the current seller interest zone on the weekly timeframe (4204.3), which the buyers haven't yet tested on the daily timeframe.
Pay attention to how the sellers closed the daily candle on October 26, 2023. They approached the historical buyer zone and waited for a buyer resurgence. On October 27, 2023, buyers attempted to make a comeback (as seen in the wick of the candle) from this historical weekly zone. However, sellers effortlessly prevailed over buyers on falling volume.
There was no buyer at the lower boundary of the daily sideways range, and currently, there is still no buyer.
Sales can be sought from the current seller's zone, including protection by the buyer at the level of 4204.3 or from the candle on 26.10.23. The target is 3696.2. The first obstacle for the short position might be the 50% of the latest weekly momentum.
As for buying, there's no context for it at the moment.
Good luck with your trading!
Disclaimer:
This case study is for educational purposes only and does not constitute investment advice or recommendations.
The trading or investment ideas presented here are for illustrative purposes only and are an integral part of a case study demonstrating the concepts of using volume to analyze or trade within the market scenarios discussed.

MSFT. Forecast especially for my beloved brotherEspecially for my beloved brother, who likes Microsoft (MSFT) stocks.
On the weekly chart, we have a sideways pattern. The price has played out vector 10-11 and is currently forming a bearish vector 11-12 within the sideways range.
The daily chart also shows a sideways pattern. The bearish vector 9-10 has been technically played out. However, a significant selling zone has formed almost throughout the sideways range, triggered by the candle on 25.10.23, which incidentally had the highest trading volume in the last 3 months. The zone was tested by the candle on 27.10.23, The seller resumed from the zone, as indicated by the candle's wick.
The most likely scenario is for the price to break out of the daily sideways range to the downside (lower boundary at 324.39), protect this breakout, and play out the bearish vector of the weekly sideways pattern.
Targets for short positions:
309.5 - the lower boundary of the weekly sideways pattern.
295 - the extremum pierced by the candle on April 24, 2023.
275 - the buyer's zone at the lower boundary of the monthly sideways pattern.
If a buyer emerges at the lower boundary of the weekly sideways range, targets 2 and 3 may become irrelevant.
Good luck with your trading!
Disclaimer:
This case study is for educational purposes only and does not constitute investment advice or recommendations.
The trading or investment ideas presented here are for illustrative purposes only and are an integral part of a case study demonstrating the concepts of using volume to analyze or trade within the market scenarios discussed.

Bitcoin technical analysis _ 2023-10-26
Long position
After breaking the resistance at the price of 24851
Entry 35170
The loss limit is 34,200
Risk Free 36145
Saving profit 37110
Profit limit 37645
-----------------------------------------------------
Short position
After breaking the upcoming support and breaking the short-term uptrend line and also after breaking the important support at the price of 33645
Entry 33355
The loss limit is 34,200
Risk Free 32512
Profit limit is 31600

Bitcoin technical analysis _ 2023-10-18Short position
After breaking the newly formed bottom box and the midline of the ascending channel, and also after breaking the important support at the price of 27,930
Entry 27860
The loss limit is 28,190
Risk Free 27525
(moving the stop to the entry point after breaking 27463)
Saving profit 27200
(Moving stop to risk to reward 1 if it reaches 27150)
Profit limit 26930
