short it : NZDUSD Hello, traders. The support and resistance level of 0.620 may soon be reached by the New Zealand dollar, which is currently going through a correction phase. The trend is downward at the moment. Throughout this trading week and the one after it, we'll keep an eye on NZDUSD in case a selling opportunity appears at the 0.620 zone. We've launched a short position to meet with money and risk management standards, and we'll add more in the zone.
Daily chart
Weekly Chart
Multitimeframeanalysis

Retest and bounce along ascending trend line | LONG BiasDaily Chart
Matic BINANCE:MATICUSDT has downing to support zones around 0.7135
Chart 4H TF
Matic's in descending channel and under descending trend line that is resistance when BINANCE:MATICUSDT bounced from support (0.7135)
I expect MATIC will go up to around 0.739
Time will tell

Bounce from the support | Long BiasDaily Chart
FX:EURUSD bounced from the support
Chart 1H TF
FX:EURUSD soared very strong and now it's pulling back the support around 1.098x
Wait for buy order at this level

Has Broken Out and Wait a Retest | Profitable 30%Daily Chart:
FileCoin BINANCE:FILUSDT has broken out Descending Trendline and need a confirmation after Retest.
FileCoin has a support around $4.25
I expect price will bounced from Support and join to Long Position
Wait and see

SILVER / XAG - WILL WE SEE A CORRECTION AFTER ALL?My analysis today deals with how the further course of our most popular precious metal "SILVER / XAG" could look.
> The technical analysis and selected indicators, confirm the thesis of an imminent correction.
= Why, that I explain after the introduction.
The DXY / USD has a non-negligible impact on GOLD / SILVER, as the whole economy depends on its behavior.
> Meanwhile, this seems to take run-up, for a final upswing, which could bring the precious metal under massive selling pressure.
> Regardless of these selling pressures coming from the USD, SILVER has been somewhat caught at a very strong resistance, which foreshadows a falling price.
In the following, the analysis goes into detail, so that the significant levels and areas are known to you.
For this purpose, I have performed a "MULTI-TIME-FRAME" analysis, which refers to the higher time units (month & week) and thus makes the big picture visible.
Normally all time units below "1h" are called noise, but even a - 1h-4h - analysis is of no use to you, if the knowledge about the big and whole is missing.
> We traders know that no one can predict the future and that is exactly why you have to be prepared for all initial situations.
> If the DXY should rise again, that means "BLOOD" for the traditional and crypto markets.
> This creates dangers, but also opportunities - it is important to look at the big picture.
> Which levels are RELEVANT, I have explained in detail in the following pages.
Table of contents
1st part = INTRODUCTION
2nd part = TECHNICAL ANALYSIS
= Monthly - Time frame
= Weekly - Time frame
3rd part = CONCLUSION
PART ONE
"INTRODUCTION"
After "XAG/USD" formed a top at USD 50 in April|2011, a strong sell-off has been unleashed thereafter.
> This sell-off extended 9-years to the market peak of the Corona crisis, where we formed our current existing low.
> After this significant low of 11.64 USD (level last seen in 2009), investor fear subsided and a massive 159% buy-in, to over 30 USD, happened.
> Since this very extreme upward movement, the price corrected a little to compensate for this extreme.
> In recent weeks, we have seen a very strong upward movement, which I believe is on the verge of a correction.
= We are at the upper resistance line of a downtrend channel, which has been respected by the price since the top was formed.
= The significant Fibonacci level of 0.618 (of the downward movement so far) was reached and tried to be broken twice without success.
= The "DAILY" - MACD + RSI - both show divergences, which further strengthens the correction thesis.
> Once you look at the DXY (USD index) at the higher time levels, the further sell-off in the Traditional Markets becomes even more likely.
(My DXY analysis is linked below this post, for confirmation purposes).
SECOND PART
TECHNICAL ANALYSIS
For the analysis of the higher time levels, I proceed according to the onion-skin principle.
> MONTH - level > WEEK - level > DAY - level
These are divided into
> SUMMARY > CHARTS
The charts are presented in logarithmic scaling, as the given information can be visually presented in a more harmonious way.
(This also refers to Fibonacci levels.)
1st MONTH – Time frame
SUMMARY
The trend channel shown in the chart, in turquoise, was formed since 1971 and has been able to maintain itself as a legitimate trend channel since then. Its mid-trend line showed reactions when confronted and was respected by the market.
> The price is in the area below the mid-trend line and had challenged it over the last few months.
The trend channel shown in the chart, purple, formed since September|2020 and directed the downward movement since then.
> The price is at the upper end of the channel and already shows weakness, which could end in a further sell-off in the channel.
The trend lines drawn in the chart, in gold, formed in the 70s and turned out to be extremely good resistance or support areas.
> The price bounced twice in the recent upward movement and is meanwhile moving towards the lower trendline.
If we go into more detail about the "SUPPLY & DEMAND" zones, you can look at two "DEMAND" + "SUPPLY" zones on the chart.
> The "DEMAND" zone 1, is WEAK = followed a weak movement.
> The "DEMAND" zone 2, is VERY STRONG = followed a strong movement + has not yet been tested by the price.
> The "SUPPLY" zone 1, is WEAK = followed a weak movement.
> The "SUPPLY" zone 2, is MEDIUM STRONG = followed a weak movement, but has already been tested twice.
The Fibonacci retracements should serve us as additional confirmation and have been taken into account in past movements (last decades).
> FIB 1 | will serve as resistance should the price attempt another run up.
> FIB 2 | are the possible targets, which would be feasible in case of a successful breakout.
> FIB 3 | are the final resistance areas, which stand before a new rally.
> FIB 4 | are the support areas, for a possible sell-off.
> FIB 5 | are the support areas, for a very strong unexpected sell-off.
Past highs and lows usually serve as resistance/support, one of which we have.
> ALL TIME HIGH | 2011
> HIGHER HIGH | 2021 - Bullish Market Structure = Beginning
> HIGHER LOW | 2022 - Bullish Market Structure = Confirmation
Some levels of interest are in front of us, which in the last months + years, played a strong role for the market.
> The most relevant at the moment - POI (24.25 USD) - represents an important mark already since the year 1980 and thus currently occupies a very strong resistance role.
> The other POIs are by no means negligible and will play a role in the price development in the coming days, weeks and months. (Therefore, take your time and transfer the ones that are relevant for you into your chart).
OVERVIEW
CURRENT RELEVANT
CHARTS
XAG - Overall picture without POIs + without FIBONACCI .
XAG - Overall picture without POIs
XAG - Overall picture without FIBONACCI
ATTENTION
In the following time levels, I will only deal with the NEW, added elements. .
2nd WEEK – Time frame
SUMMARY
Besides the already mentioned trend channel + trend lines, more trend lines become visible.
- These have led to reactions in the chart in the past and should therefore be kept in mind.
The monthly "SUPPLY & DEMAND" zones are joined by others from the weekly view that coincide with other resistance / support elements.
> The "DEMAND" zone 1, is VERY STRONG = followed a Strong move + has not been tested by the price so far.
> The "DEMAND" zones 2+3, are MEDIUM STRONG = followed a strong move + combination with monthly demand zone.
> The "SUPPLY" zones 1+2+3, are WEAK = followed a Weak movement.
+ Zone 1 covered by weak monthly supply zone
+ Zone 2 has no cover by monthly supply zone
+ Zone 3 is already too old to be a relevant zone. Nevertheless, keep in mind for possible intraday price action.
> The "SUPPLY" zones 4+5, are VERY STRONG = followed a very strong move + they defend the past "all-time-high".
As further Fibonacci additions we have two more elements:
> Both newly drawn elements refer to a possible downward movement.
CHARTS
XAG - Overall picture
XAG - Overall picture without FIBONACCI
THIRD PART
CONCLUSION
"Silver: The gold of the little man "
Why this saying could change in the next years / decades, you will learn in a future post from me.
> Invest in physical silver (via investment coins = for example - Maple Leaf) that could change your life in the future and belongs in any portfolio.
In summary, based on technical analysis, there are strong reasons for SILVER price to fall.
> Since the price top in Jan|2021 - the monthly candles were dominated by bearish.
> A possible breakout of resistance elements is not impossible, but highly unlikely.
> The divergences in the daily RSI + MACD, suggest a bearish sell-off.
For this reason, I assume a weak SILVER exchange rate and a strong USD and an accompanying bloodbath in the traditional and crypto markets.
> Positioning after confirmation of this thesis = SHORT .
If this idea and explanation has added value to you, I would be very happy to receive an evaluation of the idea.
Thank you and happy trading!
ZIEL IST DIE AUTARKIE | THE GOAL IS SELF-SUFFICIENCY

USD - IS IT KEEPING THE UPPER HAND AFTER ALL?My today's analysis deals with the fact that it could coming to an end with the correcting, and a further rise in the DXY is in front of us.
> We traders know that no one can predict the future and that is exactly why you have to be prepared for all initial situations.
> If the DXY should rise again, it means "BLOOD" for the traditional and crypto markets.
> This creates dangers, but also opportunities - it is important to look at the big picture.
> Which levels are RELEVANT; I have explained in detail in the following pages.
TABLE OF CONTENTS
- 1. Part = DXY EXPLANATION
- 2. Part = TECHNICAL ANALYSIS
= Monthly - Time frame
= Weekly - Time frame
= Daily - Time frame
- 3. Part = CONCLUSION
FIRST PART
“INTRODUCTION“
The "DXY" indicator entered on September 28 of this year,
the first time since May 2021, in a downward correction.
> On this day, I published an analysis, which dealt with a possible top in the DXY.
> This forecast turned out to be a precision landing on the day and is to till now the TOP.
(My analysis is linked below this post, for confirmation purposes.)
To help you understand the relevance of the "DXY Index", let's take a closer look at it.
The U.S. Dollar Index (DXY) is a ratio (index) that compares the value of the U.S. dollar using a basket of six currencies.
> EUR = 57,6 %
> JPY = 13,6 %
> GBP = 11,9 %
> CAD = 9,1 %
> SEK = 4,2 %
> CHF = 3,6 %
EXPLANATION
DXY > RISE
One of the currency pairs falls > Pressure on other currency pairs increases = Chain reaction = All currency pairs fall
DXY < FALL
One of the currency pairs rise > Pressure on other currency pairs decreases = Chain reaction = All currency pairs rise
So if you interpret the DXY correctly, you can get confirmation for ideas in other related currency pairs.
SECOND PART
TECHNICAL ANALYSIS
For the analysis of the higher time levels I proceed according to the onion-skin principle.
> MONTHLY - Level > WEEKLY - Level > DAILY - Level
These are divided into
> SUMMARY > CHARTS
1. MONTHLY – TIME FRAME
SUMMARY
The trend channel shown in the chart formed in May|2011 and has since maintained its position as a legitimate trend channel. Especially its mid-trend line showed many reactions and great interest of the market.
> The price has reached this middle line and has already reacted positively.
> The trend arc is another bullish signal and could serve as additional resistance in the future.
If we look more closely at the "DEMAND" zone, we see that it has already been tested on.
> The monthly candle closed above the zone, which is another positive indicator.
> If we get another rise in the DXY, the marked "SUPPLY" zone, will serve as a very strong resistance and will be a real challenge.
The Fibonacci retracement should serve us as an additional confirmation, and was taken under proof in past movements (last decades).
> The 0.328 level, was breached without another reaction at this time level and the monthly candle closed below it.
> Still pending is the next 0.50 level, which in combination with several arguments, represents a Medium-Strong resistance.
> In the absence of a reaction from this level, we will see another sell-off to the 0.618 level.
Past highs usually serve as resistance, of which we have two.
> HIGH | 01/17 - Already showed a reaction
> HIGH | 03/20 - Reaction still pending
Points and levels of interest are available to us, which have a not irrelevant duration.
> The most significant resistance is the marked POI ZONE (turquoise), with 50 years of experience.
> We can be sure that there is great interest in this one.
> This already proved true with a first reaction, but we must continue to wait for the candle close to confirm the argument.
> If this is "temporarily" broken by a panic in the market, the POI at 102,000 points, serves as the next point of contact.
CHARTS
DXY – Overall picture
DXY – Trendlines
DXY – Supply & Demand ZONES + Market-Structure-Break
DXY – Fibonacci + POI
ATTENTION
In the following time levels, I will only deal with the NEW, added elements.
2. WEEKLY – TIMEFRAME
SUMMARY
Besides the already mentioned trend channel, another one is now visible (violet), which was formed in May|2021.
> Regardless of its inconspicuousness, it supports the tenor of the thesis.
> It was respected and must prove itself again in the coming days and weeks.
The additional "SUPPLY&DEMAND" zones join the two existing ones and remain untouched.
As further Fibonacci additions we have:
> A 1.618 level which was almost touched but is still pending to be worked off.
> A 0.786 level which has been able to defend the last two weekly closes.
> A 0.88 level, which in combination with the pending MSB, represents a strong resistance.
CHARTS
DXY – Overall picture
DXY – Overall picture + Monthly
DXY – Trendlines
DXY – Supply & Demand ZONES + Market-Structure-Break
DXY – Fibonacci + POI
ATTENTION
In the following time levels, I will only deal with the NEW, added elements.
2. DAILY – TIMEFRAME
SUMMARY
In the chart, further trend lines are drawn, which have shown reactions in the last 4 months.
> These will represent resistances for a possible upward movement.
Because so many elements are drawn in the chart, I would advise you to look again at the chart below, where you see only the S&D zones.
> Some close together with the higher time levels, which reinforces their - resistance/support.
CAUTION (Paler Zones)
> The Supply zone, has been touched before and thus has less resistance.
> The Demand zone, has been breached and thus should not trigger a major reaction, however it could still be "recaptured".
In order to be able to forecast possible target ranges, we would first have to reach the bottom, which has yet to form.
> The plotted levels can still change, but serve as a first reference point.
> If the reached level already represents the bottom, one can see that the FIB levels, beautifully go along with the "Supply&Demand" zones.
CHARTS
DXY – Overall picture
DXY – Overall picture + Monthly + Weekly
DXY – Trend lines
DXY – Supply & Demand ZONES
DXY – Fibonacci
THIRD PART
CONCLUSION
"The market makers only make money when everyone else loses. So what is the current mainstream opinion?"
Run that question through your head and let me know in the comments what you think is more likely.
> Another sell-off or a strong USD for now?
In summary, based on technical analysis, there are a few reasons for a "temporarily" strong USD.
> If you take a closer look at the area of the - HTF-POI-ZONE - you will see quite quickly that resistances could be enough for a whole arm.
> Bringing this wall down will take more than one run-up, in my opinion.
For this reason, I am assuming a strong USD and an accompanying bloodbath in the traditional and crypto markets.
> Positioning after confirmation of this thesis = SHORT
If this idea and explanation has added value to you, I would be very happy to receive a review of the idea.
Thank you and happy trading!

Resistance ahead $2.25 | SHORTOn daily TF
DYDX is reaching to resistance zones around $2.25
Short in lower timeframes when have a confirmation
Wait and see

Retest support | 0.64Daily chart
Stargate Finance ( BINANCE:STGUSDT ) is pulling back to 0.64
Chart 4H TF
STG's a confluence around 0.64
Wait for a next move

Third-wave done | Correction wave aheadDaily chart
Last my post about GOLD ( OANDA:XAUUSD ) reminded Reversal Pattern and it's completed.
Detail:
GOLD has broken up and out the neckline to complete the third wave at 1963.735 and it's happening fourth-wave
I expect GOLD will down to around 1950
I marked it on chart 4H below
Chart 4H TF
Gold's in Ascending Channel and done second-wave what's sharp correction wave and fourth-wave I think it will be a combo correction wave based on Elliott Wave theory.
Wait and see next move. I'll update

Reversal Pattern will completed?Weekly Chart
BINANCE:CRVUSDT is creating a reversal pattern Head Shoulders on weekly chart.
Wait for a break out Neckline
Daily Chart
CRV's declined Resistance third times
It's going down to Support around 0.77
Chart 4H TF
CRS's a support around 0.77
Wait for retest and bounce from Support Zones

Double Bottom then Head ShouldersWeekly Chart
On the chart, easily to spot Strong Resistance around $0.33 and price is moving up to that level after reject bottom at $0.15
Chart 4H TF
BINANCE:WOOUSDT is happening a reversal pattern Head Shoulders
Wait and see next move

Coming up slowly, $0.78On daily TF,
MATIC BINANCE:MATICUSDT has rejected 3 times Ascending Channel and moving up to 0.78
Wait and see

Learn Why You Should Study Multiple Time Frame Analysis
In my daily posts, I quite frequently use multiple time frame analysis.
If you want to enhance your predictions and make more accurate decisions, this is the technique you need to master.
In the today's post, we will discuss the crucial importance of multiple time frames analysis in trading the financial markets.
1️⃣ Trading on a single time frame, you may miss the important key levels that can be recognized on other time frames.
Take a look at the chart above. Analyzing a daily time frame, we can spot a confirmed bullish breakout of a key daily resistance.
That looks like a perfect buying opportunity.
However, a weekly time frame analysis changes the entire picture, just a little bit above the daily resistance, there is a solid weekly resistance.
From such a perspective, buying GBPUSD looks very risky.
2️⃣ The market trend on higher and lower time frames can be absolutely different.
In the example above, Gold is trading in a bullish trend on a 4h time frame. It may appear for a newbie trader that buyers are dominating on the market. While a daily time frame analysis shows a completely different picture: the trend on a daily is bearish, and a bullish movement on a 4H is simply a local correctional move.
3️⃣ It may appear that the market has a big growth potential on one time frame while being heavily over-extended on other time frames.
Take a look at GBPJPY: on a weekly time frame, the market is trading in a strong bullish trend.
Checking a daily time frame, however, we can see that the bullish momentum is weakening: the double top pattern is formed and the market is consolidating.
The sentiment is even changing to a bearish once we analyze a 4H time frame. We can spot a rising wedge pattern there and its support breakout - very bearish signal.
4️⃣ Higher time frame analysis may help you to set a safe stop loss.
In the picture above, you can see that stop loss placement above a key daily resistance could help you to avoid stop hunting shorting the Dollar Index.
Analyzing the market solely on 1H time frame, stop loss would have been placed lower and the position would have closed in a loss.
Always check multiple time frame when you analyze the market.
It is highly recommendable to apply the combination of at least 2 time frames to make your trading safer and more accurate.
❤️Please, support my work with like, thank you!❤️

5 Trades this week & +2.40% 🥲 / Part 2This is Part 2 of Weekly Review video analysis where I detail some of the markets price action this week. I talk about ideas such as the psychology of the market, key levels that played an important role, and my NFP buys.
If you enjoyed this video analysis, please leave your support with a rocket or a comment below. If this was interesting, follow for more! Anyways have a nice rest of your weekend and have a safe next trading week.

Look back to the past | At least 130% every impulse waveMonthly Chart:
Apple ( NASDAQ:AAPL ) is trading around $191 now.
When I look back to the past over 10 years from 2012 - 2022, I figured out AAPL always increased over 130% from bottom of the previous pullback. You can see that on the chart
And now, I expect NASDAQ:AAPL can go up at least 130% after down ~32.5% from previous ATH ($182.94)
If it come be true, APPL costs $286 in next 2 years and half.
Wait and see what happen
P/S: I'm a iFan

Eurusd Multi-timeframe Analysis 1W -> 1Hr ( Video 📹) Hello traders,
Welcome to this free Multi-timeframe analysis. Eurusd is the only market I trade and I thought that maybe I can bring more value with this educational video analysis.
Eurusd has low volume coming out of the bank holiday as expected. Do not blink though because we have a full plate of fundmanental news to end off the week with fed meeting minutes being released during late NY session tomorrow. With the Lack off bottom wick we can observe on the previous Daily candle I see another increase on Eurusd towards the top of the daily range (1.096) as long as we can stay above 1.086 Daily support level. If I'm going to be honest, zones are looking a bit messy to the upside when we get around 1.092. With have a very nice 36 pips range to fill to the downside to 1.08382 4hr support zone if our Daily support doesn't hold. We must keep in mind news can take price anywhere despite the messiness and cluster of our zones. So anything can happen and we must be preprared for both scenarios.
This was my previous publishing of Eurusd prior to PMI data release on Monday. (One of the scenario's pointed us back towards 1.08761 1hr Zone) Current price 1.0884

XMR, ancient coin | $212On weekly chart,
Monero BINANCE:XMRUSDT is in consolidation phrase.
It's trading at $164.8 now
I expect Monero will move up to $212 to complete 1.0 Fib Ex and 119.5% from $96.7
Wait and see

Resistance Ahead | Long Bias | Profitable 130%Weekly Chart:
Filecoin BINANCE:FILUSDT hasn't create New Bottom and bounced to $4.574 now
I expect FIL/USDT can go up to $10.5 - 11
Wait and see

Ethereum Retest after a Breakout 📕We've created a bottom wick on the new monthly candle of 2.5%. The Weekly candle closed strongly above the Weekly Resistance zone to the left hand side at $1,909. We can observe a clear Higher high in market structure that formed pushing price up to $1,976. We have clean traffic (clean and clear candles) to the left hand side on the 4hr and Daily timeframe up to $1,995. Textbook break and retest for Ethereum here for a continuation higher. Price is retesting our previous 4hr resistance which may turn into support.. It's possible price may want to retrace a bit more to $1,924 Daily support level that was formed after Sunday's price action.
4Hr Chart ->
Daily Chart ->

Reaching to Resistance $2.3 | SHORTOn daily TF:
Render Token BINANCE:RNDRUSDT has created Wave A at $1.722 and it's creating Wave B and Wave C.
Easily spot Resistance Zones around $2.3. It means spot Short Point in lower timeframes when have a confirmation.
I expect Wave B can reach to $2.55
On 2H TF
Wait a confirmation for Short Position
Let's wait and see

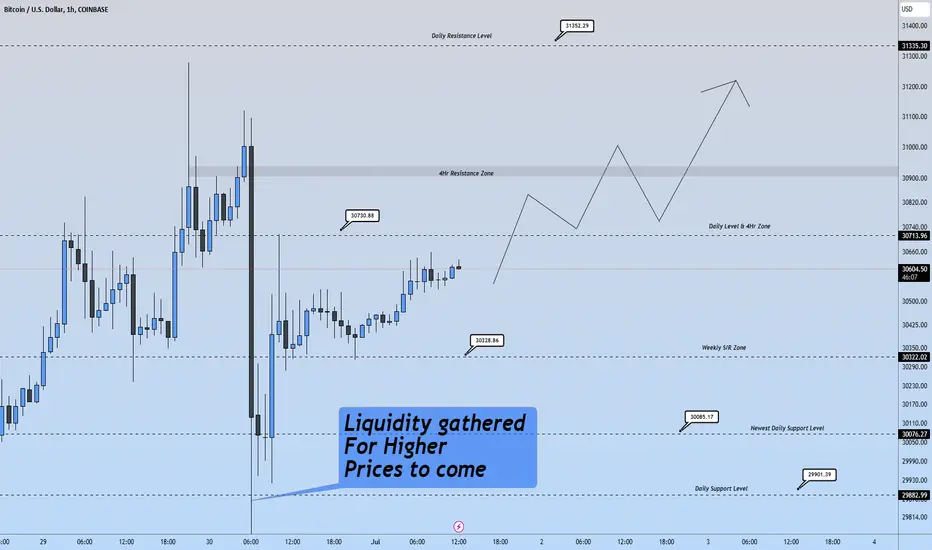
Solid Monthly Candle & Momentum through Weekly Candle Closure↗️The Monthly closed strongly Bullish with a solid engulfing candle of the previous monthly candle. We closed above $29,243 Monthly resistance. Also we closed above the weekly timeframe Resistance level at $30,322. The Monhtly candle closed but we have not see the weekly closure yet. Into the close of the weekly candle I'm anticipating a bullish push to the Upside. Our massive liquidations on Friday I believe served as a catalyst for a clear path forward. Looking at the monthly candle we can expect another Higher High on the next candle since it's in an uptrend and that was confirmed with market structure during the close of March's Monthly candle.
It's my belief that we will soon see our deeply feared $30,730 Daily Resistance Level act as a support for price.
Break and Retest @ $1,909 Weekly Level 📈Ethereum created a Higher High on the Daily Timeframe after the daily candle closed at $1,933 on Friday. Additionally, Eth closed up 3.15% on the Month and this suggests a further increase for July. More aggressive positioning for an increase in the month of July would be the anticipation that Ethereum closes above $1,909 Weekly supply level. Trade Idea : It uses what once was a Supply/Resistance level as a new Support/Demand level. This would translate into a swift break and retest trade above $1,909 and looking for new high prices to formulate as the new monhtly and weekly candle's kick off.
We have
1) Monthly candle just closed bullish
2) After 1 week of testing $1,909 Weekly Supply level, price has done a fair job of sticking right at it, current price $1,913
3) After all the crazy news, price remains at the medium term highs after a 16% pump across the past 2.5 weeks.
A Look at the Daily Chart, Created a Higher High and we may now use $1909 to do a break and retest to head towards $1,995

Fake-Breakout coming out of last week ↗️ 🌞PCE news last Friday took price back inside the range between 1.08919 Weekly Support level and 1.09859 Daily Resistance Level. The Friday daily candle retraced nearly the whole Thursday candle that contained GDP and unemployment claims data. I'm looking for this price behavior to continue into the early trading of this new week. The Idea is that we should have continued down last friday towards 1.07821 Daily S/R Zone. We didn't and instead we Eurusd has spring itself back in the range. A Fake breakout or Fakeout. I can see us returning to the top of the range basically. The Monthly candle closed Bullish for June. Looking for the same during July with the first target for July being 1.11. The second target being 1.11853. Price has been consolidating so far this year on eurusd. However, the market structure is consolidating upwards. The 3 month candle jsut closed a 3rd consecutive bullish candle. Why not more bullish?
