3 Trades I'm Taking With My Robin Trap Set Up Right NowMe Going Over 3 Trade Ideas That Im Taking Right Now.
Multitimeframeanalysis

Robin Trap strategy 2/27/25 Me Going Over My Funded Accounts And Challenges. And How I Use My Robin Trap Strategy To Grow Them

Trading with multiple VAMAsI want to show you how to analyse multiple timeframe VAMAs for trading opportunities. This is an interesting approach that can reveal valuable market structure information.
For this example I am using a 15m, 1h and. 4h VAMA, but you can use this on lower or higher timeframes as well. First, let's understand what each timeframe VAMA represent in this case:
The 15-minute VAMA indicates short-term trends and momentum
The 1-hour VAMA reveals intermediate trend direction
The 4-hour VAMA represents the broader market structure
When these VAMAs overlap on your lower timeframe chart (15m in this case), they create what we might call "zones of interest." Think of it like layers of support and resistance that have different degrees of significance based on their timeframe. Here's how we can interpret and use this information:
Convergence Zones
When multiple VAMAs cluster in a tight price range, this creates a significant zone of interest. For example, if your 15-minute, 1-hour, and 4-hour VAMAs are all within a narrow price band, this often indicates a strong support or resistance level. These zones typically exhibit one of two behaviors:
Price Bounces:
When price approaches a convergence zone from above or below, it often respects these levels. The more timeframes that have converged, the stronger the zone becomes. A bounce from such a zone with corresponding volume can present a high-probability trade opportunity.
Zone Breaks:
If price successfully breaks through a convergence zone, especially with increased volume, this often signals a strong trend continuation or reversal, depending on the direction of the break.
Hierarchical Trending
You can identify the strength and maturity of trends by examining how the different timeframe VAMAs are arranged:
Strong Uptrend Structure:
4H VAMA lowest
1H VAMA above 4H
15min VAMA above 1H
This "stacking" of VAMAs shows a healthy trend structure. The higher timeframe VAMAs act as dynamic support levels in an uptrend (or resistance in a downtrend).
Trade Entry Opportunities
Alignment Trades:
Look for moments when all VAMAs are pointing in the same direction and properly stacked. These situations often present high probability setups. For example: In an uptrend Price pulls back to test the 15-minute VAMA while the 1H and 4H VAMAs continue trending up.This creates a "buy the dip" opportunity with multiple timeframe confirmation.
Divergent Zone Trades:
When the faster VAMAs (1min, 15min) show divergence from the slower ones (1H, 4H), this can indicate potential reversal points: If the 1min and 15min VAMAs start curling up while price is testing the 1H VAMA as support. This divergence in shorter timeframes while respecting longer timeframe support can signal a reversal opportunity.
Breakout Confirmation:
Use the multiple timeframes to confirm breakout trades:
When price breaks above a convergence zone
Look for the faster VAMAs (1min, 15min) to cross above the slower ones
Volume should increase during the break
The previous resistance zone (marked by the VAMAs) should become support

Maruti : Make or Break?Technical view
Box trading strategy in which you identify or stop consolidating for a couple of days and trading the direction of the breakout in this case Maruti Suzuki india limited is consolidating for past 3 days.
What is the strategy why does this work?
When a stock price moves sideways, it usually happens for two main reasons: either people are losing interest in the stock, or there's a lot of activity but the number of buyers and sellers is balanced.
Now, imagine a group of traders who are watching this stock. They have set their stop-loss orders close to where they bought the stock. This means if the price moves too far against them, they'll automatically sell to limit their losses.
When the stock finally breaks out of this sideways pattern, something interesting happens. New buyers or sellers jump in, excited about the movement. At the same time, those traders who were holding onto their positions start to sell because their stop-loss orders are triggered.
This combination of new traders entering the market and existing traders exiting their positions creates a surge in momentum in the direction of the breakout. So, if the price breaks upward, it can rise quickly as both new buyers come in and former holders sell out, pushing the price even higher.
Pro Tip
Entry at 15m tf Strong Candle Close (Outside the Box)
StopLoss is at Entry Candle high or Low (Not more than (0.8%)
Targets :- 12,887.50 (Upside) 12,411.25 (Downside)
Fundamental View
Profit: Maruti Suzuki India Ltd reported a consolidated net profit of ₹3,727 crore for Q3 FY25, a 16% YOY increase. However, another source indicates a standalone net profit of ₹3,525 crore, up 13% YOY, but below market expectations of ₹3,624 crore.
Revenue: The company reported revenue of ₹38,764 crore, a 16% YOY increase.
Sales Volume: Total sales were 566,213 units, up 13% from last year3. Domestic sales were 466,993 units (up 8.7%), and exports were 99,220 units, a significant increase of 38.2%.
EBITDA: Operating profit (EBITDA) increased by 14.4% YOY.
Not an Investment Advise

GBP/USD: Selling into the reboundThe setup is similar in EUR/USD & GBP/USD - because of the dollar in both major pairs!
The GBP price is testing the broken uptrend line on the weekly- and could break above it.
On the daily chart, a downtrend line has already broken and so has critical resistance at 1.25, suggesting a break above the weekly uptrend line
Should the breakout follow-through it faces resistance at 1.28 from the December high and 30 week (150 day) moving average.
However, should the breakout fail - it sets up a likely continuation of the longer term downtrend.

Weakness on DIS stockThe stock of Walt Disney Company looks interesting from the VSA point of view.
The monthly chart shows that the price is now around the top of the horizontal channel formed after a year of down move (blue lines). On one side, there is professional buying in the background, which might resolve this sideways to the upside, but there is much more supply around market peaks from the other side, and that might lead to a down move.
Deeper analyses of the price action over the last few months on the daily chart show massive supply. Moreover, the price went below the selling zone (red rectangle) and returned to its bottom on a low decreasing volume, showing an absence of professional interest to participate in an up move.
So, to summarise it together:
As of now, this stock is weak . With a big probability, the price may fall to the bottom of the monthly sideways channel first and if no buying suddenly appears while the price breaks the $79.24 level, it could reach the $20.0-$30.0 area then.
If professionals buy around the channel bottom, the move-up will depend on the size of that buying, but will most probably push the price back to the monthly channel's top.

$SPY: Three timeframe analysis, One Chart Pattern, Sentiment📢!Hey there!
#Tariffs negative news drives bearish sentiment. Is it just mass media noise? And Mr. Market will continue up?
WHY?
Let's have a look at the charts:
1. 📈We are in a bullish trend on a weekly and monthly basis, meaning long-term and mid-term, yet in a bearish on a daily one, a ka short-term
2. 🤓The bullish Flag pattern has formed. Yeah, I know; how do you qualify it? For this theoretical exercise only visually, but for anything more serious, Bukowski starts, or you may want to run your own tests.
3. 🍒And the cherry on top: Bearish sentiment is significantly higher than the historical average, standing at 42.9% (2/5/2025) compared to 31.0%. On my side, it means that we might be in for a heavy short squeeze for a couple of days.👋Just observations, not advice
For now, enjoy Super Bowl Sunday! 🏈
S ource of the screenshot: AAII Investor Sentiment Survey, www.aaii.com

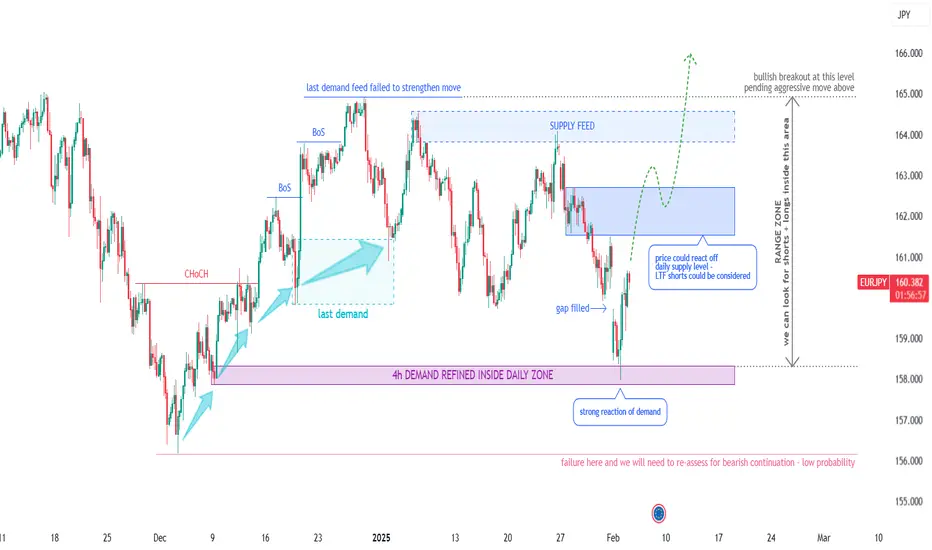
EURJPY Potential Longs - Short & Long Term (Technical Analysis)Technical Outlook:
Looking at previous price movement, we see it's been trending up since August 2024, with the last reaccumulation phase ending in early 2024. We recently saw a demand chain, but the last push couldn't quite hit new highs. Supply then took over, driving the price back down to a daily demand level. At this point, we've seen some strong bullish reactions on the lower timeframes, which is interesting and here's why -
Potential Scenarios & Probabilities:
Scenario 1 (High Probability) – Demand should regain control, leading to a bullish breakout.
Scenario 2 (Medium Probability) - Price could range within the ascending channel for a while.
Scenario 3 (Low Probability) – The bulls might disengage, resulting in a bearish break and continuation thereafter.
Trading Considerations:
Price is currently in a discounted zone within the ascending channel (158.000 – 168.000) . We can look for trading opportunities within this range, focusing on strong supply and demand areas, anticipating the eventual bullish breakout. A long position closer to the bottom of the range could turn into a swing trade. If you're trading inside the range on lower time frames, it's smart to keep an eye on volume, overbought/oversold levels, and relative currency strength.
Final Notes:
With the price moving sideways for a good six months, range trading is definitely a possibility. But the real goal is to catch that bullish breakout when it happens, and it looks like it's getting close. As always, manage your risk carefully, and don't hesitate to take the trade when the setup is right – assuming you've got a solid plan and a clear target in mind.
OANDA:EURJPY
XAUUSD Gold: After correction, a new ATH?The XAUUSD rose to a high of 2786 on Friday, only 30 pip down than the previous all-time high (ATH).
Bulls may be able to enter the market at more advantageous times because the price is currently in a correction phase.
The area around 2740 is a key confluence support and may be a desirable entry point. The end of the correction and the possibility of a new ATH would be signaled by a reversal from this region and a break back above 2760.
However, the positive view would be halted and caution would be advised going forward if the daily close fell below 2740.

EURUSD is possible to drop soon!Hey guys,
based on the chart, I've identified a resistance area (in 4H timeframe).
And we can see the rejection of price from the mentioned area.
Also as confirmation for our scenario is the descending channel that is identified on the chart.
So It ca be another good trading opportunity with risk/reward ratio around 1/4 which is considerable!
Good luck.

GBPUSD Week 4 Swing Zone & LevelDynamic Take profit, dtp allows trade to catch big moves. These are set based on price momentum. Last week provided a humble 40pips.
Initial Swing Zone/Level are calculated at
Zone: 21599-21549
Level set as shown. Either a or b could play out, as determined by Price action.
As price breaks or bounces off these areas, new zones/levels will be recalculated.
Happy trading week


Axiscades LongTerm BOstock gave a long-term breakout and has also done a retest after the breakout. It can be added with a stop loss of a strong close of the monthly candle below 420.
Do your own research before investing!

USDJPY wave structure analysis of 15 minute time frame- 1H swing is bullish => Currently is pullback down
- M15 swing is bearish => Currently is pullback up
- We can look for a selling opportunity down to the demand zone of the 15-Minute Timeframe

EUR/USD Break-and-Retest: Next Stop 0.97?Weekly Timeframe:
Clear downtrend with a rejection at the 50 MA and a break below key support. Next target lies around 0.97-0.98, a major demand zone.
Daily Timeframe:
Confirms the bearish bias with a retest of the broken support, now acting as resistance. Price remains below the 50 MA, signaling continued downside.
Correlation:
Both timeframes align in a bearish trend. Weekly sets the direction, while daily refines entry opportunities with break-and-retest setups.

Gold: Multi Tie FrameHello Traders
In the weekly timeframe, an ascending channel is observed, showing a good reaction at its upper boundary. We are waiting for a price pullback to the next resistance level.
In the daily chart, an ascending trendline has been broken, with two returns to the breakdown area around 2600.700, indicating the strength of sellers. The price returning to this area for the third time also shows the buyers' insistence. If the price can stabilize below 2532.800, the likelihood of further decline increases. Conversely, if the price cannot break through the green zone, we predict an upward movement to 2606.200.
At the same time, we anticipate a slow downward trend and fluctuations to around 2568 in the coming days.

USDJPY: Multi-Time-Frame OutlookHello Traders,
A weekly close above 159.00 strengthens the bullish outlook for the next 3 to 4 months.
Conversely, a break and close below 154.50 on the daily timeframe suggests a possible decline towards 148.00.
Currently, we anticipate a rebound from the 156.77-156.40 zone.
However, a solid close below 156.40 and a break of the ascending channel would increase the likelihood of a drop to 155.50.

EURUSD: Short-termHello Traders,
Regarding the Daily chart, we are bearish. and recently break below consolidation.
Regarding the 2h Chart we are bearish and overbought! because we are in top half a bearish channel
Regarding the 5m chart, Formation of a double top or head and shoulder is clear, you can use any other confirmation type or enter right now
Tps and SLs calculated based on previous recent important levels.

Trading My Robin Trap Strategy Me Going Over How I Use Everything Together For My Robin Trap Strategy In Great Detail

Understanding ICT Bullish Mitigation BlockA Bullish ICT Mitigation Block is a concept from Inner Circle Trader (ICT) methodology.
It forms at the end of a bearish trend when the price reaches a strong bullish institutional reference point, such as a bullish order block or breaker block.
Formation: It occurs when the price fails to create a lower low in a bearish trend and instead reverses to shift the market structure to the bullish side.
Identification: Look for a price level where the market attempted to break lower but was halted by significant buying pressure.
Trading Implications: This area can serve as a strong demand level, from which the price can rally further stronger because of short traders exit and long traders enter at the same area.
Multi Time Frame Analysis:
Higher Time Frame - H4
Lower Time Frame - M15
Institutional Framework:
Price Expansion (MMXM Buy Model)
Institutional Reference Points:
Bullish Mitigation
Sell Side Liquidity (SSL)

GBP/USD: Bullish Bias and Strategic PositioningToday, I’m excited to share my analysis on the GBPUSD currency pair, which is currently showing a strong bullish bias.
As we navigate through the market, I will be utilizing probabilities to strategically position myself for long trades.
Current Market Dynamics
The GBP/USD pair has recently shown resilience, bouncing off critical support levels around 1.2670. This rebound suggests a potential bullish reversal, driven by positive sentiment surrounding the UK economy.
Key fundamentals such as the Bank of England's recent decisions to maintain interest rates amidst inflationary pressures signal confidence in economic stability, which supports our bullish outlook.
Global Influences
On the global stage, factors such as a weakening U.S. dollar and improving economic indicators from the UK create a favorable environment for the British Pound. Additionally, geopolitical developments are leaning towards stability, which typically boosts investor confidence in GBP.
Trading Strategy
In this context, I plan to leverage statistical probabilities to identify optimal entry points for long positions. By focusing on key technical indicators, I aim to maximize potential gains while effectively managing risk.
Join me as we explore this exciting opportunity in GBP/USD! Let’s make informed trading decisions together and capitalize on this bullish momentum. Happy trading!
2W:
3H:
P.S. If you have any questions about how I trade probabilities with the overall market direction, feel free to reach out.

EurUsd rising?The price is showing intent to upside moves and change the 4h structure, confirming the daily retracement phase.
Let's see how it rolls

NIFTYBANK Multi time Frame Analysis
Higher Time Frame : H4
Lower Time Frame : M15
Entry Time Frame : M5
HTF > LTF > ETF ( H4 > M15 > M5 )
HFT - Market Bias
LTF - Market Structure
LTF - Entry
PD array : Bullish Breaker
