XRPUSD Daily Breakdown Wed.Mar.2.2022Please like and comment as it pushes me to keep creating content on pairs and my bias on it :) -This is merely MY outlook and not advice on what YOU should do just my opinion on what I see - yonsfx
Multitimeframeanalysis

Market is offering a good RR Short // NY Reversal?Cycle analysis suggests good risk:reward shorts. So I'm going to be looking for an entry up here with 20m (14) Atr as the stop loss, just beyond it

XRPUSD Daily Breakdown Tues.Mar.1.2022Please like and comment as it pushes me to keep creating content on pairs and my bias on it :) -This is merely MY outlook and not advice on what YOU should do just my opinion on what I see - yonsfx

BTCUSD Closer look at this move. 15min will trigger big move.I think once the 15 min looks like all the other timeframes above it... A big pop will happen. I persoanlly think up but i could be wrong it could be setting up to go down. Either way once it starts moving if you jump in it should keep moving.
Based on a move I saw in the futures several times where all time frames synch up on the exact same move and then take off.
by iCantw84it
02/27/22

BTCUSD All time Frames have touched the Bottom BB Ready to move All time frames have touched the bottom BB and this is possibly ready to move to the upside. I placed a red line where the Daily Bottom BB is now but just know its already hit it and not neccessary for this to be touched again.
by iCantw84it
02/27/22

XRPUSD Daily Breakdown Mon.Feb.28.2022Please like and comment as it pushes me to keep creating content on pairs and my bias on it :) -This is merely MY outlook and not advice on what YOU should do just my opinion on what I see - yonsfx

WEEKLY FOREX OUTLOOK SUN.FEB.27.2022 - FRI.MAR.4.2022Please like and comment as it pushes me to keep creating content on pairs and my bias on it :) -This is merely MY outlook and not advice on what YOU should do just my opinion on what I see - yonsfx

XRPUSD Daily Breakdown Sun.Feb.27.2022Please like and comment as it pushes me to keep creating content on pairs and my bias on it :) -This is merely MY outlook and not advice on what YOU should do just my opinion on what I see - yonsfx

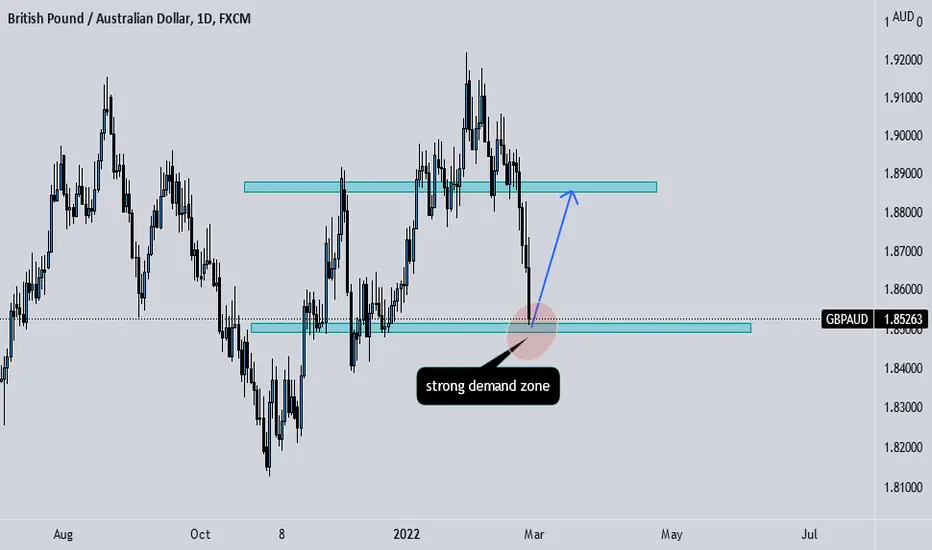
GA ready for going up?currently price is at very strong support zone and it could led to price going up
XRPUSD Daily Breakdown Sat.Feb.26.2022Please like and comment as it pushes me to keep creating content on pairs and my bias on it :) -This is merely MY outlook and not advice on what YOU should do just my opinion on what I see - yonsfx

USDJPY Analysis & Trade IdeaPrice is in an uptrend on the HTFs, but is bearish on the 15M. This bearishness may be short term, as price is potentially making a HL.
The possible pivot points are our marked POIs, where I will look to enter long.
No confirmation, no trade. I need to see price shift from bearish to bullish momentum before any long entry.

XRPUSD Daily Breakdown Fri.Feb.25.2022Please like and comment as it pushes me to keep creating content on pairs and my bias on it :) -This is merely MY outlook and not advice on what YOU should do just my opinion on what I see - yonsfx

Is the Party Over?Insane Volatility
Ukraine being attacked by russia
Think russia will win and Nato will do nothing
we have momentum
so we will probably continue marching up, im looking to
trade with the mm, and hold onto buys until 103 where we have a Weekly Supply Zone
XRPUSD Daily Breakdown Thurs.Feb.24.2022Please like and comment as it pushes me to keep creating content on pairs and my bias on it :) -This is merely MY outlook and not advice on what YOU should do just my opinion on what I see - yonsfx

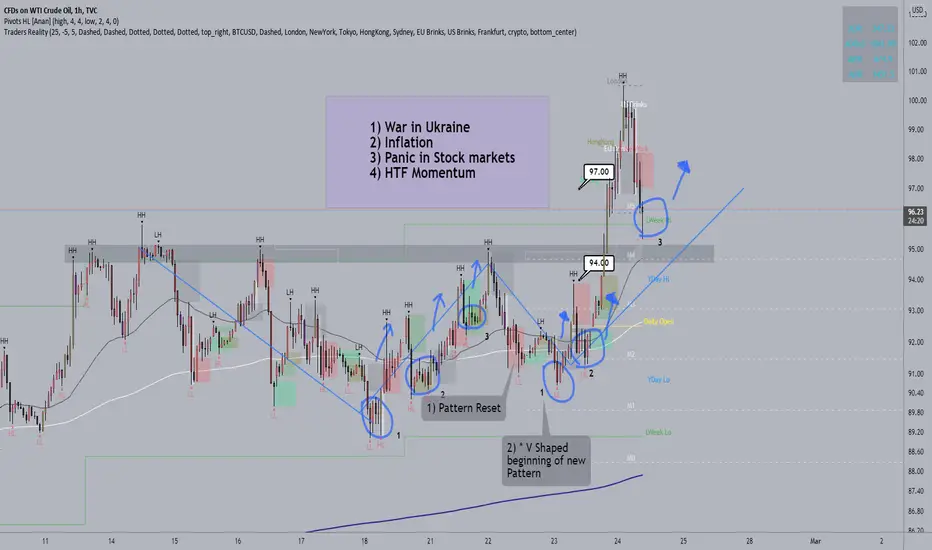
Us Oil back to $ 94 ? // Previous weekly candle Liquidity?Looking for Buys on this pair, for the 3 reasons listed below. Additionally , although we are in a range on the 4hr timeframe, this does not mean we cannot read 1hr market structure within the range to anticipate moves . After all the range is 4$ which is quite significant. volatility is consistently higher than what we have seen in previous years on this asset.

XRPUSD Daily Breakdown Wed.Feb.23.2022Please like and comment as it pushes me to keep creating content on pairs and my bias on it :) -This is merely MY outlook and not advice on what YOU should do just my opinion on what I see - yonsfx

XRPUSD Daily Breakdown Tues.Feb.22.2022Please like and comment as it pushes me to keep creating content on pairs and my bias on it :) -This is merely MY outlook and not advice on what YOU should do just my opinion on what I see - yonsfx

Day Trade Idea // XAUUSD // Pullback for Liquidity?I appears that buyers may be drying up at these prices,
we have seen the news this morning regarding putin be the catalyst for
a fresh Higher High to begin the week. Similiar to Gbpjpy, Xauusd has large/deep pullbacks for liquidity.
I'm looking for that as we move into the second london session of the week,
Tight SL, targeting at least a 3:1 RR, targeting a retest of 1900$

EURUSD down to 1.124 // Completing Daily Fakeout Structurewell, price is moving down
and we want to follow price.
Especially given current market sentiment with Russian/Ukriane News. I like people
to continue buying the USD, Also I like market structure on the DXY for Buys. Looking for sells here, following price downwards
towards the low of our Range on the Daily/Weekly

XRPUSD Daily Breakdown Mon.Feb.21.2022Please like and comment as it pushes me to keep creating content on pairs and my bias on it :) -This is merely MY outlook and not advice on what YOU should do just my opinion on what I see - yonsfx

USDCAD looking for Higher Prices // Based off Weekly TimeframeLooking upwards based off weekly candle closures and rejection from
1.266 support area. It seems like a good time to get another leg up because of the
war tensions and the impact it has had on market sentiment, (Russian News 2/18/22 attacking ukriane)

WEEKLY FOREX OUTLOOK SUN.FEB.20.2022 - FRI.FEB.25.2022Please like and comment as it pushes me to keep creating content on pairs and my bias on it :) -This is merely MY outlook and not advice on what YOU should do just my opinion on what I see - yonsfx

BTC - Update Last Analysis in 4H #BTC $BTC - Neutral ZoneDear Friends
This is a new update from the Last analysis in 4H.
Neutral Zone and descending trend line in daily and 4H.
wait for any breakout to down or up and I think we can find the best movements in the new year and next week.
