GBPUSD - Pullback before Trend Change*** Trade at your own risk! ***
*** Not every idea is also traded by us ***
Hi Traders!
In the following you'll see a Multiple Timeframe Analysis.
It includes a screenshot and and a few bullet points.
Monthly TF:
- Monthly Consolidation
- Market bounces between those three Levels: 1.23, 1.32 and 1.42
Weekly TF:
- Lastly, after the price reached the top monthly Level, it bounced back from the middle monthly Level.
- Now it is at the weekly Resistance
- Broke out of the descending TL --> bullish power
Daily TF:
- On daily TF, we have a Downtrend with LHs and LLs
- Recently, the price made LH and starts fall
- The discount entry for bulls and the TP of bears is probably at the orange Area of Support
This Down-movement is very likely to happen in our view.
- After that, we have two possibilities:
1) The market moves up again and breaks its LH. It makes a HH and the Downtrend would be broken.
2) The market falls down lower and makes a new LL. The Downtrend would be continued then.
- But those possibilities come afterwards
H4-TF:
- As mentioned on the daily section, a down-movement is likely in our view
- The ascending H4-Trendline is one barrier, which could make it a bit difficult to move lower
H1-TF:
- On the hourly TF we see, that the Up-Trend has changed:
- We had HHs and HLs, but now we can recognize a LH and a LL
- Equally, the Break of Support could mean SLs for buyers and that's why they'll stop buying more potentially
- Also the MACD indicator shows us strong bearish Momentum
If you have any questions, another Point Of View or anything else, don't hesitate to share them!
Thanks and successful Trading!
Multitimeframeanalysis

XRPUSD Daily Breakdown Sat.Jan.15.2022Please like and comment as it pushes me to keep creating content on pairs and my bias on it :) -This is merely MY outlook and not advice on what YOU should do just my opinion on what I see - yonsfx

XAUUSDGLOBALPRIME:XAUUSD
FOR SHORT
** Already in the DAILY RESISTANCE
** in the making of a DOUBLE TOP in 4H (waiting for confirmation)
** DARK CLOUD COVER FORMATION (waiting for confirmation)
*** MAKING a Bearish Flag in 15min

Swing Trade for COALINDIALong Entry for COALINDIA: at a support zone in the trend line, being followed from October 2020. In weekly chart, we also see a long lower tail candlestick at the trend line support zone on the week 20 Dec 2020.
Buy between - 146-150
Stop loss - 138
Holding Period - 2-3 weeks or longer
Note : If you risk to trade this idea, you alone will be enjoying it's profit as well as the loss, if something goes wrong.
Happy Investing :)

XRPUSD Daily Breakdown Thurd.Jan.13.2022Please like and comment as it pushes me to keep creating content on pairs and my bias on it :) -This is merely MY outlook and not advice on what YOU should do just my opinion on what I see - yonsfx

EURUSD - LONG TERM VIEWFX:EURUSD is currently trading in a range on weekly and daily basis.
The crucial resistance level is 1.14246.
The next two crucial levels are 1.15924 and 1.17006.
If the trend line and the range breaks, these crucial levels are the next to reach .
The forecast line is being followed from 2016, at 2020, we have seen a big volume when the price reached near to this line again.
Trade Details :
Trade Active: When range, trendline breaks
Entry at or below = 1.14246
Stop Loss = 1.11679 , or the Red Forecast Line
Target 1: 1.15924
Target 2: 1.17006
Trading period: 5-6 weeks or longer
Take your trade only after doing your own analysis and plans.
Happy Trading :)

XRPUSD Daily Breakdown Wed.Jan.12.2022Please like and comment as it pushes me to keep creating content on pairs and my bias on it :) -This is merely MY outlook and not advice on what YOU should do just my opinion on what I see - yonsfx

AWC is "On Time" for a move upThis one to me looks great on multiple timeframes with technical's and price indicating evidence of bottoming with another move higher.
Short term conditions -
Long term conditions -
My stop is 1 ATR below the .618 level and target is 2.20which represents a very good risk to reward ratio of 1:5 at current levels.

XRPUSD Daily Breakdown Tues.Jan.11.2022Please like and comment as it pushes me to keep creating content on pairs and my bias on it :) -This is merely MY outlook and not advice on what YOU should do just my opinion on what I see - yonsfx

XRPUSD Daily Breakdown Mon.Jan.10.2022Please like and comment as it pushes me to keep creating content on pairs and my bias on it :) -This is merely MY outlook and not advice on what YOU should do just my opinion on what I see - yonsfx

WEEKLY FOREX OUTLOOK SUN.JAN.9.2021 - FRI.JAN.14.2021Please like and comment as it pushes me to keep creating content on pairs and my bias on it :) -This is merely MY outlook and not advice on what YOU should do just my opinion on what I see - yonsfx

XRPUSD Daily Breakdown Sun.Jan.9.2022Please like and comment as it pushes me to keep creating content on pairs and my bias on it :) -This is merely MY outlook and not advice on what YOU should do just my opinion on what I see - yonsfx

XRPUSD Daily Breakdown Sat.Jan.8.2022Please like and comment as it pushes me to keep creating content on pairs and my bias on it :) -This is merely MY outlook and not advice on what YOU should do just my opinion on what I see - yonsfx

BTC $BTC #BTC Maybe in 4HDear Friends
Tomorrow is the last week of the year and maybe the price will have volatility until a higher important zone(53-54).
Disclaimer: Information is provided only for educational and exchange purposes only.
Do your research before taking any action or decision in the real market.

COALINDIA LONG-TERM VIEWToday COAL INDIA closed over 200-day EMA backed by a high volume trading.
Also breaks the downward weekly trend-line followed from August 2015 on a daily basis. If it stays above the trend-line for this week, we can go long for couple of weeks.
Next Support levels to watch:
Support 1 = 162.20
Support 2 = 172.80
Check out the link to my previous Swing trade idea for COALINDIA.
Happy Investing :)

XRPUSD Daily Breakdown Fri.Jan.7.2022Please like and comment as it pushes me to keep creating content on pairs and my bias on it :) -This is merely MY outlook and not advice on what YOU should do just my opinion on what I see - yonsfx

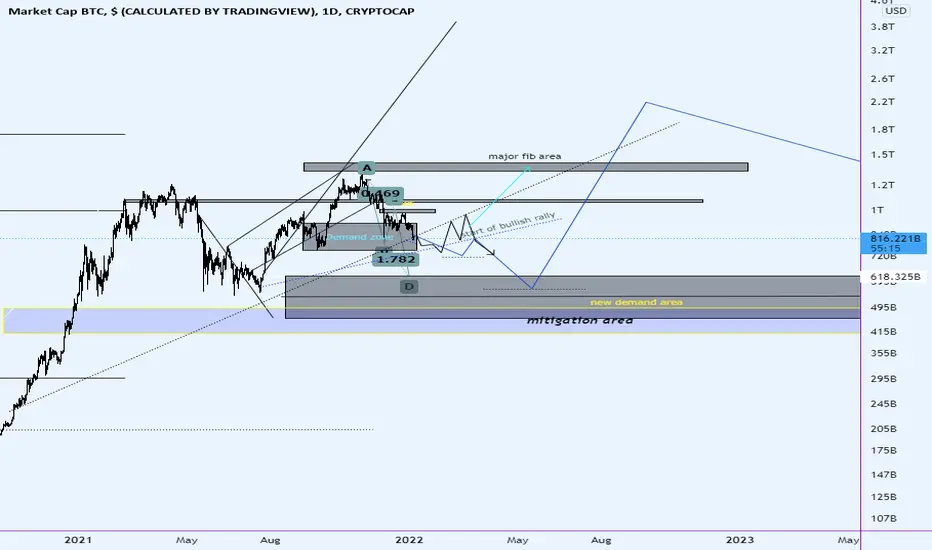
This summer will be an amazing time to buy bitcoin!Patience brings profits in this analysis I dissected best areas to get active in a major way. Through a fractal understanding of the market if you know how the 3 scenarios I drew go then we can take that knowledge down to a 5,1 min chart and operate off of the same bases and bank some huge profits. This is not financial advice, I draw my charts like this in order to prepare for volatility, like if you agree!
XRPUSD Daily Breakdown Thurs.Jan.6.2022Please like and comment as it pushes me to keep creating content on pairs and my bias on it :) -This is merely MY outlook and not advice on what YOU should do just my opinion on what I see - yonsfx

XRPUSD Daily Breakdown Wed.Jan.5.2022Please like and comment as it pushes me to keep creating content on pairs and my bias on it :) -This is merely MY outlook and not advice on what YOU should do just my opinion on what I see - yonsfx

XRPUSD Daily Breakdown Tues.Jan.4.2022Please like and comment as it pushes me to keep creating content on pairs and my bias on it :) -This is merely MY outlook and not advice on what YOU should do just my opinion on what I see - yonsfx

XRPUSD Daily Breakdown Mon.Jan.3.2022Please like and comment as it pushes me to keep creating content on pairs and my bias on it :) -This is merely MY outlook and not advice on what YOU should do just my opinion on what I see - yonsfx

Gold - XAUUSD 2022 Full Top Down AnalysisTraders,
Happy New Year. As this is the start of a new year we reset our analysis and start afresh . Gold is showing some of the very important patterns to trade in 2022. Using our fibonacci based FCP analysis and candle stick patterns, we try to anticipate and forecast the bias and possible levels in XAUUSD. Gold is expected to be bearish this year but we must trade what we see so in this full top down analysis we try to see various scenarios that Gold can play out and how those scenarios can turn into trading opportunities.
Markets can be very fragile in these first few days of the year so be careful.
Rules:
1. Never trade too much
2. Never trade without a confirmation
3. Never rely on signals, do your own analysis and research too
✅ If you found this idea useful, hit the like button, subscribe and share it in other trading forums.
✅ Follow me for future ideas, trade set ups and the updates of this analysis
✅ Don't hesitate to share your ideas, comments, opinions and questions.
Take care and trade well
-Vik
____________________________________________________
📌 DISCLAIMER
The content on this analysis is subject to change at any time without notice, and is provided for the sole purpose of education only.
Not a financial advice or signal. Please make your own independent investment decisions.
____________________________________________________

WEEKLY FOREX OUTLOOK SUN.JAN.2.2021 - FRI.JAN.7.2021Please like and comment as it pushes me to keep creating content on pairs and my bias on it :) -This is merely MY outlook and not advice on what YOU should do just my opinion on what I see - yonsfx
