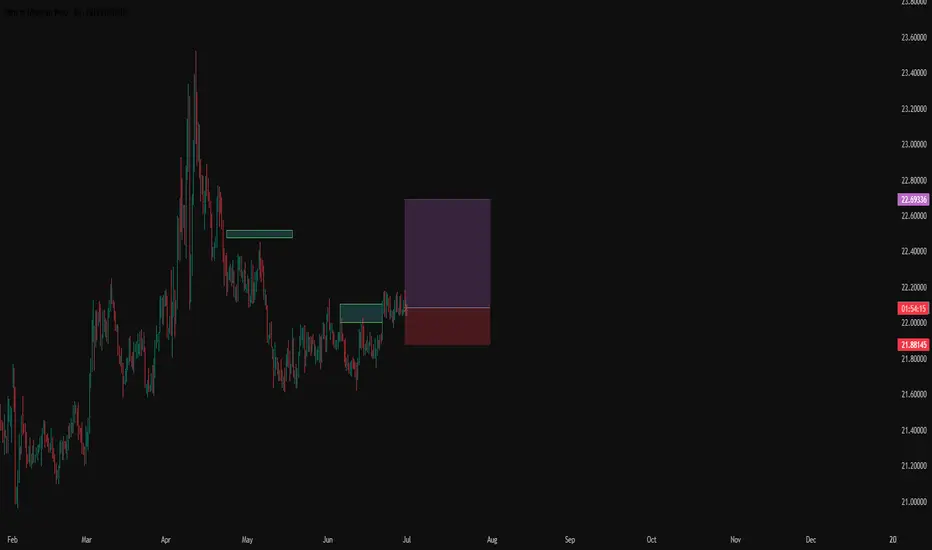
#007: LONG EUR/MXN Investment OpportunityHi, I'm Andrea Russo and today I want to talk to you about this long investment opportunity on EUR/MXN.
After a careful analysis of institutional flows, market sentiment and macroeconomic dynamics between Europe and Mexico, I have identified a potential medium-term long opportunity on this currency pair, often overlooked by retail traders but closely followed by professional operators for its hybrid technical-fundamental structure. I would like to thank in advance the Official Partner Broker PEPPERSTONE who supported us in creating this technical analysis.
🔍 Technical and strategic context
In recent days, EUR/MXN has shown typical institutional accumulation behavior: prolonged congestion on key levels, progressive decrease in volatility, increase in volume anomalies on bearish spikes and presence of clear defenses on strategic support areas.
All this while retail positioning remains strongly unbalanced short, with over 75% of retail operators selling this pair in the current area. Historically, when such extreme levels of imbalance are reached, the likelihood of an institutional-driven reversal increases significantly.
🧠 Expected Behavior and Institutional Dynamics
Large financial institutions – including global banks and hedge funds – never enter “on cue”: they enter when the market is ready for them to win. This often happens after retail has positioned itself heavily against the upcoming move, and that is exactly what we are seeing these hours.
EUR/MXN is a high-yielding pair: the Mexican peso often benefits from favorable carry trades, but is also highly exposed to geopolitical tensions (such as the current US-Iran turmoil) and the overall direction of the US dollar and the euro. In this environment, with a stable euro and rising systemic risk, the natural flow tends to move away from the Mexican peso, making long EUR/MXN particularly attractive.
🎯 Operational positioning and objectives
My entry occurred on a well-defined compression zone, with a protected technical stop loss and a target calculated on structure, volumes and previous similar breakouts. The target is an area around 22.73, where institutional profit taking is likely to arrive.
It should be noted that the entire current structure is built on protection zones generated by passive orders: we know that in EUR/MXN these levels have historically caused strong rebounds when reached.
📊 Conclusion
This trade is not simply a directional bet. It is the thoughtful execution of a model based on the behavior of large operators, market psychology and advanced analysis of capital flows. It is not about "predicting the future", but positioning yourself at the same time as the strong hands do, exploiting their own rules.
My goal is to operate like a hedge fund does, and in this trade on EUR/MXN I see all the conditions for this to happen.
Mxn
USDMXN: The Mexican Peso Continues to StrengthenOver the last four trading sessions, the USD/MXN pair has dropped more than 1.5% in favor of the Mexican peso as the U.S. dollar continues to weaken in the short term. The index that measures the strength of the U.S. dollar (DXY) remains consistently below the 100-point level, highlighting the broad weakness of the currency. This has, in part, allowed the current bullish bias of the Mexican peso to persist over the short term.
Downtrend Remains Intact
Since the early days of April, selling pressure has been strong enough to sustain a steady downtrend. However, as the price continues to fall, notable signs of neutrality have started to emerge, which could pave the way for short-term bullish corrections as bearish momentum begins to show signs of exhaustion.
RSI
Lower lows in USD/MXN and higher lows in the RSI have generated a bullish divergence in the short term, suggesting a persistent price imbalance and potential loss of bearish strength in recent sessions. This could open the door for buying corrections to materialize in the upcoming trading sessions.
TRIX
The TRIX line remains oscillating below the 0 level, indicating that the dominant bias over the past few weeks is still bearish. However, if the line continues to flatten, it may signal a possible pause in recent selling momentum.
Key Levels to Watch:
19.24: A near-term indecision zone that may act as a barrier for potential buying corrections.
19.00: A key support level aligned with an important psychological zone. Price movement below this level could provide further room for the current bearish pattern to continue.
19.70: A critical resistance level, corresponding to the highest point of the past two months. A move back toward this area could signal the end of the current downtrend.
Written by Julian Pineda, CFA – Market Analyst

USD/MXN: The Mexican Peso Faces Strong NeutralityOver the last five trading sessions, USD/MXN fluctuations have shown a variation of barely 1%, indicating the emergence of sustained neutrality in the pair's recent moves. For now, the slight bearish bias in USD/MXN has managed to maintain a steady downward trend, as the Mexican peso benefits from short-term weakness in the U.S. dollar—as shown by the DXY index, which continues to trade below the 100-point mark, highlighting persistent weakness in the U.S. currency.
Potential Downtrend:
Since early April, bearish moves have begun to form a steady downtrend, bringing the price close to the 19 pesos per dollar level. So far, no significant bullish correction has reversed the current selling trend. However, it is important to note that the recent neutral tone could undermine the bearish bias of the past few months. If this neutrality continues, it could give way to a new phase of prolonged sideways trading in the short term.
MACD:
The MACD histogram has been hovering around the 0 line for several sessions, indicating that the moving averages are in a neutral zone, with no clear bullish or bearish dominance. If this pattern persists, the current neutrality could lead to a more defined consolidation range.
RSI:
The RSI line has started forming higher lows while USD/MXN prices have marked lower lows—resulting in a bullish divergence. This could signal room for potential upward corrections in the short term.
Key Levels to Watch:
19.24 pesos per dollar: A current barrier where price action has shown strong neutrality; it could serve as a starting point for potential short-term bullish corrections.
19.70 pesos per dollar: A critical resistance at the highest level the pair has reached in recent weeks. Sustained bullish movement near this zone could mark the end of the prevailing downtrend.
19.00 pesos per dollar: A significant psychological support. Continued bearish moves approaching this level could revive the forgotten bearish sentiment and strengthen the current downtrend line.
Written by Julian Pineda, CFA – Market Analyst

USD/MXN Continues to Fall Below the 20 Pesos per Dollar LevelOver the past five trading sessions, the USD/MXN pair has declined by more than 2%, as the Mexican peso continues to gain ground against the U.S. dollar. This bullish trend in the peso is partly driven by the ongoing weakness in the U.S. dollar, as reflected in the DXY index, which has fallen to 99 points, its lowest level in the past year.
The dollar’s weakness stems from the growing political and economic uncertainty generated by the global trade war, triggering a broad wave of dollar selling as capital exits the U.S. If this trend continues, the Mexican peso could maintain its bullish momentum in the short term.
Lateral Range Breakout
Since November 2024, USD/MXN had been trading within a sideways range, with resistance at 20.94 pesos per dollar and support at 20.00. In recent sessions, bearish pressure broke through this support, and as selling momentum builds, this could mark the start of a more meaningful downtrend.
MACD
The MACD histogram remains below the neutral zero line, indicating strong bearish momentum based on recent moving average trends. If the histogram continues to show deeper negative values, selling pressure could intensify further in the short term.
RSI
Currently, lower lows in price and higher lows in the RSI suggest the presence of a bullish divergence—an imbalance in recent selling momentum. This could create an opportunity for short-term bullish corrections to emerge.
Key Levels to Watch:
20.33 pesos per dollar: A key resistance level, aligned with the 100-period moving average. A return to this area could reactivate the previous range.
20.00 pesos per dollar: Another important resistance, now acting as a potential retest zone after previously serving as support. This could be a target for short-term pullbacks.
19.33 pesos per dollar: A significant support level, aligned with the neutral zone from September 2024. A move toward this level could reinforce the consolidation of a consistent bearish trend in upcoming sessions.
Written by Julian Pineda, CFA – Market Analyst

SEK/MXN 8H SHORT Selling Opportunity
Hello, I am Forex Trader Andrea Russo and today I want to talk to you about a SHORT selling opportunity on SEKMXN.
After careful technical and fundamental analysis, I decided to enter a SHORT position on the SEKMXN cross at the level of 2.0465. My strategy includes a profit target (Take Profit) set at 1.75%, while the protection level (Stop Loss) is set at 0.59% to manage the risk effectively.
Technical Analysis
The chart shows a clear bearish trend, supported by overbought signals on the RSI and MACD indicators. In addition, the price has recently tested a key resistance, suggesting a possible reversal.
Fundamental Analysis
From a macroeconomic perspective, the Swedish krona (SEK) is facing pressure from weak economic data, while the Mexican peso (MXN) benefits from a more stable economic environment and competitive interest rates.
Trading Strategy
Entry: 2.0465
Take Profit (TP): 1.75%
Stop Loss (SL): 0.59%
This setup offers an interesting risk/reward ratio, ideal for those looking for short-term opportunities with a calculated risk.
Conclusion
Forex trading requires discipline and rigorous risk management. This trade on SEKMXN represents an interesting opportunity, but as always, I recommend doing your own analysis before entering the position.
Happy trading everyone!

USDMXN: Mexican Peso Gains Strength and Approaches Key SupportOver the last six trading sessions, the USD/MXN price has dropped more than 3.5% as the Mexican peso has regained ground lost due to the ongoing conflict between Mexico and the White House. For now, the bearish bias has been driven by the March 6th extension on the tariff imposition, which gave the Mexican government a reprieve until April 2nd. This has allowed the Mexican peso to maintain a steady uptrend in the short term, sustaining selling pressure on USD/MXN.
Lateral Range:
Since early November 2024, USD/MXN has been oscillating within a sideways range, marked by a ceiling at 20.89 pesos per dollar and a floor at 20.07 pesos per dollar. The current bearish bias has pushed the price back to the lower boundary of the channel, and the weakening momentum of the last few sessions could reinforce the support barrier that remains intact.
ADX Indicator:
The ADX line has started showing consistent neutrality near the 20 level, suggesting that recent movements lack strong trend direction. This indicates that neutrality may persist as the price continues approaching the support level.
MACD Indicator:
The MACD histogram shows a similar scenario, with oscillations remaining very close to the neutral 0 level. This reinforces the current indecision in the market as the price approaches the support zone.
Key Levels:
20.43: Near-term resistance zone, aligning with the midpoint of the broad sideways range and converging with the 50- and 100-period simple moving averages. Sustained oscillations above this level could keep the sideways range active in the long term.
20.07: Crucial support zone, located at the lower boundary of the broad sideways range. Consistent oscillations below this level could break the current range and pave the way for a more prolonged bearish move in the coming sessions.
20.89: Distant resistance zone, marking the upper boundary of the sideways channel. If the price reaches this level, it could reactivate the forgotten uptrend.
By Julian Pineda, CFA – Market Analyst

USD/MXN: The Mexican Peso Weakens as New Tariffs Take EffectOver the last three trading sessions, the pair has risen by more than 2% in favor of the U.S. dollar as the threat of tariffs has become a reality. So far, President Trump has confirmed that the measures will take effect today, and there is currently no hope for another deadline extension.
The President of Mexico has traveled to the United States for an official meeting, but at this time, there are no expectations that the measure will be lifted in the short term. Given this, investors have determined that the U.S. dollar is likely the strongest currency to consider, especially if there is a potential economic slowdown in Mexico’s activity in the coming months.
Consistent Sideways Range
For now, USD/MXN remains in a sideways range, defined by a ceiling at 20.91 pesos per dollar and a floor at 20.07 pesos per dollar. The recent bullish momentum has once again tested resistance, and if upward pressure on the U.S. dollar remains strong, it is possible that the sideways channel could give way to an uptrend, which has remained dormant. It is important to note that the latest candlestick in the formation shows strong neutrality, highlighting the barrier imposed by the current resistance level.
ADX Indicator
At the moment, the ADX line has started an upward trend and is now above the neutral level of 20 on the indicator. This suggests that the average of bullish movements in recent trading sessions is becoming trend-defining. However, it is crucial that the ADX line continues to move away from the neutral level to confirm that buying pressure is strengthening in the short term.
Key Levels:
20.91: Major resistance, marking the upper boundary of the broad sideways range and acting as the most critical barrier for the latest bullish move. Breaks above this level could lead to new highs, ending the current consolidation phase.
20.43: Important support, aligning with the Ichimoku cloud barrier as well as the 50 and 100-period moving averages, highlighting the strength of this level. If the price falls below this point, the sideways range could extend further in the coming sessions.
20.07: Final support, positioned at the lowest price levels recorded in December 2024. If the price nears this zone, it could reinforce the bearish outlook, completely invalidating the long-term bullish trend.
By Julian Pineda, CFA – Market Analyst

USD/MXN Nears Critical Support LevelOver the past four trading sessions, USD/MXN has declined by more than 2% in favor of the Mexican peso. The current bearish move has brought the price closer to the lower boundary of the existing sideways range seen on the chart.
This recent selling pressure has been driven by mixed U.S. inflation data released last week and the lack of volatility in the U.S. dollar due to the U.S. holiday, allowing the peso to dominate the market in the short term.
Sideways Range Holds
At the moment, USD/MXN continues to trade within a well-defined neutral range between the 20.90332 resistance level and the 20.09472 support level.
So far, the bearish momentum has been strong enough to push the price closer to the key support zone, and as long as selling pressure persists, there is a higher likelihood of a downside breakout in the short term.
MACD Indicator
Currently, both the MACD lines and the histogram are crossing the neutral 0 level.
This could signal the start of fresh bearish strength if price action remains below this level in the coming sessions.
Selling pressure may gain further relevance as the histogram moves further away from the neutral zone.
TRIX Indicator
For the first time in months, the TRIX indicator is consistently approaching the 0 neutral level , reinforcing bearish dominance in the short term.
If the TRIX crosses below 0, the moving average bias could shift fully bearish, strengthening the peso’s momentum.
Key Levels to Watch
20.90332 – Key Resistance:
Major resistance level, marking the highest price levels reached in recent months.
A return to this level would confirm a recovery of bullish sentiment, reinforcing the current sideways channel.
20.43791 – Near-Term Resistance:
Coincides with the Ichimoku Cloud barrier and the 50-period moving average.
If the price retraces to this level, it could invalidate the current bearish pressure and open the door for a potential upside correction.
20.09472 – Critical Support:
Lower boundary of the current range.
If sellers break below this level, it could confirm the start of a new downtrend in the short term.
By Julian Pineda, CFA – Market Analyst

USD/MXN: Trump fears meet Banxico decision The USD/MXN should be an interesting pair to watch in the coming days.
October’s headline inflation in Mexico ticked up after two months of declines, yet analysts expect Banxico to proceed with a 25-basis-point rate cut this week regardless.
Last week’s volatile trading saw USD/MXN reach 20.80, as markets reacted to concerns over a second Trump presidency. His protectionist and immigration policies would place pressure on the peso.
However, for now, the pair’s uptrend may face hurdles. USD/MXN climbed to an intraday high of 20.57, but bullish momentum failed to break the year-to-date peak of 20.80, signaling possible resistance ahead.

USDMXN targeting 23.00 at least.The USDMXN pair has made a monumental long-term bullish break-out as not only did it recover its 1M MA50 (blue trend-line) in August but has also managed to close the last two 1M candles above it.
As you can see on this multi-decade chart, every time the pair broke above the 1M MA50, it rallied by at least +19.10%. At the same time, it is coming off the lowest ever 1M MACD Bullish Cross, while the price rebounded exactly on the 1M MA200 (orange trend-line).
As a result, our new long-term Target is 23.000.
-------------------------------------------------------------------------------
** Please LIKE 👍, FOLLOW ✅, SHARE 🙌 and COMMENT ✍ if you enjoy this idea! Also share your ideas and charts in the comments section below! This is best way to keep it relevant, support us, keep the content here free and allow the idea to reach as many people as possible. **
-------------------------------------------------------------------------------
💸💸💸💸💸💸
👇 👇 👇 👇 👇 👇

USDMXN Channel Up leading to 21.6500The USDMXN pair eventually gave us on our last analysis (June 27, see chart below) our desired bullish break-out above the multi-year Falling Wedge and the 1W MA200 and its next stop will most likely be our 21.6500 Target:
To view this trend from a more comprehensive perspective, we made today's analysis on the 1D time-frame. The prevailing pattern is a Channel Up, which as you can see is technically on its 3rd Bearish Leg.
Once it hits the 1D MA50 (blue trend-line) at the bottom of the Channel Up along with ideally the 1D RSI hitting its Support Zone, we will have the next short-term bullish signal. The Bullish Legs have so far been fairly symmetrical at a +15% rise. As a result our 21.000 Target is within the range of the expected rise ahead.
-------------------------------------------------------------------------------
** Please LIKE 👍, FOLLOW ✅, SHARE 🙌 and COMMENT ✍ if you enjoy this idea! Also share your ideas and charts in the comments section below! This is best way to keep it relevant, support us, keep the content here free and allow the idea to reach as many people as possible. **
-------------------------------------------------------------------------------
💸💸💸💸💸💸
👇 👇 👇 👇 👇 👇

Peso Pressure Ahead of Major MXN Events Mexico's inflation data will be released Thursday morning, closely followed by the Central Bank of Mexico's interest rate decision in the afternoon.
July's headline inflation in Mexico is expected to have accelerated to its highest level in over a year, according to a Reuters poll. However, the core index is anticipated to continue its moderation.
Rising prices in July could complicate any plans for the central bank to lower its key interest rate this week. In late June, the central bank opted to keep its benchmark interest rate unchanged after a rate cut in March, the first since mid-2021 when it began its tightening cycle.
The Mexican Peso has extended its losing streak to four consecutive days against the US Dollar, marking ten losses in the last eleven sessions.
The currency closed above the psychological 19.00 level for two days, having surpassed the previous year-to-date high of 18.99. Market momentum could favor sellers, with the Relative Strength Index indicating overbought conditions. The immediate resistance might stand at the current year-to-date high of 20.22.
On the downside, a breach of the 19.00 support level could open the path to the August stumble close to 18.50, followed by the 50-day Simple Moving Average at 18.20.

USD/MXN: Bullish Momentum Expected Amid Demand Area RetestThe USD/MXN currency pair is showing promising signs of a bullish continuation as it retests a recognized demand area. This zone has historically provided strong support and is now positioned to potentially fuel a further upward movement. Large speculators are currently on the bullish side, while retail traders remain bearish, reinforcing our positive outlook for the pair.
Our analysis indicates that the price is making a crucial retest of this demand area before resuming its upward trajectory. This retest is a typical technical pattern that often precedes a bullish continuation, especially when combined with the current market sentiment. The presence of large speculators on the bullish side suggests confidence in the potential for USD/MXN to rise, as these traders often have deeper insights into market trends and fundamentals.
Furthermore, seasonal patterns also support our bullish outlook for the USD against the MXN. Historical data shows that this period typically favors the USD, driven by a combination of macroeconomic factors and market dynamics. Seasonal trends can provide valuable context, enhancing the reliability of technical setups and market sentiment indicators.
Given these factors, we are closely monitoring the price action for a bullish continuation. The demand area retest, combined with bullish speculator positions and favorable seasonality, creates a compelling case for an upward move in USD/MXN. We are looking for the best entry points to capitalize on this potential rise, ensuring a strategic approach to maximize returns while managing risk.
In conclusion, USD/MXN is poised for a bullish continuation following the retest of a significant demand area. The alignment of technical indicators, market sentiment, and seasonal trends all point towards a favorable environment for the USD. Investors should be vigilant for entry opportunities as the price confirms its support and begins its anticipated ascent.
✅ Please share your thoughts about USD/MXN in the comments section below and HIT LIKE if you appreciate my analysis. Don't forget to FOLLOW ME; you will help us a lot with this small contribution.

Long on Mexican Pesos: Technical Indicators and Market AnalysisThe Mexican Peso has recently reached a Demand area that we have been monitoring for some time, and it has shown a strong rebound from this level. By examining technical indicators such as the Relative Strength Index (RSI) and Stochastic, we can observe that the Peso is currently in an oversold condition, suggesting a potential upward movement.
Furthermore, by analyzing the Commitment of Traders (COT) data, we see additional support for a bullish outlook. The seasonality trends of the Mexican Peso also align with this perspective, indicating that now is an opportune time to consider a long position.
Given these technical and seasonal indicators, we have decided to open a long position on this futures contract. The confluence of the oversold technical indicators, supportive COT data, and favorable seasonal trends provides a strong foundation for our bullish stance on the Mexican Peso.
✅ Please share your thoughts about Mexican Pesos in the comments section below and HIT LIKE if you appreciate my analysis. Don't forget to FOLLOW ME; you will help us a lot with this small contribution.

USDMXN Major long-term bullish break-out after 4 years!The USDMXN pair broke above the 4-year Falling Wedge and so far stopped the rise just before it tested the 1W MA200 (orange trend-line). The last time the pair had a similar long-term bullish break-out was on the August 01 11 break-out.
Following a 5-week consolidation, the price then extended the aggressive rise marginally above the 0.618 Fibonacci retracement level. As a result, we expect another strong bullish wave soon, and our Target is 21.6500 (exactly on the 0.618 Fib).
-------------------------------------------------------------------------------
** Please LIKE 👍, FOLLOW ✅, SHARE 🙌 and COMMENT ✍ if you enjoy this idea! Also share your ideas and charts in the comments section below! This is best way to keep it relevant, support us, keep the content here free and allow the idea to reach as many people as possible. **
-------------------------------------------------------------------------------
💸💸💸💸💸💸
👇 👇 👇 👇 👇 👇

Trade Like A Sniper - Episode 44 - USDMXN - (14th June 2024)This video is part of a video series where I backtest a specific asset using the TradingView Replay function, and perform a top-down analysis using ICT's Concepts in order to frame ONE high-probability setup. I choose a random point of time to replay, and begin to work my way down the timeframes. Trading like a sniper is not about entries with no drawdown. It is about careful planning, discipline, and taking your shot at the right time in the best of conditions.
A couple of things to note:
- I cannot see news events.
- I cannot change timeframes without affecting my bias due to higher-timeframe candles revealing its entire range.
- I cannot go to a very low timeframe due to the limit in amount of replayed candlesticks
In this session I will be analyzing USDMXN, starting from the 3-Month chart.
If you want to learn more, check out my TradingView profile.

USDMXN is approaching the main downtrendHey Traders, in today's trading session we are monitoring USDMXN for a selling opportunity around 16.67 zone, USDMXN is trading in a downtrend and currently is in a correction phase in which it is approaching the trend at 16.67 support and resistance area.
Trade safe, Joe.

USDMXN Strong sell opportunity on the 1D MA200.The USDMXN pair gave us a strong sell signal last time we looked at it (February 19, see chart below):
Now a new sell opportunity has emerged as it got rejected heavily at the top (Lower Highs trend-line) of the 2-year Bearish Megaphone pattern and is now trading mostly below the 1D MA200 (orange trend-line).
According to the RSI fractal, this price action is similar to the December 2022 consolidation that kickstarted a heavy decline with first stop the -0.382 Fibonacci extension. As a result, we turn bearish again, targeting 15.7500 (just above the -0.382 Fib).
-------------------------------------------------------------------------------
** Please LIKE 👍, FOLLOW ✅, SHARE 🙌 and COMMENT ✍ if you enjoy this idea! Also share your ideas and charts in the comments section below! This is best way to keep it relevant, support us, keep the content here free and allow the idea to reach as many people as possible. **
-------------------------------------------------------------------------------
💸💸💸💸💸💸
👇 👇 👇 👇 👇 👇

Fed keeps rates steady, Banxico up next The US Federal Reserve has kept interest rates steady at 5.25%-5.50% while continuing its balance sheet reduction as planned since May 2023.
In contrast, the Bank of Mexico (Banxico) might announce a rate cut tomorrow.
It's anticipated that Banxico could decrease its interest rate from 11.25% to 11%, potentially applying pressure on the Mexican peso. This could drive the USD/MXN rate closer to the 17.00 mark, diverging further from its 10-year low. Some Fib levels from its recent swing higher could also be some interesting, more assessable, targets
However, the possibility of a rate cut from Banxico is not guaranteed, given potential divisions within its Governing Council. Recent speeches by officials indicate a 3-2 split, with some members leaning towards a more accommodative approach, while others like Jonathan Heath and Irene Espinosa Cantellano favor a hawkish stance.

USDMXN Consolidation before strong decline.The USDMXN pair gave us the most optimal sell signal on our last analysis (October 09 2023) and after hitting our 17.0500 target, is consolidating:
This consolidation is on 1D RSI terms, similar to September 28 - October 28 2022, when the RSI Triangle broke downwards and with that, the price was detached from the 1D MA50 (blue trend-line) and aggressively declined to marginally over the -0.236 Fibonacci extension. As a result, we are taking now another sell with our Target at 16.200 (Fibonacci -0.236).
-------------------------------------------------------------------------------
** Please LIKE 👍, FOLLOW ✅, SHARE 🙌 and COMMENT ✍ if you enjoy this idea! Also share your ideas and charts in the comments section below! This is best way to keep it relevant, support us, keep the content here free and allow the idea to reach as many people as possible. **
-------------------------------------------------------------------------------
💸💸💸💸💸💸
👇 👇 👇 👇 👇 👇

MXNJPY Probably a short to 8.30I believe the area of 8.30 may be re-tested soon.
Probably just a support re-test.

USD/MXN going up?The pair has broken the down trend line and a probable up movement is expected. Take your profits early, as the pair is in a down trend since the Corona crisis.

USDMXN: Channel Up calling for pullback buy.USDMXN has converted the 1D MA200 to support and is rising steadily inside a Channel Up. The 1D technical outlook is neutral (RSI = 54.479, MACD = 0.196, ADX = 35.456) so once the current pullback towards the 1D MA50 and the bottom of the Channel Up, is completed, we will buy again and target a new +5.93% rise (TP = 18.8000). A 1D candle close under the 1D MA50, will be bearish, aiming at the S1 level (TP = 17.000).
## If you like our free content follow our profile to get more daily ideas. ##
## Comments and likes are greatly appreciated. ##
