Mxn

USD/MXN 1H Chart: Greenback likely to consolidateThe dominant pattern that has guided the USD/MXN exchange rate for the last six months is an ascending triangle. As apparent on the chart, the pair reversed from its upper boundary on December 25 and has since traded in a narrow channel down.
The US Dollar is currently stranded between two important support and resistance areas. The pressure from both sides might force the pair to consolidate in a narrow range in between their bounds.
If looking at a longer term, a test of the senior channel should result in a new period of price decline, especially given the pair’s steep appreciation during the past two months. Apart from the 200-hour SMA and the weekly S1, the rate also faces the support of the monthly PP and the weekly S2 near the 19.35 mark.


USD/MXN 1H Chart: Rate tests short-term channelUSD/MXN has been trading in a neat channel up for the last five months. The pair bounced off the bottom boundary of this medium-term pattern on November 29 and has since initiated a new wave up.
It is likely that the pair respects the current channel and thus continues appreciating during the following two weeks up to the 19.40 area. In the meantime, the US Dollar has been testing a junior channel for a couple of hours. Its failure to surpass the 18.98 area suggests that the rate could egde lower in this session.
The nearest resistance is set by the weekly R2 and the 55-hour SMA circa 18.87, while a more probable downside target is the 18.75 area where the 100-hour SMA and the weekly R1 are located.


USDMXN Bullish Extension Trading method: RSADVANTAGE Stage 5 system setup 95% accurate system manually forward tested over 3 years designed to stay out of ranging markets and only target strong trends. In this situation we are now waiting for Awesome Osci to go into positive territory for trade entry confirmation for movement to the downside. Market execution for entry, confirmation will be required for entry.
Risk Description: Once signal is confirmed 9000pips will be up for grab with small risk SL at swing low.
Profit expectations: 15 day trade length expected before hitting profit target I will post exit strategy when signal receives a exit signal.

USD/MXN 1H Chart: Symmetrical triangle prevailsThe US Dollar is trading in a symmetrical triangle against the Mexican Peso for the last month. The rate tested an eight-month high of 19.28 on two separate occasions during this time and has been subsequently moving away from this mark.
From technical point of view, the triangle should be breached to the upside. However, given the aforementioned high, this upward movement might prove to be limited.
Technical indicators suggest that the rate is unlikely to move dramatically during the following day or even a week. However, it is still expected that the flat down-trend could be preserved.
A possible downside target that the pair might approach during the following two weeks is the monthly PP circa 18.87.

USD/MXN 1H Chart: Channel narrowsOn September 7, the USD/MXN exchange rate entered an ascending channel. This pattern is a part of a longer-term ascending channel which has confined the pair since mid-July.
The rate’s trading range, however, has diminished during the last trading sessions, as apparent by its failure to overcome the 19.2662 mark—its highest level since mid-2015—on two separate occasions.
The US Dollar is currently testing the resistance of the weekly PP, the 55- and 100-hour SMAs at 19.15; the 200-hour SMA and the weekly S1 are located nearby circa 19.03. It is likely that bears pressure the Greenback during this week, resulting in a test of the lower channel boundary near the 19.00 mark.
In general, the rate’s subsequent movement could be tended southwards towards the bottom boundary of the senior channel.


USD/MXN breaches significant supportThe US Dollar has appreciated substantially against the Mexican Peso during the past three weeks. The pair managed to reach a five-month high at 18.83 on Tuesday evening. Subsequently, the Greenback edged lower and breached the diminishing trading range apparent since early October.
The given currency managed to move below a strong support cluster formed by the monthly R2, weekly R1 and the 55-hour SMA. These factors suggest a possible downside momentum that could push the rate towards the lower channel boundary circa 18.60/65.
A breakout of this line should be followed by a fall down to the weekly PP and the 200-hour SMA near 18.45.

USD/MXN sends mixed signalsUSD/MXN is trading in two channels simultaneously. The senior pattern is a rather chaotic channel that has confined the rate since late July. Meanwhile, the junior formation resulted from a consolidation period effective since September 6 when the US Dollar began trading between the monthly PP and S1 in the 17.84/17.62 area.
Two possible scenarios might occur. First, the rate surpassing the 200-, 100– and 55-hour SMAs might set the Greenback for a surge towards the monthly R1 at 18.10. As a result, both channel would be breached. Second, other technical indicators might still support a minor upward movement until the weekly R2 or R3, but eventually turn the rate south until the 100– and 200-hour SMAs and the weekly PP near the 17.72 mark are reached.

Mexican Pesos topping? My mexican Pesos index could be topping in what could be a first A wave coming after a long period of weakness. If so, B wave could be coming to the downside before a strong bounce to finish the correction.

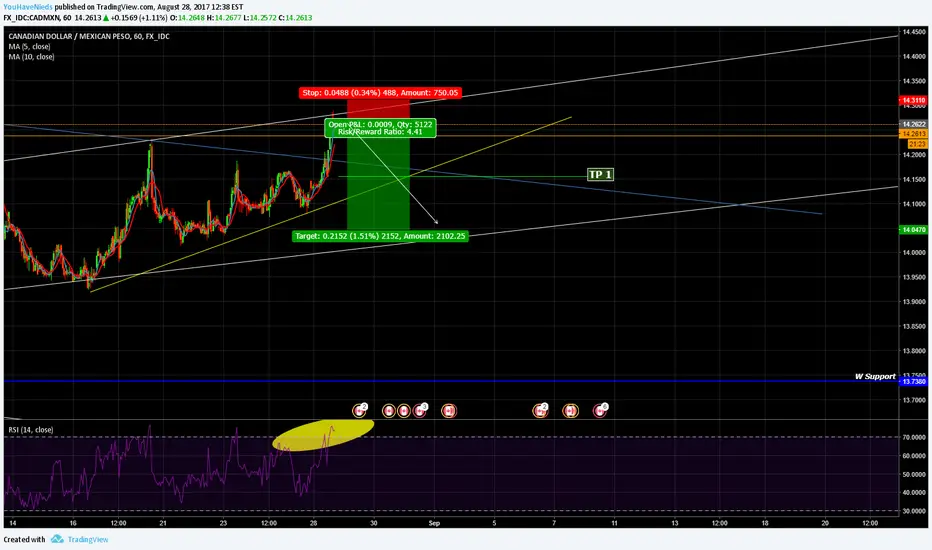
CADMEHICANNLets get EXOTIC! the pair is very volitile and it has the RSI at overbought. I am bearish on the pair and looking for a sell opportunity on shorter timeframes

USDMXN bearish impulse exhaustedUSDMXN has been ina bearish rally down to 2016 price. Nevertheless MACD is showing divergence which was nearly enough to break te threndline and start a pullback correction right above the trendline. Regarding this friday news the price closed right on top of the trendline and on a daily level (DL).
Depending on DXY and todays news price might break down to touch lower monthly level (ML) or start an impulse to reach upper Monthly level (ML)

XAGMXN Daily chartXAGMXN Daily chart
ABC pattern
EMA cross down
Fibonacci ratios fit for corrective moves, 8/2, 8/3

USDMXN ShortTaking advantage of recovering MXN and USD slide due to current sentiment on both currencies but more especially on USD. Sell on market or set up a sell stop with TPs at S2 and S3 pivot lines, and SL between S1 and base pivot lines.
www.ft.com
www.forexlive.com
www.fxstreet.com
D:
W:
Confidence: A

USDMXN Short 4HR ChartLook for shorting opportunities if prior support turns into resistance. On a fundamental side, NAFTA will start to be negotiated in less than two months. News regarding NAFTA can make this pair very volatile. Remember to use at least a 1:2 Risk/Reward ratio with proper risk management. I love Comments and Likes!!!
Collaboration? --->>>> traderkevin101@gmail.com

USDMXN : end of downtrend ?USDMXN
Now it is move to make wedge pattern,
We can wait it break up to buy , or wait it throwback to trendline for buy is ok.

A red week in store for MXNWith Banxico raising rates to 7% I think $16 is a possibility for the Peso in the coming weeks.
I posted about the Peso being oversold on Friday and longed it back to $18, however I am short for the rest of the week.