Mxn

MXNJPY technicaly based forecast
📌Short intro:
I am full time trader - analyst * High accuracy of ideas * Technicaly and Fudnamentaly side in analysis * Comment if have any questions or want to send support * Price action - FIBO - Candl pattern * FX - STOCK - CRYPTO * Simple ideas
💡 MXNJPY technicaly based idea, technicaly indicators showing we can expect higher recovery phase, we can see price is on border of supportive trend line, based on candels formation expecting to see break of trend line and push up in price till FIBO 0.382
📌Have on mind, trading involves risk, check idea on your own tactic, if have questions pls comment!
Thanks on supporting!
All best, good luck!

MXN lining up a bullish flag with a target of $32 MXN per 1 USD.I posted an idea on July 22, 2019 with my target at $29 pesos per 1 USD by August 2020. However, the new Mexican Government's poor economic choices along with the with the rise of the COVID-19 pandemic, have exacerbated the problem and consequently accelerate the peso's fall. Banxico has been intervening by selling USD in the open market in an effort to stopping the pesos fall. Consequently, how much of an intervention is Mexico's central bank able to afford? only time will tell.
Things don't look so promising though.
AMLO has cancelled an important contract with constellation brands after an initial investment was made.
Foreign investment is declining due to loss of confidence.
The cancellation of the lease of the presidential plane has not been done due to lack of funds.
Investments in the unprofitable and state run oil company PEMEX, the Dos Bocas refinery, and the Santa Lucia Airport, the creation of the national guard, plus numerous social programs are draining the economy heavily. In addition, a drop in GDP due to investor confidence, COVID-19, and poor economic choices do not paint a positive outlook for the peso and the overall Mexican economy.


USDMXN EDITEDTAL VEZ ESTABA VIENDO EL CANAL CON OTROS OJOS, ESPERAMOS QUE LA VELA DIARIA TERMINE Y SI SE MANTIENE EN EL CANAL POSIBLEMENTE PODREMOS BUSCAR ACCION DE PRECIO Y ENTRAR EN LONG HASTA LA PARTE SUPERIOR DEL CANAL .
LA ECONOMIA DE USA ES DEBIL SI, PERO LA DE MEXICO ES AUN MAS DEBIL, Y EL USD SIGUE SIENDO "LA CAMISA MAS LIMPIA DEL CANASTO" COMO ALGUNOS DICEN, DENTRO DE TODO ES UNA ECONOMIA FUERTE Y HA BAJADO SUS TASAS AUN MAS PARA SOPORTAR LA CRISIS.

USDMXN Pattern like the 2008 crisis. Opportunity for +15% profitThe pair made a strong Parabolic Rise in March pushing the 1D chart to its limits. Now technicals have found a normal balance (RSI = 58.931, MACD = 0.972, ADX = 49.001) as the price is trading on a range. This is similar to the 2008 trading pattern of the Mortgage Crisis, when after a Parabolic Rise, USDMXN entered a range (was an Ascending Triangle then) before a new Top.
So far it appears the the COVID pandemic is repeating the same psychological patterns of the 2008 Mortgage Crisis. QE and stock market fear are the key factors. If USDMXN repeats the whole sequence then we can expect the next Top to be roughly +9% from the current one which makes for a $28.00 target. That is roughly a +15% profit opportunity from the current levels.
** If you like our free content follow our profile (www.tradingview.com) to get more daily ideas. **
Comments and likes are greatly appreciated.

MXN JPY BUY (MEXICAN PESO - JAPANESE YEN)Hi there. Price is forming a reversal pattern to change its formation. Wait for the price to complete the pattern and watch strong price action for buy.


USD MXN SELL (US DOLLAR - MEXICAN PESO)Hi there. Price is forming a continuation pattern to the downside. Wait for the price to complete the pattern and watch strong price action for sell.

USDMXNHi all,
we have two important support zone,
we offer that wait for watch price reaction,
also my idea that usdmxn is bullish!

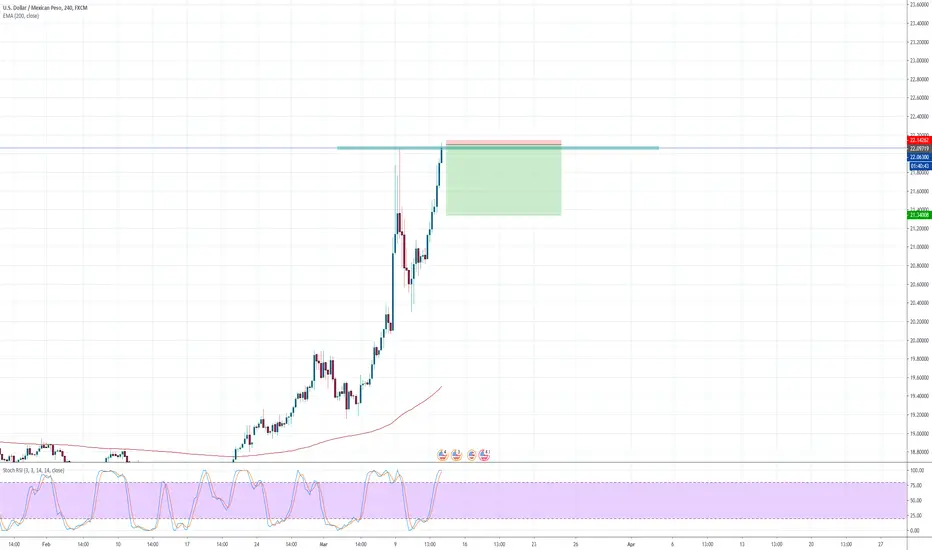
USD / MXN ! Bullish dumpUSD / MXN was one of the biggest devaluations in these days
Price should retrace to the 21.5-22.2 level and then continue the bullish trend

MXN JPY BUY (MEXICAN PESO - JAPANESE YEN)Hi there. Price is moving impulsively to the upside. Wait for the price to form a continuation pattern on a lower time frame and watch strong price action for buy.

USDMXN Sell SHort Term Hi All ,
We opening a short term sell on this pair , nothing too dramatic , 50-100pips with 160pips extension . We might apply some recycling process , if trades halt to refill the wick . Sl into entry when price move 30pips into direction and adjust accordingly.
Many thanks

Short Modernity, Long Tradition.The only reason the time frame is so low is because I simply do not have enough data to work off otherwise, but I'm going to wager that the Swedish Kronor depreciates against the Mexican Peso, being that the Kronor is backed by a pro-immigration millennial gubment amidst a global pandemic while the Peso has both trumpbux repatriation efforts and a government that is actively shutting down borders as stimulus programs.
Should the value of Swedish fiat be more than 1.5x that of the small dollar? I mean peso?
Think of this as an investment in MXN against Sweden, the weakest pair I could figure, not the other way around.
Especially into the warmer months.
Who am I to counter-trade HA trend?

USDMXN short opportunityusdmxn has reached a strong resistance line and I expect a fall.....however keep a tight sl as if it continues it can rise a lot more.
Mexican Peso to $29 MXN per 1 USD by August 2020???The Peso is currently in a sideways consolidation perhaps due to investors awaiting the outcome of Mexico's current monetary policies by the new administration. However, current trend points to an exchange rate of about $ 29 Mexican pesos to 1 US dollar by August of 2020. Could the president's new policies contribute to the country's economic decline? Only time will tell.

MXNJPY exepcting higher bearish continuation technicaly based
ENTRY: 5.5100
TP: 5.4500
TP2: 5.4000
TP3: 5.3500
SL: 5.5930
Chart time frame - 1D
Time for reaching TP - 1-2D
Follow, Like, Share or Comment
Thanks on supporting!
All best!

USDMXN expecting higher bearish market continuation
ENTRY: 19.20500
TP: 19.10000
TP2: 19.00000
TP3: 18.90000
SL: 19.40000
Chart time frame - 1D
Time for reaching TP - 1-3D
Follow, Like, Share or Comment
Thanks on supporting!
All best!


USD Bullish to Mexican PesoBullish signal ! pattern Head and Shoulders on US dollar - mexican peso currency pier. Target 18,6848.


