CAKE/USDT in a Position For a Bullish Reversal? 👀CAKE Analysis💎Paradisers, let's dive into #CAKEUSDT as it's positioning itself for a bullish rebound off its support zone, indicating a potential upward shift.
💎With #PancakeSwap moving within an ascending channel pattern, it's approaching a critical moment at the $2.54 support level. The observed reduction in volume at this juncture suggests a continuation of the bullish trend from $2.54, with an increase in volume hinting at a possible momentum change.
💎However, if #CAKE's price dips below this key support, it's time for a strategic shift. We're bracing for a bullish bounce off the lower support at $1.78. A failure for NASDAQ:CAKE to mount a bullish effort from this point could lead to further decline.
💎Keeping a pulse on the #CAKE market movements and being ready to tweak our strategies is crucial as we steer through its unfolding patterns.
Mycryptoparadise

IOTA/USDT It need to bounce on the demand for back to upward!💎 IOTA has recently experienced significant market dynamics, potentially leading it back to the demand zone for a retest after facing a strong rejection from the key resistance area.
💎 If IOTA manages to bounce convincingly from the demand zone, it could signal a resurgence in bullish momentum. This bounce might pave the way for another attempt to break above the key resistance area.
💎 A successful breakout above this level would confirm a bullish trend for IOTA and could facilitate a move towards our target area.
💎 However, if IOTA fails to find support at the demand zone and continues to decline, the next significant level to watch is the support area. In this scenario, IOTA must bounce from the support area and reclaim the price above the demand zone to sustain any upward momentum.
💎 Should IOTA fail to bounce from the support area and instead break below it, it could indicate further downside potential for the price, with the possibility of continued downward movement.

INJ/USDT Break Alert! Keep an eye on the support area.💎 INJ has recently undergone significant market dynamics, notably breaking the support trendline of the bearish flag pattern.
💎 This break may lead to a retesting phase, potentially driving the price downwards towards the support area around $25.3, reminiscent of the previous all-time high (ATH) level.
💎 For traders seeking a buying opportunity, waiting for the price to reach the support area or the weekly order block (OB) between $19.3 and $14.6 could be advantageous.
💎 These zones may act as strong support levels, potentially leading to a significant bounce in the price. Such a bounce could pave the way for a subsequent move towards the strong resistance area after another retest.
💎 However, if INJ fails to exhibit significant bullish momentum upon reaching the weekly OB and instead shows signs of consolidation with weakening volume, it could signal a bearish scenario.
💎A confirmed breakdown below the OB might indicate a shift in market sentiment towards bearishness, potentially resulting in a sustained downward movement.

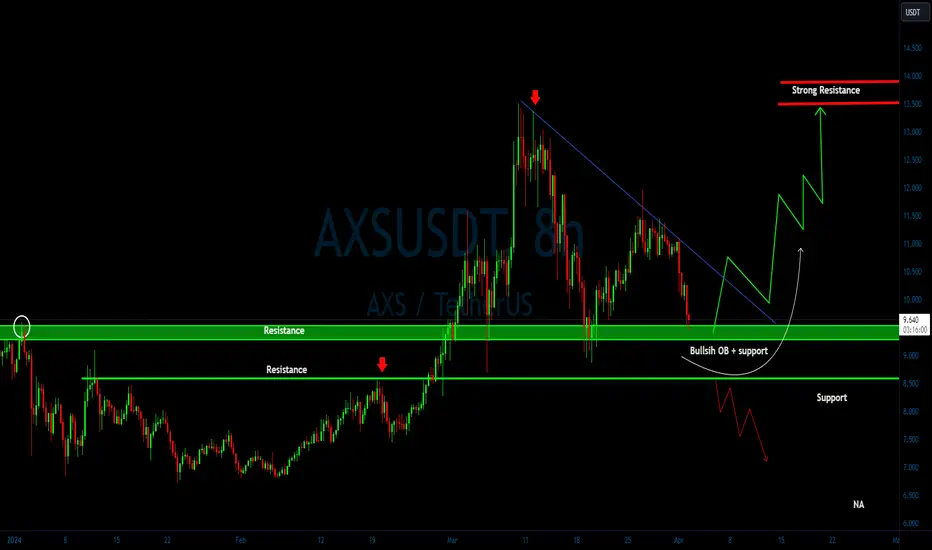
AXS/USDT bullish horizon from support? 👀🚀AXS Today analysis💎 Paradisers, let’s delve into the intriguing movement of #AXSUSDT. Presently, it’s engaged in a delicate dance, retracing and meticulously retesting a critical support level at $9.379. This level holds immense significance, and its ability to transition from a mere retest to a robust support could be the harbinger of a potential bullish surge.
💎 After a triumphant escape from the clutches of a descending channel, the price of #AXS now approaches the key support level at $9.379. If it maintains its momentum at this crucial juncture, we may witness a delightful bullish reversal. Picture it: the price ascending, breaking free like a phoenix from the ashes.
💎 But ah, the markets are fickle, my friends. Should the price of NYSE:AXS dip below this pivotal zone, our strategy must adapt. Brace yourselves! We anticipate a bullish rebound from the secondary support level at $8.578. Failure to reclaim ground here could spell further declines. So, stay vigilant, stay nimble, and let’s navigate these market fluctuations with grace and precision
LUNA/USDT upward momentum from support? 🚀LUNA Today Analysis💎 Paradisers ,keep an eye on #LUNAUSDT as it’s currently in motion. The price is approaching a key support level at $0.9163. If it maintains momentum at this level, we could witness a bullish reversal. The sustained upward movement aims to target the major resistance at $1.4997.
💎 However, let’s be prepared for market fluctuations. Should #LUNA encounter obstacles at the aforementioned resistance, it might be prudent to reconsider our strategy. On our radar is a bullish recovery from the support zone around $0.8014, where the price has previously found stability.
💎 Caution is crucial! A breach below this critical support level could signal a shift toward a stronger bearish trend, potentially leading to increased selling. As we navigate the changes in the #LUNA market, staying vigilant and adaptable is paramount.

XRP//USDT bullish continuation from support? 🚀XRP Analysis💎 Paradisers, take note of #XRPUSDT as it unveils an intriguing pattern. Our focus lies on key resistance levels, which could potentially pave the way for a bullish continuation from the critical support at $0.5710. We remain vigilant, awaiting the opportune moment to execute our strategy.
💎 In the event that $RIPPLE loses momentum at the support level, we envision a bullish scenario: a rebound from the lower support at $0.5426. This level boasts substantial liquidity, evident from previous robust upward movements and significant green candles.
💎 However, should the price dip below this secondary support, it may signal a shift toward bearish territory, accompanied by increased selling pressure. As we closely monitor the #XRPCOMMUNITY market behavior, staying alert and adaptable is crucial.

AEVO/USDT Breakout Alert! Ready for continue the upward movement💎 AEVO has recently demonstrated significant market dynamics by breaking out of the falling wedge pattern after bouncing from the support area.
💎 Currently, the price is in the retesting phase on the trendline, indicating a potential continuation of the upward movement. AEVO can reach the maximum target pattern area.
💎 However, if AEVO fails to sustain its upward momentum, it may retreat to test the support around the $2.7 area to gather new momentum.
💎 The support level is crucial for AEVO, as a successful bounce from this level is necessary to maintain the upward trajectory. However, if AEVO fails to bounce and breaks below the support, it could signal a shift to bearish sentiment, leading to further downward movement.

MTL/USDT In this support area, need to bounce for continue UP!💎 MTL has recently exhibited significant market dynamics, with a notable bounce from the support area. However, it appears that the price is poised for a back test of this support level.
💎 If MTL manages to rebound from this support, there is potential for the price to resume its upward trajectory and continue towards a retest of the strong resistance area.
💎 On the other hand, if MTL fails to demonstrate strength by either failing to bounce from the support area or breaking down below it, there is a possibility that the price may descend to the demand area around 1.345.
💎 It's crucial to monitor how MTL reacts around the demand area. A successful bounce from this level is imperative as it signifies robust support. However, if MTL fails to sustain itself above the demand area, it could signal further downward movement.

ATOM/USDT Primed for an Exponential Rally? 👀🚀ATOM Analysis💎Paradisers, it's time to zone in on #ATOMUSDT as it gears up for a potential bullish turn from its support zone, signaling a promising uptick.
💎Riding the waves of an ascending channel, MYX:COSMOS stands on the brink of testing the support level at $10.19. A notable decrease in volume at this crucial point hints at the likely extension of the bullish trajectory from $10.19, underscored by a volume spike suggesting a momentum shift could be on the horizon.
💎Conversely, if #ATOM's price breaks below this pivotal support, a strategic recalibration will be in order, as we anticipate a bullish resurgence from the next support level at $8.87. Should NASDAQ:ATOM struggle to initiate a bullish phase from this juncture, a further descent may be inevitable.
💎Staying ahead requires vigilance and adaptability as we navigate the evolving dynamics of the #ATOM market, prepared to adjust our strategies accordingly.

FTT/USDT Ready to Resume its Bullish Journey? 👀🚀 FTT Analysis💎Paradisers, keep an eye on #FTTUSDT. It’s at a key point, testing the support at $1.65. If it keeps going up, we could see a price jump.
💎The first resistance target is at $2.39 for the FTT. If the asset manages to Break this level it could lead to even bigger gains.
💎If #FTXToken starts to drop at this support level, we’re ready for a bounce back from a deeper support at $1.40. This area is known for its high trading volume and has often led to big upward moves for $FTT.
💎If the price falls below this extra support level, it could mean a shift to a bearish market, with more selling. Stay alert and flexible as we follow the changes in the #FTT market.
Disclaimer : The token, #FTT, is associated with the FTX exchange. Please proceed with caution and conduct thorough research before trading.

AGIX/USDT bullish reversal from support ? 👀🚀AGIX analysis💎Paradisers, let’s delve into the movement of #AGIXUSDT. Currently, it is retracing and retesting a critical support level at $1.17643. This level holds significant importance, and its ability to transition from a retest to a firm support could signal a potential bullish move.
💎 After successfully breaking out of a descending channel, the price of #AGIX is now approaching the key support level at $1.17643. If the price sustains its momentum at this level, we can expect a bullish reversal. With sustained upward momentum, the target lies above the strong resistance at $1.48693.
💎 However, should the price of SEED_DONKEYDAN_MARKET_CAP:AGIX dip below this pivotal zone, it’s crucial to adapt our strategy. We anticipate a bullish rebound from the secondary support level at $1.10437. Failing to regain ground here could potentially lead to further declines. Stay vigilant and agile as we navigate market fluctuations.

ETH/USDT should price respect support? 👀🚀ETH analysis💎 Paradisers, the #ETHUSDT pair is currently exhibiting notable strength, suggesting a potential bullish reversal from its support level at $3,449.06. If the price maintains its momentum at this level, there is a significant likelihood of a bullish upswing that could surpass the nearby resistance at $3,672.
💎 Taking a historical perspective, Ethereum (ETH) has consistently followed a downward trend, frequently encountering resistance around the $3,672 mark. We anticipate that the price may revisit the support level at $3,449.06 before embarking on a further bullish trajectory. Interestingly, this level has been respected twice in the past.
💎 In the event that ETH faces challenges in maintaining its momentum at the $3,449.06 support, we expect a bullish recovery from the lower support zone around $3,274. However, a breach below this point could potentially lead to additional declines. Let’s remain vigilant and be prepared to adapt our strategies as needed.

BTC/USDT exploration of next potential move? 👀🚀BTC analysis💎Paradisesr, it’s time to delve into the movement of the king of cryptocurrencies, #BTCUSDT. As we observe its behavior, we notice an intriguing pattern following both high and low trajectories. If the price manages to maintain strong bullish momentum at the obvious support level (Ob), we can anticipate a price breakout, surpassing previous highs and setting new targets at Fibonacci levels.
💎However, let’s also consider an alternative scenario: if the price #BITCOIN loses momentum at the Ob and drops below it, the probability of a breakdown from the recent low becomes more likely. In this case, the price could directly touch the FVG level of $56,632, which holds substantial liquidity. As savvy traders, we remain vigilant and take action based on price movements.
💎Furthermore, there’s another intriguing level below the FVG a flagged zone and an Ob level which appears on the weekly timeframe. The presence of double dollar signs ($$) emphasizes its significance. We must keep a close eye on this level, as breaching CRYPTOCAP:BTC could lead to a significant downward move

BCH/USDT bullish reversal from key support? 👀 🚀BCH analysis💎 Paradisers, brace yourselves for a thrilling trading expedition with #BCHUSDT, currently anchored at a critical support area, signaling a potential shift in market dynamics.
💎 Its breakout from a downward trendline heralds a promising path ahead for #BITCOINCASH, igniting a bullish momentum poised for an upward journey. Should this vigor continue, we anticipate challenging the $535.7 resistance zone as our forthcoming milestone.
💎 Should the momentum of SET:BCH show signs of diminishing, we're set to observe a robust recovery attempt from the crucial support mark at $229. However, slipping past this vital line may denote the start of a more decisive bearish phase, emphasizing the need for vigilance in the evolving market landscape.

MNT/USDT Gearing up for an Explosive Rally? 👀🚀MNT Analysis💎Paradisers, turn your gaze to #MNTUSDT, currently in a demand zone, hinting at a potential bullish breakout.
💎At the moment, #Mantle is on a rising path, indicating a bullish phase around the $0.741 support zone. This pattern aligns with an ascending channel, consistently finding support within the channel across several instances. If the momentum is maintained, we're poised for a dynamic bullish push towards the $1.30 supply zone.
💎However, if #MNT encounters difficulty in keeping up its bullish posture at the $0.741 mark, it might prompt us to reassess our strategy. This could lead us to look for a bullish response from a slightly lower demand area at $0.582.
💎Keeping alert to these market movements is critical, as a drop below this crucial point may call for a recalibrated approach, especially amidst challenges to continue the bullish momentum in the #MNT market.

BADGER/USDT Ready to Create a Buzz in the Market Again? 👀🚀💎Paradisers, turn your gaze towards #BADGERUSDT, perfectly situated in a demand zone, setting the stage for an expected bullish surge.
💎Currently, #BadgerDAO is charting an ascent, showcasing a bullish demeanor around the $4.2 support zone. It's navigating an ascending channel pattern, reliably finding support within the channel on two distinct instances. Maintaining its current momentum could lead to a strong bullish push, aiming for the higher supply zone at $9.3.
💎However, if #BADGER encounters difficulties in keeping its bullish posture at the $3.68 support level, a strategy reassessment might be in order. This would lead us to anticipate a bullish response from a slightly lower demand zone at $2.5.
💎Staying attuned to these market changes is crucial, as a descent beneath this pivotal point may call for a recalibrated approach, especially amid challenges in maintaining the bullish drive within the #BADGER market.

ZEN/USDT Ready to Ride after a Price Reset? 👀🚀ZEN Analysis💎Paradisers, let's take a moment to assess #ZENUSDT, which has been navigating through a descending channel, revealing dynamic market trends.
💎At this juncture, #Horizen is making strides towards the descending resistance, propelled from the demand zone. This sets the stage for a potential rebound from this zone, potentially initiating an upward trajectory, with sights set on the bearish Order Block (OB) as the upcoming milestone.
💎However, should LSE:ZEN not achieve the anticipated bounce and instead descends below the demand zone, we might witness a fallback to the Bullish OB region around the $9.52 mark, where it could rally for another upward attempt.
💎The Bullish OB zone has historically been a pivotal area for catalyzing significant market recoveries upon engagement. Yet, a failure of this zone, indicating a shift towards bearish trends, may lead to a continuation of bullish momentum from a diminished position.
💎In case #ZEN doesn't harness the momentum from this or any subsequent level, a persistent decline might ensue. Rest assured, Paradisers, your ParadiseTeam is vigilantly monitoring these shifts, ready to navigate you through these intricate market dynamics.

ICP/USDT Gearing Up for a Bullish Rally? 👀🚀ICP Analysis💎Paradisers, let's focus on #ICPUSDT, which is currently showcasing exciting market movements within an ascending channel.
💎At the moment, #InternetComputer is making its way towards the ascending resistance, originating from the demand zone. This opens up the possibility for the price to rebound from this zone and embark on an upward trajectory, aiming for the bearish Order Block (OB) as its next objective.
💎However, if CRYPTOCAP:ICP does not manage to rally and instead dips below the demand zone, we might see a pullback to the Bullish OB region around the $10.878 mark, where it could find renewed energy for an upward push.
💎The Bullish OB zone has historically been a crucial point for initiating significant market recoveries upon testing. Yet, a failure of this zone, signaling a bearish trend, may lead to a continuation of bullish momentum from a more subdued position.
💎In the event that #ICP doesn't harness the momentum from this or a further reduced level, a continued decline may follow. Rest assured, Paradisers, your ParadiseTeam is closely watching these developments, ready to offer support and guidance through these market shifts.

COS/USDT is in Great Position to Rally? 👀🚀COS Analysis💎Paradisers, let's delve into #COSUSDT, showcasing dynamic market movements within an ascending channel pattern.
💎Currently, #Contentos is making strides towards the ascending resistance, emanating from the demand zone. This offers a chance for the price to rebound from this area and pursue an upward trajectory, setting its sights on the bearish Order Block (OB) as the next checkpoint.
💎However, If FWB:COS does not achieve the rebound and instead falls beneath the demand zone, we might witness a pullback to the Bullish OB vicinity around the $0.006020 mark, where it could gather renewed energy for an ascent.
💎The Bullish OB zone has historically been a critical point for catalyzing significant market recoveries upon engagement. Yet, a compromise of this zone, indicating a shift to bearish trends, may necessitate a pursuit of bullish momentum from a lower position.
💎In the event #COS doesn't harness the momentum from this or a further reduced level, a continued decline is anticipated. Rest assured, Paradisers, your ParadiseTeam is closely observing these shifts, prepared to offer guidance and insights through these evolving market dynamics.

APT/USDT Ready to Claim its Thrown? 👀🚀Aptos Analysis💎Paradisers, let's examine the recent market trends for #APTUSDT, which has impressively broken free from its descending channel pattern.
💎At this moment, #Aptos is advancing towards the descending resistance from within the demand zone. This situation presents a chance for the price to rebound from this area and embark on an upward journey, aiming for the bearish Order Block (OB) as its forthcoming milestone.
💎If AMEX:APT does not achieve the anticipated bounce and instead dips below the demand zone, we could see a fallback to the Bullish OB region around the $7.57 mark, where it would seek rejuvenated impetus for an ascent.
💎The Bullish OB zone has historically been a key factor, reliably initiating significant market recoveries upon interaction. Yet, a failure of this zone, indicating a shift towards bearish trends, may lead to a pursuit of bullish momentum from a more subdued position.
💎In case #APT doesn't harness the momentum from this or any subsequent level, a continued descent might ensue. Rest assured, Paradisers, your ParadiseTeam is vigilantly monitoring these developments, ready to offer insights and guidance through these market shifts

RVN/USDT Gearing up for a Bullish Rally? 👀🚀RVN Analysis💎Paradisers, let's take a closer look at #RVNUSDT, where the current market trends hint at a potential bullish reversal from an essential support area.
💎A glance at #Ravencoin's trading history reveals a significant 80% drop from its previous high. However, the steadfastness at the $0.02024 support level suggests an opportunity for an upward movement.
💎The journey to achieve new highs or surpass previous records has been fraught with challenges, leading to a prevailing bearish sentiment. Yet, the pivotal $0.02024 threshold for NGM:RVN is on the cusp of catalyzing a substantial bullish wave upon further assessment.
💎With a mindset geared towards adaptability, we've outlined a backup plan. If #RVN dips further from this foundational support, we foresee a bullish revival from the secondary support at $0.01596. It's vital to acknowledge, however, that descending below this marker could signal a deeper bearish trend.
💎Maintain adaptability in your trading strategies and stay alert to market shifts, Paradisers. Be assured, the ParadiseTeam is diligently observing these developments, ready to guide you through the evolving market scenarios.

QNT Ready to Take its Bullish Trajectory? 👀🚀QNT Analysis💎Paradisers, let's take a closer look at #QNTUSDT, where the latest market trends offer a glimmer of hope for a bullish resurgence from a pivotal support area.
💎Reflecting on #Quant's recent trading activity, we've witnessed a significant 45% fall from its recent zenith. However, the steadfastness at the $101.5 support level suggests a doorway to an ascending trajectory.
💎The challenge of achieving new heights or surpassing previous benchmarks has led to a prevailing bearish sentiment. Yet, the crucial $101.5 threshold for GPW:QNT is teetering on the edge of catalyzing a notable bullish shift upon another assessment.
💎In our arsenal, we always have a backup plan. If #QNT dips further from this foundational support, we anticipate a bullish revival from the secondary support at $88.2. It's essential to recognize, however, that a breach below this point could indicate a prolonged bearish trend.
💎Maintain adaptability in your trading strategies and keen observation of market shifts, Paradisers. Rest assured, the ParadiseTeam is diligently tracking these movements, ready to navigate you through the unfolding market scenarios.

UTK/USDT Ready for an Explosive Journey? 👀🚀UTK Analysis💎Paradisers, let's explore the dynamics of #UTKUSDT, where the landscape indicates a ripe opportunity for a bullish turnaround from an essential support area.
💎A glance at #xMoney's trajectory shows a pronounced 60% reduction from its recent high. Yet, the fortitude at the $0.077 support level sparks hope for a potential rebound.
💎The journey to surpass previous highs or achieve new milestones has been fraught with challenges, leading to a short-term bearish sentiment. Nevertheless, the critical $0.077 threshold for $UTK is on the cusp of initiating a substantial bullish wave upon another assessment.
💎Ever vigilant and prepared, we have devised a Plan B. If #UTK dips further below this foundational support, we foresee a bullish revival starting from the secondary support at $0.0621. It's pivotal to recognize that a descent below this mark could signal a deeper bearish trend.
💎Keep your trading strategies flexible and your senses attuned to market shifts, Paradisers. Rest assured, the ParadiseTeam is closely monitoring these developments, ready to guide you through the evolving market landscape.
