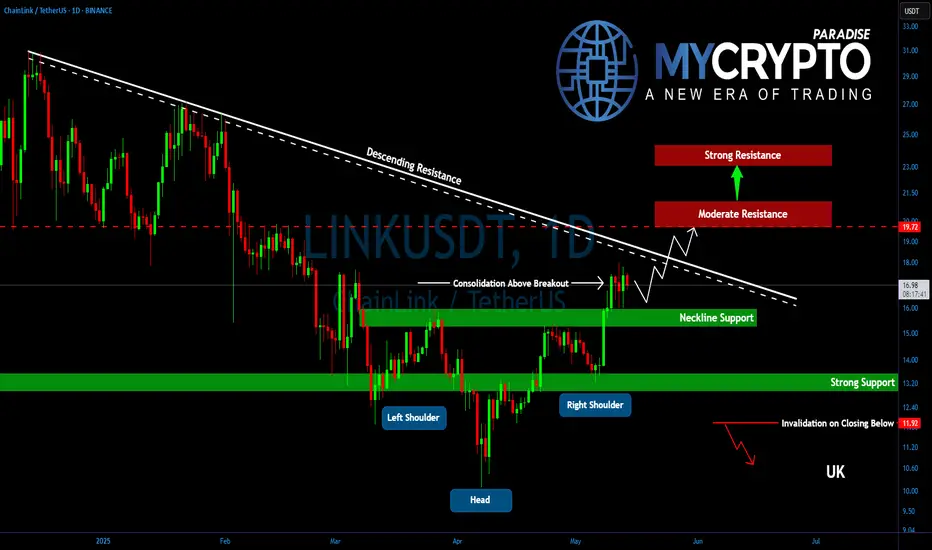
Is LINK Preparing for a Parabolic Rally? Key Levels to WatchYello, Paradisers! After completing its ABC correction, #LINK slipped into a sideways phase — but something significant is brewing beneath the surface. The recent formation of an inverse head and shoulders might be signaling the start of something much bigger.
💎LINK has now confirmed a breakout above the key neckline at $16.00, a critical level that had been capping price action. Following this breakout, the price is holding its ground well and entering a post-breakout consolidation that often acts as the launchpad for the next explosive leg.
💎#LINKUSDT now faces a decisive resistance at $18.50, a trendline rejection point that has held strong since December 2024. A clean break above this level could ignite strong bullish momentum. If bulls succeed, we could see LINK pushing quickly toward the $19.70–$20.30 range, a moderate resistance area, where partial profit-taking is likely from experienced hands.
💎Should momentum persist, the next major upside lies between $23.25–$24.00, the measured target of the inverse head and shoulders breakout. This zone is not just technically significant due to the pattern, it also aligns with the 61.8% Fibonacci retracement, making it a high-confluence resistance.
💎On the downside, LINK has strong support between $16.00–$15.50. This is not only the breakout neckline but also closely aligned with the 50 EMA and 200 EMA, reinforcing this range as a robust demand zone.
Paradisers, strive for consistency, not quick profits. Treat the market as a businessman, not as a gambler.
MyCryptoParadise
iFeel the success🌴
Mycryptoparadise
NEAR Breakdown Confirmed! More Blood Before the Reversal?Yello, Paradisers! Is #NEAR about to drop even lower, or is a major reversal brewing? Let’s break it down!
💎#NEARUSDT recently suffered a descending triangle breakdown, sending prices tumbling lower. Adding to the bearish pressure, we’ve also got a death cross formation, reinforcing the weakness in price action. Right now, before NEAR can find any long-term bottom, the probability of further downside remains high.
💎The bulls are currently struggling. Multiple resistance levels are blocking any attempts to gain momentum, with all EMAs currently sloping downward—not a good sign for any immediate recovery.
💎NEAR is expected to slowly bleed into the long lower wick of February 3rd. Strong support exists between $2.65 and $2.40, a key demand zone that could trigger a bullish reversal. But if sellers continue to dominate, they could overpower this level and drive prices down further toward $2.05 - $1.95. This is a major higher time frame support zone, where a long-term reversal could finally take shape.
💎For the bulls to negate this growing pressure, they must break above $4.50—a critical level reinforced by both horizontal and descending resistance. If the price secures a bullish breakout above this, NEAR could be in a prime position to rally over the next few months.
Paradisers, as always, patience and precision are key in this market. This isn’t a time for reckless trades—let the levels guide you, trade strategically, and stay disciplined.
MyCryptoParadise
iFeel the success🌴

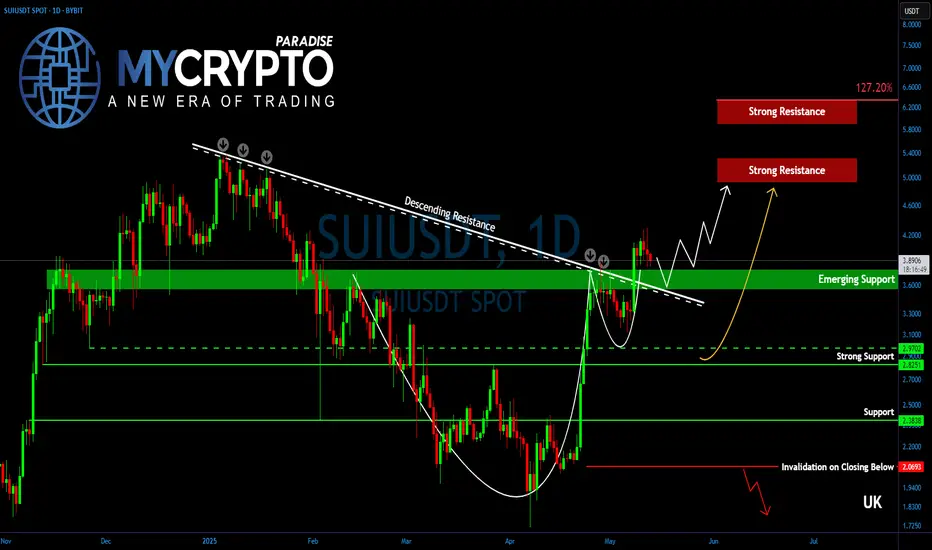
SUI Ready to Explode? Here’s What Happens NextYello, Paradisers! Is #SUI preparing for a fresh 52-week high? With a powerful pattern breakout and a golden cross in play, this could be the beginning of something big.
💎#SUIUSDT remains one of the strongest-performing altcoins in the current market cycle. The chart structure is now showing a cup and handle formation, paired with a clean breakout above a long-term descending trendline resistance—a combination that typically precedes strong bullish momentum.
💎At this stage, SUI is solidifying a newly-formed support zone between $3.80 and $3.60. If this support continues to hold, bulls are likely to drive price higher toward the $4.20 target, followed by a push into the $5.00 to $5.30 zone. This range marks the first major resistance cluster, as well as the previous all-time high region, and may trigger aggressive short-term profit-taking.
💎However, if bullish momentum remains intact, SUI could continue its rally toward the 127.20% Fibonacci extension level at $6.30. This is where caution becomes essential, as it represents a major technical target where price could stall or reverse.
💎Adding fuel to the fire, SUI has also confirmed a Golden Cross formation on the daily timeframe, with the EMA-50 crossing above the EMA-200. This is a powerful trend reversal signal that often acts as a driving force behind prolonged bullish movements.
Paradisers, strive for consistency, not quick profits. Treat the market as a businessman, not as a gambler.
MyCryptoParadise
iFeel the success🌴
Is PEPE About to Explode? Critical Breakout Level Incoming!Yello, Paradisers! Are you ready for what could be the breakout #PEPE bulls have been waiting for since February?
💎After a long, painful downside grind, PEPE is finally shaping up for a potential bullish reversal. The price action has entered an ascending triangle, often a reliable pattern that hints at an incoming breakout. This setup is now flashing signals that momentum is shifting but it all hinges on one critical zone.
💎#PEPEUSDT is currently eyeing the $0.0000088 – $0.0000090 region, a heavy resistance that’s proven itself multiple times since February 24th. Bulls have failed to conquer this level on several occasions, and now, the 12-hour EMA-200 is also sitting in this area, a dynamic resistance reinforcing this as a crucial inflection point.
💎If the bulls can finally break through $0.0000090 with clear volume confirmation, PEPE could open up upside potential towards $0.00001135. This level is likely to attract some short-term profit-taking, but if momentum holds, we could see a push towards the much stronger $0.00001400 – $0.00001490 zone. This region lines up with a multi-point confluence, including a significant horizontal resistance and the 38.20% Fibonacci retracement level — both strong technical barriers that may define the next major move.
💎Support is also well-defined for now. The 12-hour EMA-50 is acting as dynamic support and currently sits around the $0.00000720 level. PEPE has been respecting this level well, and any temporary pullbacks may bounce from here. Below this, the $0.00000650 – $0.00000570 range remains the key support zone. This zone held firm during the last dips and is likely to absorb any upcoming selling pressure if the breakout fails short-term.
Paradisers, strive for consistency, not quick profits. Treat the market as a businessman, not as a gambler.
MyCryptoParadise
iFeel the success🌴

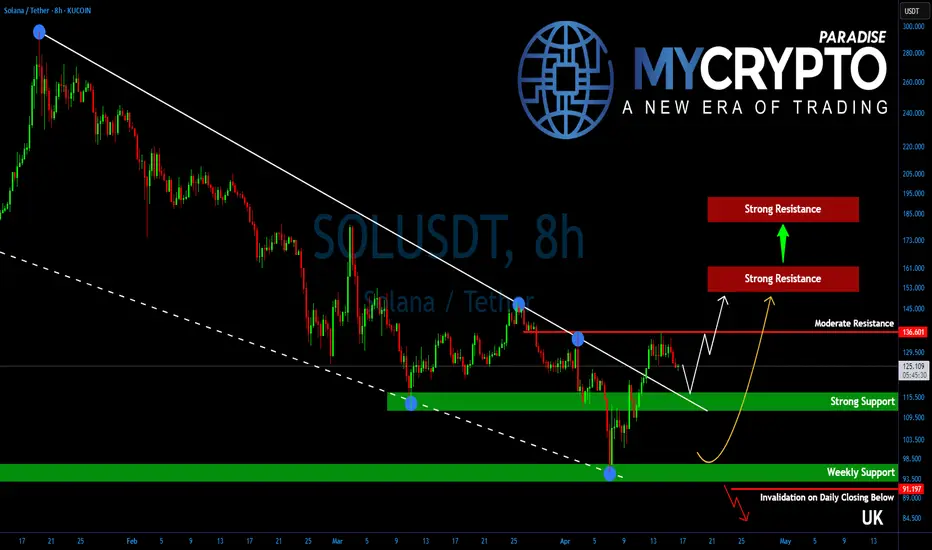
Solana Is One Breakout Away From a Bullish Explosion!Yello, Paradisers! Did you notice how #SOLUSD has been quietly positioning itself while the rest of the market remains uncertain? If you're not paying attention right now, you could be missing one of the cleanest setups on the charts.
💎After several weeks of downside grind and tight consolidation, Solana has just broken out of a falling wedge—a powerful bullish pattern that typically signals trend reversals or the start of a strong upside leg. This breakout wasn’t random either. It occurred after SOL successfully defended a key higher time frame support zone, signaling strength behind the move.
💎For #SOLUSDT, all eyes are on the $136.50 resistance level. This is a critical structural pivot. A clean break and close above this level would confirm a shift in higher time frame momentum from neutral to bullish. Until that happens, bulls still need to proceed with caution—but the setup is clearly developing in their favor.
💎Adding conviction to the idea of a bullish breakout are several supporting factors. Oscillators are showing bullish divergences, a classic sign that seller momentum is fading. At the same time, a golden cross formation on the 12-hour chart is getting closer which typically precedes sustained trend reversals and stronger moves to the upside.
💎If bulls succeed in reclaiming $136.50, the next price targets are $155–$160 as the initial strong resistance zone where some profit-taking could occur. If bulls hold strength, SOL is likely to head further higher and aim for $180–$190, which lines up with the target of the wedge pattern. This is a strong resistance zone and a level which could mark end of the corrective phase for Solana.
💎On the downside, immediate support lies between $110–$115. This is a well-defined range of demand and should offer strong buying interest if any short-term pullbacks occur.
Paradisers, strive for consistency, not quick profits. Treat the market as a businessman, not as a gambler.
MyCryptoParadise
iFeel the success🌴
Is #XTZ Ready For a Major Breakout or Another Trap Ahead?Yello Paradisers! Are you prepared for what might be one of the sneakiest reversals brewing quietly on #XTZUSDT? Let's see the current setup of #Tezos:
💎#XTZ is trying to break out of a descending broadening wedge formation, a setup that typically signals the end of a corrective structure and the potential beginning of a major impulsive move. We’re likely witnessing the very first wave of this new impulse, and what happens next will depend entirely on how the price reacts to the overhead dynamic resistance.
💎The 1st impulsive wave appears to be nearing completion, and based on structure and current momentum, a minor pullback is both expected and healthy. This retracement will likely serve as a reset before the next leg higher begins, offering a potential entry for those who missed the breakout. However, we do not expect this correction to break below the origin of the first wave — doing so would undermine the integrity of the new trend.
💎Currently, the #XTZUSD is facing strong resistance from the EMA, which it must convincingly break and reclaim. This EMA level has repeatedly acted as a lid on price action, and until it’s cleared, any upside move remains tentative. However, if buyers step in with real volume, we could see a rapid acceleration toward the mid-term resistance at $0.916. That level has historically marked a shift in market control. And beyond it, the next major resistance lies at $1.134, a key supply zone that could trigger heavy distribution.
💎On the downside, the structure remains clean. The $0.491 – $0.516 zone is now our major support, and it must hold. If the price falls below this support and closes with weakness, it will invalidate the current bullish thesis and likely lead to a deeper correction.
Play it safe, respect the structure, and let the market come to you!
MyCryptoParadise
iFeel the success🌴

GLMR Explosion or Final Trap? Yello Paradisers — are you truly ready for one of the cleanest, most deceptive setups we’ve seen on GLMR in weeks? If you’ve been following our latest insights, you already know — this is not the moment to get distracted. A decisive move is on the horizon… but the trap is also well set. The only question is: will you be the one who catches it or gets caught?
💎#GLMRUSDT has just completed a clear 5 wave rising wedge, a classic structure that often signals the end of a move and it has now pushed directly into a key resistance zone. This level has rejected price multiple times in the past (as previously marked), and unsurprisingly, price has stalled here once again.
💎The support at $0.095 is now critical. If this level holds, this current pause could easily evolve into a bullish consolidation before the next impulsive leg upward.But just below, we’re eyeing the demand zone near $0.085. If the $0.095 support breaks and price dips into this zone, we’ll be watching for signs of aggressive buying. A fast rebound here could present a golden long entry, but only if we see clear strength returning immediately after the retest.
💎To the upside, our next moderate resistance lies at $0.1313, and beyond that, the real game begins in the major supply zone between $0.145 – $0.155. That’s where smart money will likely begin distributing their positions, and you should be ready to follow.
💎However, if price breaks below $0.0709, the entire bullish structure gets invalidated. That becomes our flip level — if breached, we will turn bearish and prepare for lower lows.
Discipline, patience, robust strategies, and trading tactics are the only ways you can make it long-term in this market.
MyCryptoParadise
iFeel the success🌴

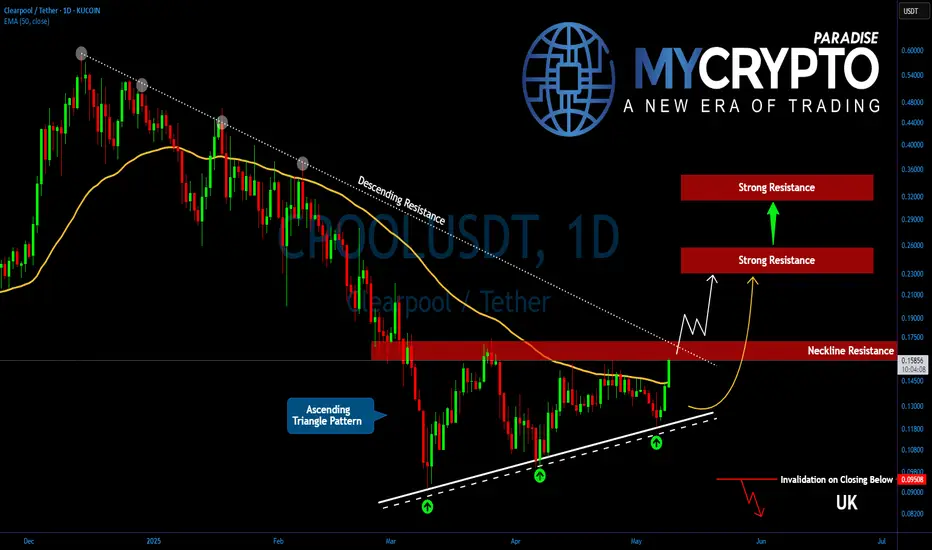
CPOOL Bullish Reversal in Play? Key Levels To Watch!Yello, Paradisers! Could #CPOOL be setting up for a powerful breakout after months of pain? The price action is finally signaling that a major trend reversal might be brewing.
💎After an extended downtrend, CPOOL is now forming a bullish ascending triangle pattern—a classic structure that often leads to strong upside reversals. For the first time since January 19th, 2025, bulls have successfully pushed price above the EMA-50, indicating a shift in momentum.
💎#CPOOLUSDT is testing its neckline resistance between $0.1570 and $0.1720. This is the key breakout threshold—once breached with conviction, it’s expected to trigger a significant reversal wave and usher in a new bullish phase.
💎A confirmed breakout above $0.1720 would open the path toward the next major resistance between $0.230 and $0.250. This is the first profit-taking zone where short-term traders might look to offload positions. However, the structure suggests that this could just be the beginning.
💎If momentum continues, the full triangle breakout target lies higher—at $0.320 to $0.350. This area aligns with the 50% Fibonacci retracement level, making it a critical test zone for bulls. Traders should prepare for increased volatility and potential reversals in this zone, as it's likely to attract both sellers and momentum-driven buyers.
💎On the downside, primary support now rests at $0.1440, which is the current EMA-50 level. Below that, the ascending trendline support between $0.1275 and $0.1190 offers a firmer structural base and should be watched closely in the event of pullbacks.
Paradisers, strive for consistency, not quick profits. Treat the market as a businessman, not as a gambler.
MyCryptoParadise
iFeel the success🌴
ADA Breakdown Ahead? Don’t Let This Bull Trap Fool YouYello Paradisers—are you ready for what could be a classic trap before a deeper drop? ADAUSDT is flashing multiple bearish signals that are difficult to ignore, and if you're not paying attention, this setup could catch you off guard.
💎ADAUSDT recently took a firm rejection from a key resistance zone, failing to push higher. Following that, price action broke down from a well-formed descending channel, and we’ve now seen a clear bearish Change of Character (CHoCH). These three factors together significantly increase the probability of a bearish continuation.
💎If ADAUSDT pulls back and grabs liquidity, that could offer a highly favorable opportunity to enter on the short side. The ideal scenario would be a return to the resistance zone, followed by the formation of bearish price patterns—such as rejections or bearish engulfing candles. This would confirm the intent to move lower and offer a strong risk-to-reward short setup.
💎However, if the price manages to break and close decisively above the resistance zone, this would invalidate the current bearish outlook. In that case, it's critical to remain patient and wait for cleaner, higher-probability price action to form. Forcing trades in an uncertain setup can lead to unnecessary losses, so discipline is essential here.
Strive for consistency, not fast profits. The most successful traders are the ones who wait for the market to show its hand clearly. Stay focused, stay sharp, and trade smart.
MyCryptoParadise
iFeel the success🌴

XRPUSDT on the Edge: Is a Major Breakdown Coming? Yello Paradisers! Are you ready for what could be a huge bearish trap unfolding right now on XRPUSDT?
💎Currently, XRPUSDT is flashing serious warning signs. The formation of a rising wedge pattern is significantly increasing the probability of a bearish move. When analyzing the broader market structure, it appears this recent uptick is merely a retracement within the larger bearish trend—keeping the probability on the bearish side still very high.
💎If XRPUSDT bounces, grabs liquidity and starts forming clear bearish patterns from that resistance area, it could set up an excellent opportunity with a high risk-to-reward (RR) ratio for shorts.
💎However, if the price breaks out and closes a candle clearly above the resistance zone, our bearish thesis will be invalidated. In that case, it would be much smarter to stay patient and wait for a more reliable price action setup before considering any new trades.
🎖Remember Paradisers, the key to surviving and thriving in this market is to stay disciplined, patient, and smart. Trade what you see, not what you feel! Stick to the plan, and never rush decisions under emotional pressure. Play it safe, and stay focused—our time will come!
MyCryptoParadise
iFeel the success🌴

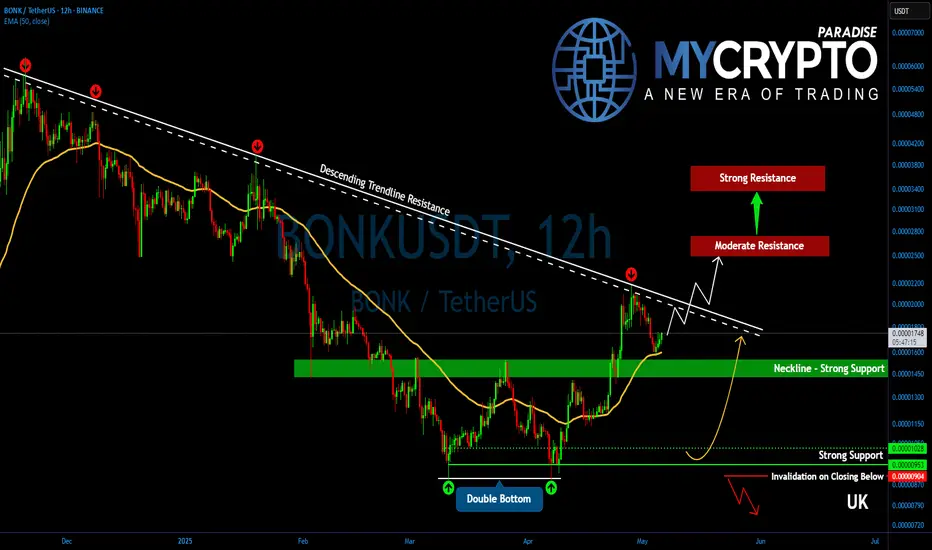
BONKUSDT Up for a Major Breakout! Key Levels to Watch!Yello, Paradisers! Is #BONK about to explode higher after weeks of consolidation? A powerful shift is underway—and the bulls might just be waking up at the perfect time.
💎#BONKUSDT is beginning to show a notable short-term trend reversal, with a double bottom pattern now confirmed. This structure signals a potential end to the recent bearish control, and price action is now pressing against the descending trendline resistance. A successful breakout here could completely flip market dynamics in favor of the bulls.
💎Following a minor round of profit-taking at the descending resistance, BONK pulled back toward the previous breakout support. That retracement brought the price right back into the key supportive range between 0.00001550 and 0.00001425, where it's now starting to bounce again. Notably, the EMA-50 has aligned perfectly with this support zone, adding strength to the reaction from this area.
💎BONKUSDT's next challenge lies at 0.00002000 to 0.00002100—a major descending resistance level that has capped upside since December 2024. Breaking above this structure would be a critical bullish breakout, potentially unleashing the next wave of upside momentum.
💎If bulls push through this barrier, BONK is expected to move toward the next moderate resistance at 0.00002500 to 0.00002750. This area aligns with the measured target of the double bottom formation. However, if bullish strength continues to build, BONK may even extend toward the strong resistance between 0.00003400 and 0.00003700, where the 50% Fibonacci retracement also resides—a historically significant level for potential trend reversals.
💎Adding to the bullish case, the 12-hour EMA-50 and EMA-200 are now converging toward a possible Golden Cross. If this cross confirms, it could serve as a major technical catalyst for a broader trend reversal and further upside continuation.
Paradisers, strive for consistency, not quick profits. Treat the market as a businessman, not as a gambler.
MyCryptoParadise
iFeel the success🌴
SOLUSDT Reversal Brewing — Watch This Level or Get Wrecked!Yello Paradisers — Are you paying attention to #SOLUSDT? Because what’s forming right now isn’t just noise — it’s a high-probability reversal setup that could trap the late bulls or become the kind of move that sets the tone for the next few weeks. Either way, the next play is going to separate professionals from gamblers. Let’s talk.
💎#SOLUSDT has been printing textbook bearish price action for weeks — lower lows and lower highs on the major time frame. But something critical has just changed. A break in market structure has occurred, and we’ve now got a higher high. That’s your first probable signal that the tide may be turning. Now comes the most important test — can we form the higher low to confirm this shift?
💎What makes this setup even more interesting is that we’re not just seeing a random bounce. SOL is in the middle of potentially probable completing two major bullish reversal patterns — an inverse head and shoulders and a Quasimodo. The left shoulder and neckline are already locked in. The right shoulder? Still cooking. But here’s the thing — the previous resistance, which aligns perfectly with where the right shoulder could form, is lining up as a textbook retest zone. That means we could get the higher low right there, completing both patterns at once.
💎Right now, price is struggling against multi-timeframe resistance, and that’s exactly what we want. It increases the probability of a short-term pullback to the key zone — around 110.9 to 115 — before the real breakout happens. If that level holds, and we print a confirmed higher low, this whole setup becomes explosive.
💎First area of resistance sits at 153, but that’s just the appetizer. The main zone we’re looking at is 173 to 181. That’s the bigger move that this structure is potentially building toward. But let’s be clear — if SOLUSDT closes a candle below 110.9, the entire setup gets invalidated. That level is your line in the sand.
This is the kind of setup we live for — clean structure, clear invalidation, and serious upside potential. But don’t rush it. The market will reward the ones who wait, not those who chase. Let others panic. Let others fomo. You focus on execution.
Trade smart, Paradisers — and always remember, only a few will catch the real move. Be one of them.
MyCryptoParadise
iFeel the success🌴

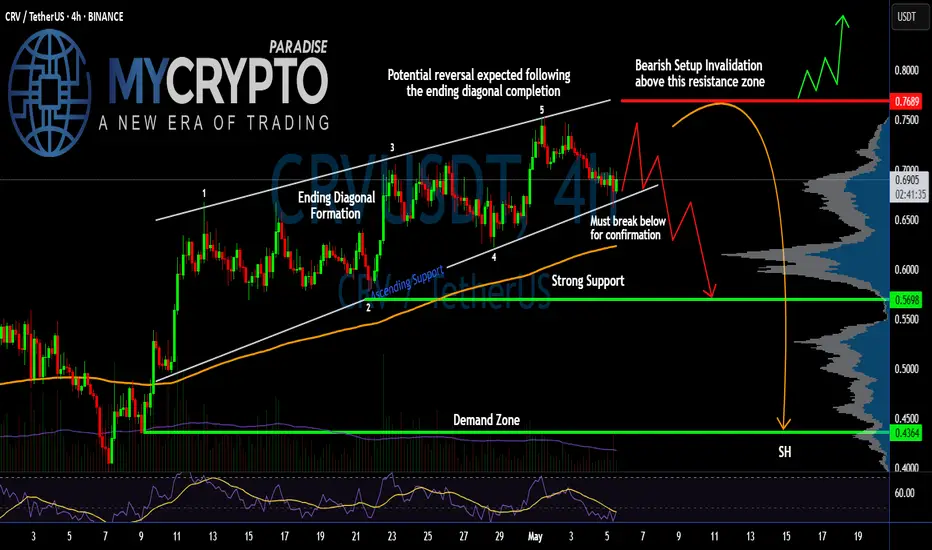
Is #CRV Ready for a Reversal or Not? Key Levels to Watch Yello Paradisers! Are we about to witness another brutal trap as #CRV finishes its final leg up and prepares to flush all late longs? Let’s break down the setup for #CurveDAOToken:
💎#CRVUSDT is currently trading around $0.6948, and what we’re seeing here is a classic Ending Diagonal Formation, a pattern well-known for luring in unsuspecting bulls before reversing violently. The structure has completed its five-wave sequence, and the price is now teetering just above key support.
💎The resistance zone near $0.7689 is where the whole game flips. This level has been clearly rejected before, and it now marks the invalidation point for any bearish outlook. A sustained move above this region with solid momentum would invalidate the diagonal and potentially send the price toward the $0.80+ mark. However, without that breakout, the bearish reversal remains the dominant scenario.
💎#CRVUSD is holding above rising trendline support, but this support is critical. A break below it confirms the end of the diagonal and should trigger a strong sell-off. The first target on a breakdown is the $0.5698 area, a zone previously respected and backed by significant volume profile interest.
💎If sellers gain traction and that level breaks down too, we’re watching for a move toward the demand zone at $0.4364, which aligns with the lower volume shelf—this is where the real pain could begin for over-leveraged traders caught on the wrong side.
Play it safe, respect the structure, and let the market come to you!
MyCryptoParadise
iFeel the success🌴
Is the CGPT Retest a Setup-Are You Ready for It?Yello, Paradisers! Have you been watching CGPT closely? Because what we’re seeing now could be a textbook setup to liquidate early longs before a brutal downward move. This is the exact type of trap that punishes undisciplined traders and rewards those who wait.
💎After weeks of bullish momentum with clean higher highs and higher lows, #CGPTUSDT has now printed a clear change of character (CHoCH). The previous low was taken out, and now price has pulled back right into a high-probability resistance zone. This zone, between $0.115 and $0.118, aligns perfectly with a broken ascending trendline adding confluence that strengthens our bearish bias. Traders who aren't careful might interpret this retest as a sign of strength, but this could just be the market setting up its next liquidation wave.
💎Adding even more weight to this bearish thesis is the fact that #CGPT is currently trading below its 50 EMA on the 4H timeframe, showing clear weakness and confirming that the short-term momentum has already shifted in favor of sellers. This acts as dynamic resistance and makes it even harder for price to reclaim bullish control without a significant effort from buyers.
💎The structure is showing all signs of a classic trap. Price action is hesitant at resistance, and with momentum waning, a rejection from this level could spark a swift move down toward $0.09188, our first support zone. But that may not be the end of it. If selling accelerates, we are eyeing the $0.07133 area as a potential major demand zoneour strong support and where true smart money will likely accumulate. However, we must always remain tactical. If CGPTUSDT flips above $0.12526, this bearish scenario is invalidated and we would reassess for possible bullish continuation.
Discipline, patience, robust strategies, and trading tactics are the only ways you can make it long-term in this market.
MyCryptoParadise
iFeel the success🌴

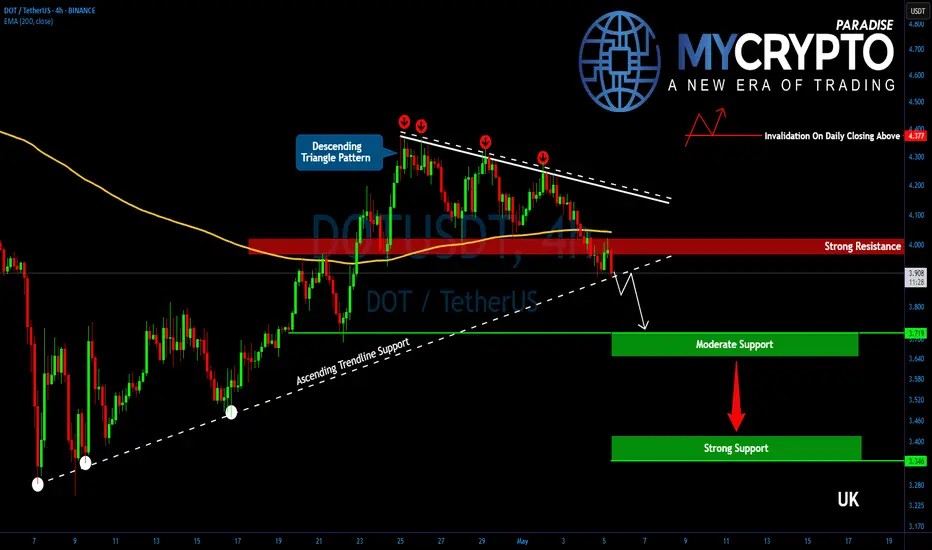
DOTUSDT Is Hanging by a Thread! Breakdown Ahead?Yello, Paradisers! Is #DOT about to hit new yearly lows? The structure is getting ugly again—don’t get caught off guard as this setup is starting to turn dangerous fast.
💎After a brief and weak corrective bounce, DOTUSDT is once again losing steam. The price has already broken down from a descending triangle—a bearish continuation pattern—and is now threatening to breach its key ascending support level. Momentum is shifting aggressively back in favor of the bears.
💎#DOTUSDT is now hanging to the critical $3.90 support level. A decisive breakdown below this zone would likely trigger another wave of selling pressure, opening the door for a drop toward the next moderate support range at $3.72 to $3.65. While this area could attract some short-term profit-taking, the broader trend remains clearly vulnerable, with bearish momentum continuing to dominate.
💎Should bearish pressure continue, and it’s highly likely at this stage that DOT could fall all the way toward the stronger support zone between $3.40 and $3.35. This region marks the 52-week low, and it's where bulls might step in to defend and attempt a meaningful rebound.
💎Additionally, the 2-hour EMA-200 has shown itself to be a strong trend guide. Every time DOT traded above it, bulls had a slight edge. But now that price has once again broken below this moving average, momentum is back with the bears.
Paradisers, strive for consistency, not quick profits. Treat the market as a businessman, not as a gambler.
MyCryptoParadise
iFeel the success🌴
#Near Ready For a Major Breakdown? Let's Breakdown Key Levels Yello Paradisers! Is #NEAR about to trap thousands of traders chasing this last move up, only to reverse and flush hard? Let’s take a closer look at the #NearProtocol setup:
💎#NEARUSD is trading at $2.585, slowly grinding higher within a clearly defined Ending Diagonal structure. This textbook formation often tricks even experienced traders into entering too early. The current wave count suggests we’re in the final leg, Wave 5 is still in play, but it’s unfolding suspiciously close to a heavy resistance zone, one that previously acted as strong resistance and rejected it.
💎This zone, sitting around the $2.80–$2.90 area, is the key pivot for this entire setup. The bearish structure would be invalidated if #NEAR manages to break and close above this resistance with conviction, especially backed by strong volume. That kind of breakout would suggest the market still has bullish momentum and could drive the price toward the $3.00 region or higher. However, without a convincing breakout, the odds are still skewed to the downside.
💎As long as the price remains under this critical resistance zone, the Ending Diagonal pattern remains valid, and history has shown how brutal the reversal from this structure can be. A failure to break out cleanly is likely to lead to a sharp and rapid decline. The first area of interest on the way down would be the $2.153 level, an important support that the price has reacted to in the past.
💎Should this level break, the door opens to a deeper correction targeting $1.819, where the Volume Profile begins to rise again and buyers have previously stepped in. Momentum indicators are also not aligning with the bullish case. The RSI is showing clear signs of weakening strength, failing to keep up with the price as the move extends into the final wave.
Play it safe, respect the structure, and let the market come to you!
MyCryptoParadise
iFeel the success🌴

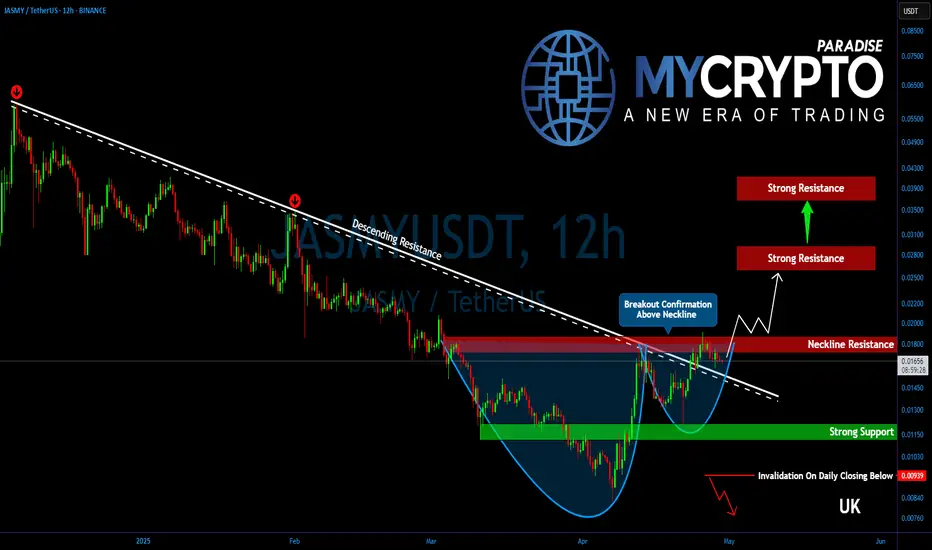
Is JASMY Ready for a Massive Comeback? Key Levels to Watch!Yello, Paradisers! After months of relentless selling, could #JASMY finally be staging a comeback? Let's dive into its key technicals:
💎After an extended and painful downtrend, JASMY has finally broken out of its multi-month descending trendline resistance. This significant technical breakout marks the first step toward a potential broader recovery. Moreover, the price action is shaping a potential cup and handle formation—a powerful bullish continuation pattern—which strongly suggests that the recovery momentum still has further room to run.
💎At the moment, #JASMYUSDT is battling a crucial resistance zone between $0.01750 and $0.01850. This area serves as the neckline resistance of the developing bullish structure. A clean and convincing breakout above this zone would trigger a major shift in momentum, potentially setting up JASMY for a back-to-back bullish breakout.
💎Should bulls succeed in pushing above this resistance, the next immediate target lies at $0.02500 to $0.02750—a heavy supply zone that coincides perfectly with the 50% Fibonacci retracement. This level is expected to attract some strong profit-taking.
💎However, if bullish strength continues to hold firm even after that, JASMY could extend its rally toward the 61.8% Fibonacci retracement zone, located around $0.03650 to $0.04000. This region is historically known to be a "golden pocket" for reversals and thus demands maximum caution. If signs of exhaustion emerge near this zone, it could potentially mark a medium-term top.
💎JASMY’s first primary support now sits at $0.01500. Below that, a firmer, more critical support base exists between $0.01150 and $0.01100—a zone that has already proven capable of withstanding strong selling pressure in the past.
Paradisers, strive for consistency, not quick profits. Treat the market as a businessman, not as a gambler.
MyCryptoParadise
iFeel the success🌴
SHIBUSDT Is Flashing Major Bearish Warnings – Are You Ready??Yello Paradisers, Have you been keeping an eye on SHIBUSDT? If not, now is the time. The market is showing clear signs of weakness that could lead to a significant bearish move, and many traders may not be prepared for what’s coming.
💎SHIBUSDT is currently looking bearish after forming a clear bearish Change of Character (CHoCH) on the higher timeframe. Adding to this, the price action on the lower timeframe is showing an internal Change of Character (I-CHoCH) originating from a 4-hour bearish Order Block (OB). This setup substantially increases the probability of a continuation to the downside.
💎What we are focusing on now is the potential pullback. If SHIBUSDT pulls back to fill the Fair Value Gap (FVG) or develops a bearish pattern from the Order Block, it would provide a strong short opportunity with an excellent risk-reward profile.
💎However, it is crucial to remain cautious: if the price breaks out and closes a candle above the identified Order Block, it would completely invalidate the bearish idea, and we would need to step aside from any short positions.
Remember, Paradisers, sustainable trading success comes from patience and disciplined execution. There is no need to rush. Waiting for confirmation will always keep you on the winning side. Be smart, wait for the right setup, and always trade like a professional. This is the only way you will make it far in your crypto trading journey.
MyCryptoParadise
iFeel the success🌴

Is #LTC on the Edge of a Major Breakdown? Watch Key Levels Yello Paradisers! Is #Litecoin about to collapse after completing a suspicious Ending Diagonal pattern? Let’s dive into this critical setup on #LTCUSDT:
💎#LTC is currently trading around $87, sitting just below a major resistance zone between $92 and $97. Price has been moving inside a textbook Ending Diagonal formation, and based on the current structure, the 5th wave of this diagonal appears to still be unfolding—but the clock is ticking.
💎Volume has been fading even as price attempts to push higher, a classic warning sign deep inside a wedge. At the same time, momentum indicators are showing bearish divergence, hinting that the strength behind this up-move is running out of steam.
💎The red Resistance Zone above is absolutely critical. If #LTCUSD manages to break and hold above $96, the bearish setup would be invalidated, opening the path for a strong impulsive move toward $104 and beyond. However, unless that breakout happens with convincing volume, the odds strongly favor the downside.
💎If price fails to push higher, the first sign of confirmation will be a break below the ascending support trendline near $86–$84. A decisive move below this support would likely trigger a fast drop toward the next major support around $76. If that fails to hold, a full breakdown into the $64 region becomes very likely, as that's where strong historical demand exists according to the Volume Profile.
Play it safe, respect the structure, and let the market come to you!
MyCryptoParadise
iFeel the success🌴

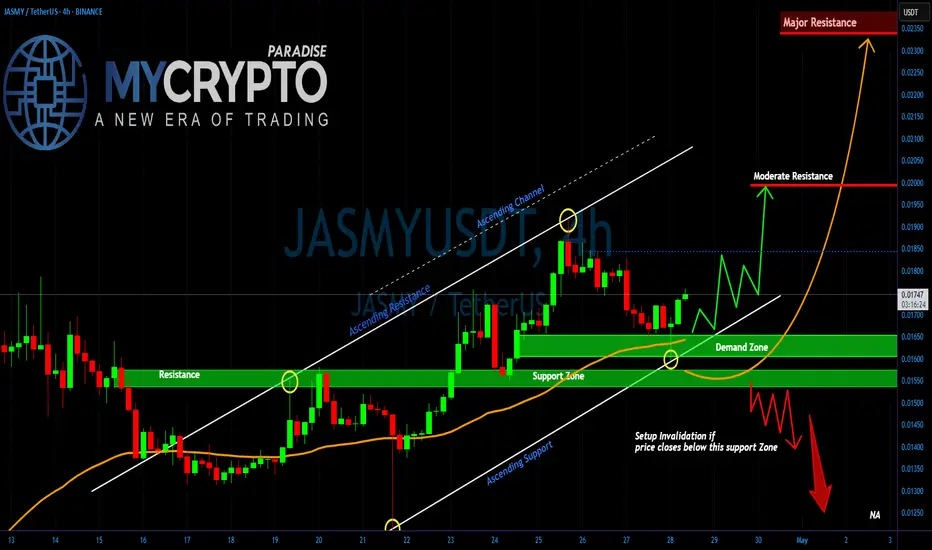
JASMY at a Breaking PointYello, Paradisers! Have you been watching JASMY closely? If not, you might be about to miss one of the most explosive opportunities we've seen in recent days. A major breakout or breakdown is brewing, and the market is preparing for a decisive move!
💎Right now, #JASMYUSDT is sitting above a critical Demand Zone after successfully flipping a strong historical resistance into support. Price action is following an ascending structure, respecting both the Ascending Support and the broader Ascending Channel pattern. As long as the price continues to hold this support region and maintain the bullish market structure, there is a high probability of a breakout towards the Moderate Resistance level around 0.01994. A clean break above this area could fuel a sharp rally straight towards the Major Resistance zone at 0.02337.
💎However, caution is absolutely necessary here. If JASMY fails to hold the current Demand Zone and we see a confirmed close below the support at 0.01540 level, it would invalidate the bullish setup. In that case, a rapid sell-off is likely, with downside targets opening towards the 0.01397 region and possibly even lower levels. This would create a high-risk environment where inexperienced traders could get trapped very quickly.
Stay focused, Paradisers. Be the hunter, not the hunted.
MyCryptoParadise
iFeel the success🌴
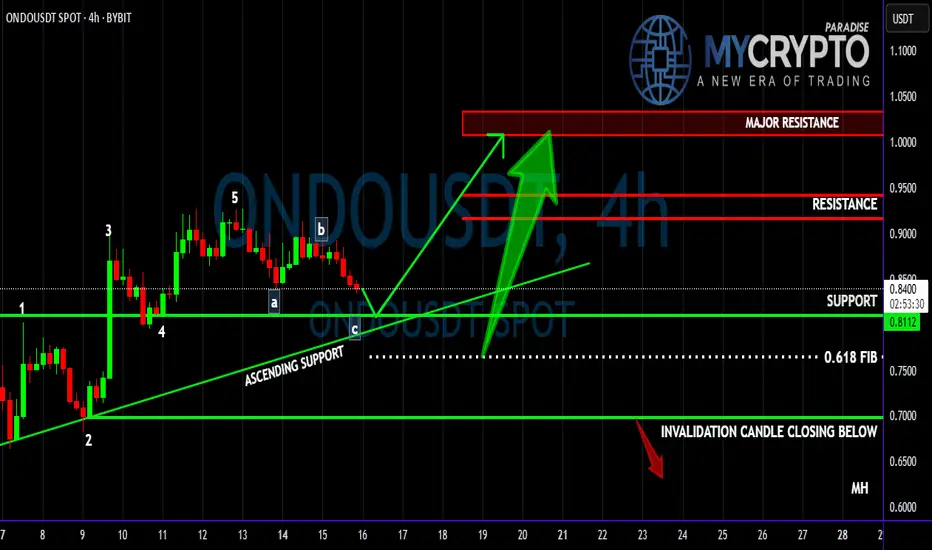
Is ONDO About to Crash Before the Next Big Rally? Yello Paradisers, are you ready for the next big #ONDOUSDT move, or will you be caught off guard by the next dump? Let’s break down what’s really happening here before it’s too late.
💎#ONDOUSDT has been following a clear Elliott Wave impulse structure. After completing the 5th wave of the impulse move, we’ve now entered the corrective phase. So far, the A and B waves have already played out, and now the C wave seems to be on its way — likely heading toward a key support area around 0.8112.
💎This support level is not just psychological — it also aligns perfectly with a well-respected ascending trendline, giving the level even more technical confluence. If buyers step in strongly here, this could be the launching point for the next impulsive bullish leg.
💎However, if the 0.8112 zone fails to hold, there’s a high probability we could see a deeper correction — potentially down toward the 0.618 Fibonacci level. This would still be a technically valid correction and might attract even stronger buying interest.
💎On the flip side, confirmation of bullish continuation would come once the pair regains momentum from the support zone and pushes towards the higher resistance levels. Watch closely for reactions in those zones — they will dictate the strength of the next leg up.
💎The invalidation of this bullish structure would be confirmed if we get a candle close below 0.6967. This would mean a break below both the ascending trendline and the 2nd wave of the Elliott impulse — a clear sign to reassess the structure.
Strive for consistency, not quick profits. Treat the market as a businessman, not as a gambler. Stay sharp and follow the structure — it's unfolding right in front of us, Paradisers.
MyCryptoParadise
iFeel the success🌴
ETH Rejection Incoming? Don’t Fall for This Bull TrapYello Paradisers, are you watching how ETH is reacting right now at this key zone? This could either turn into a textbook bearish setup… or catch everyone off guard. Let’s break it down 👇
💎ETHUSDT is currently hovering at a critical resistance area, perfectly aligned with both a key Fibonacci retracement zone and the 200 EMA—classic confluence. What makes it even more concerning is the bearish divergence, which is strengthening the probability of a downside rejection from this level.
💎To add fuel to the fire, the price action has just taken liquidity (inducement) above the previous highs, another bearish signal that supports the idea of a potential reversal from here.
💎However, this bearish bias will be fully invalidated if ETH manages to break and close a candle above the resistance zone. That kind of price action would suggest strength from buyers and a likely continuation to the upside.
💎In that case, it’s wiser to stay patient and wait for a cleaner setup at a better price. Rushing into a trade at this stage, especially in a moment of indecision, is not how pros operate.
If you want to be consistently profitable, you need to be extremely patient and always wait only for the best, highest probability trading opportunities.
MyCryptoParadise
iFeel the success🌴

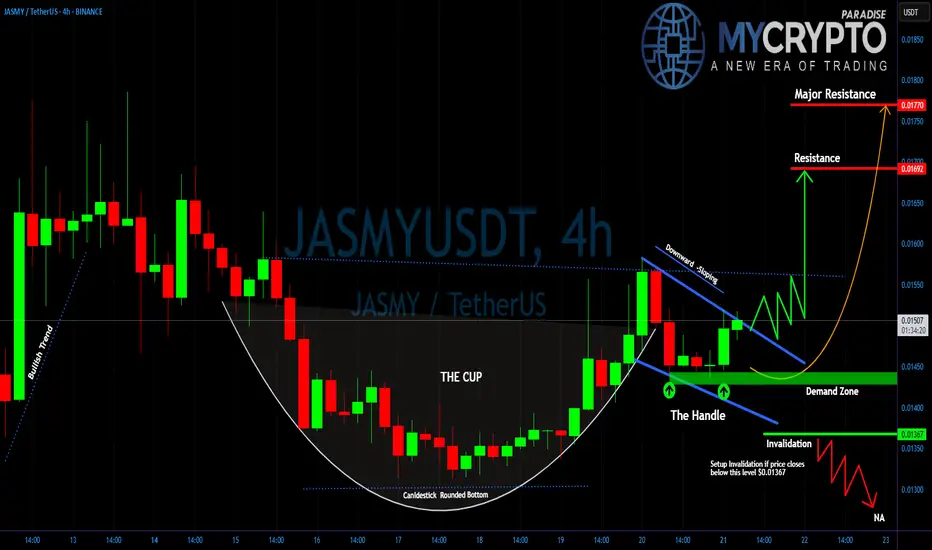
JASMY: Will You Catch the Breakout or Get Caught in the Trap?Yello Paradisers, did you catch the textbook pattern quietly forming on JASMY while most of the market remains distracted? Because what comes next could catch the majority off guard.
💎#JASMYUSDT is currently forming a classic Cup and Handle pattern. After a strong impulsive move, the price retraced in a rounded bottom structure, completing what now looks like the cup. The current consolidation has created the handle a downward-sloping corrective move that’s showing early signs of exhaustion.
💎What adds even more strength to this setup is that the price is now trading above both the 50 EMA and 200 EMA on the 4H timeframe. This signals a solid bullish bias and confirms that the overall momentum remains in favor of the bulls. When the price holds above both moving averages during a consolidation phase, it often indicates that a strong continuation move is brewing.
💎The price is also respecting a well-defined demand zone between 0.01430 and 0.01450. As long as this area holds, the probability of a bullish breakout remains high. A break above the descending handle resistance will be the first true confirmation.
💎If that breakout is supported by volume and sustained price action, we expect a move toward the first resistance at 0.01698. Beyond that, the final target for this pattern lies at the major resistance zone around 0.01785, where significant selling pressure could return. However, discipline is key. If JASMYUSD breaks below 0.01367, the handle structure would be invalidated.
Stay focused, Paradisers. Be the hunter, not the hunted
MyCryptoParadise
iFeel the success🌴