#MYRO/USDT myro road map ( 1 H )#MYRO
The price is moving within an ascending channel on the 1-hour frame, adhering well to it, and is poised to break it strongly upwards and retest it.
We have support from the lower boundary of the ascending channel, at 0.02040.
We have a downtrend on the RSI indicator that is about to break and retest, supporting the upward move.
There is a key support area in green at 0.02020, which represents a strong basis for the upward move.
Don't forget one simple thing: ease and capital.
When you reach the first target, save some money and then change your stop-loss order to an entry order.
For inquiries, please leave a comment.
We have a trend of stability above the Moving Average 100.
Entry price: 0.02040
First target: 0.02140
Second target: 0.02200
Third target: 0.002276
Don't forget one simple thing: ease and capital.
When you reach the first target, save some money and then change your stop-loss order to an entry order.
For inquiries, please leave a comment.
Thank you.
MYROUSD

#MYRO/USDT myro road map (HI)#MYRO
The price is moving within a descending channel on the 1-hour frame, adhering well to it, and is on its way to breaking it strongly upwards and retesting it.
We have a bounce from the lower boundary of the descending channel. This support is at 0.02400.
We have a downtrend on the RSI indicator that is about to break and retest, supporting the upside.
There is a key support area (in green) at 0.02350, which represents a strong basis for the upside.
Don't forget one simple thing: ease and capital.
When you reach the first target, save some money and then change your stop-loss order to an entry order.
For inquiries, please leave a comment.
We have a trend of stability above the Moving Average 100.
Entry price: 0.02476
First target: 0.02532
Second target: 0.02656
Third target: 0.02780
Don't forget one simple thing: ease and capital.
When you reach the first target, save some money and then change your stop-loss order to an entry order.
For inquiries, please leave a comment.
Thank you.

#MYRO/USDT myro road map (HI)#MYRO
The price is moving within a descending channel on the 1-hour frame, adhering well to it, and is on its way to breaking it strongly upwards and retesting it.
We have a bounce from the lower boundary of the descending channel. This support is at 0.02431.
We have a downtrend on the RSI indicator that is about to break and retest, supporting the upward move.
There is a key support area in green at 0.2038, which represents a strong basis for the upward move.
Don't forget one simple thing: ease and capital.
When you reach the first target, save some money and then change your stop-loss order to an entry order.
For inquiries, please leave a comment.
We have a trend of stability above the Moving Average 100.
Entry price: 0.02170
First target: 0.02215
Second target: 0.02316
Third target: 0.02431
Don't forget one simple thing: ease and capital.
When you reach the first target, save some money and then change your stop-loss order to an entry order.
For inquiries, please leave a comment.
Thank you.

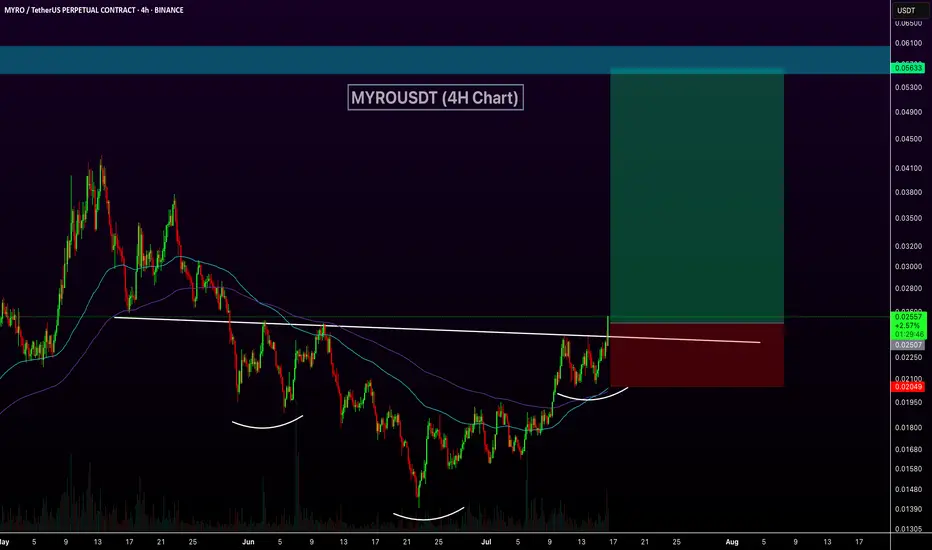
MYROUSDT Breaks Out of Inverse Head and Shoulders BYBIT:MYROUSDT has a clear breakout from an Inverse Head and Shoulders pattern, signaling a potential bullish trend reversal. Price has decisively broken above the neckline around the $0.025 level, supported by increased volume. Additionally, MYRO price is trading above both the 100 EMA and 200 EMA, reinforcing the bullish momentum.
#MYRO/USDT myro road map ( 1 H )#MYRO
The price is moving within a descending channel on the 1-hour frame and is expected to break and continue upward.
We have a trend to stabilize above the 100 moving average once again.
We have a downtrend on the RSI indicator that supports the upward break.
We have a support area at the lower boundary of the channel at 0.02040, acting as a strong support from which the price can rebound.
We have a major support area in green that pushed the price upward at 0.01900.
Entry price: 0.02087
First target: 0.02178
Second target: 0.02278
Third target: 0.02373
To manage risk, don't forget stop loss and capital management.
When you reach the first target, save some profits and then change the stop order to an entry order.
For inquiries, please comment.
Thank you.

#MYRO/USDT. LONG?#MYRO
The price is moving within a descending channel on the 1-hour frame and is expected to break and continue upward.
We have a trend to stabilize above the 100 moving average once again.
We have a downtrend on the RSI indicator that supports the upward break.
We have a support area at the lower boundary of the channel at 0.016650, acting as a strong support from which the price can rebound.
We have a major support area in green that pushed the price upward at 0.01600.
Entry price: 0.01666
First target: 0.01750
Second target: 0.01837
Third target: 0.01955
To manage risk, don't forget stop loss and capital management.
When you reach the first target, save some profits and then change the stop order to an entry order.
For inquiries, please comment.
Thank you.

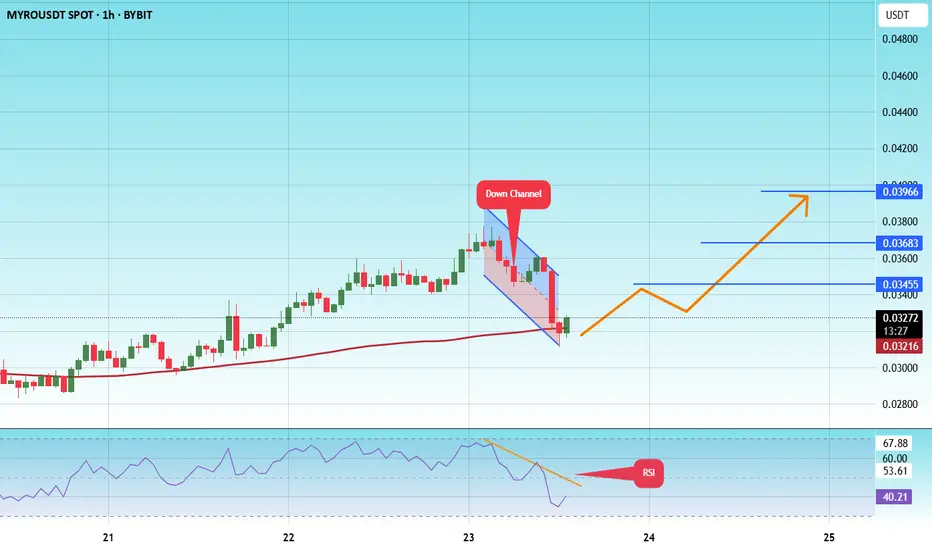
#MYRO/USDT#MYRO
The price is moving within a descending channel on the 1-hour frame, adhering well to it, and is on its way to breaking it strongly upwards and retesting it.
We are seeing a bounce from the lower boundary of the descending channel, this support at 0.0350.
We have a downtrend on the RSI indicator that is about to break and retest, supporting the upward trend.
We are looking for stability above the 100 Moving Average.
Entry price: 0.03739
First target: 0.03940
Second target: 0.04145
Third target: 0.04421

#MYRO/USDT#MYRO
The price is moving in a descending channel on the 1-hour frame and is adhering to it well and is heading to break it strongly upwards and retest it
We have a bounce from the lower limit of the descending channel, this support is at a price of 0.01562
We have a downtrend on the RSI indicator that is about to break and retest, which supports the rise
We have a trend to stabilize above the moving average 100
Entry price 0.01652
First target 0.01730
Second target 0.01784
Third target 0.01886

#MYRO/USDT#MYRO
The price is moving in a descending channel on the 1-hour frame and is adhering to it well and is heading to break it strongly upwards and retest it
We have a bounce from the lower limit of the descending channel, this support is at a price of 0.0190
We have a downtrend on the RSI indicator that is about to break and retest, which supports the rise
We have a trend to stabilize above the moving average 100
Entry price 0.0214
First target 0.0227
Second target 0.0243
Third target 0.0256

#MYRO/USDT Financial covenant#MYRO
The price is moving in a descending channel on the 1-hour frame and is adhering to it well and is heading to break it upwards strongly
We have a bounce from the lower limit of the descending channel, this support is at a price of 0.00250
We have a downtrend on the RSI indicator that is about to be broken, which supports the rise
We have a trend to stabilize above the moving average 100
Entry price 0.0258
First target 0.0283
Second target 0.0309
Third target 0.0340

#MYRO/USDT#MYRO
The price is moving in a descending channel on the 1-hour frame and is expected to continue upwards
We have a trend to stabilize above the moving average 100 again
We have a descending trend on the RSI indicator that supports the rise by breaking it upwards
We have a support area at the lower limit of the channel at a price of 0.0307
Entry price 0.0330
First target 0.0340
Second target 0.0356
Third target 0.0374

#MYRO/USDT#MYRO
The price is moving within a descending channel on the 1-hour frame and is expected to break and continue upward.
We have a trend to stabilize above the 100 moving average once again.
We have a downtrend on the RSI indicator, which supports the upward move by breaking it upward.
We have a support area at the lower limit of the channel at 0.001426, acting as strong support from which the price can rebound.
Entry price: 0.01588
First target: 0.01694
Second target: 0.01800
Third target: 0.01910

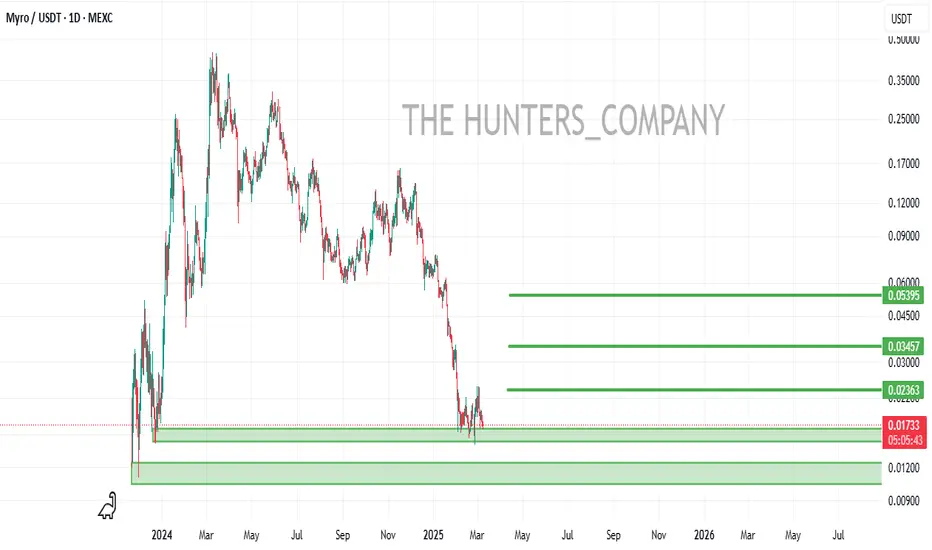
MYROUSDT 2D AnalysisMYRO ~ 2D Analysis
#MYRO Buy back on retest of this support block with short term target of at least 20%+ from this support.

#MYRO/USDT#MYRO
The price is moving within a descending channel on the 1-hour frame, adhering well to it, and is heading towards a strong breakout and retest.
We are experiencing a rebound from the lower boundary of the descending channel. This support is at 0.02333.
We are experiencing a downtrend on the RSI indicator, which is about to break and retest, supporting the upward trend.
We are heading towards stability above the 100 Moving Average.
Entry price: 0.02387
First target: 0.02434
Second target: 0.02475
Third target: 0.02536

MYROUSDT 3D AnalysisMYRO ~ 3D Analysis
#MYRO This trade is very high risk
Buy gradually from here with a short term target of at least 15%+, long term target $0.2 - $0.4

#MYRO/USDT#MYRO
The price is moving within a descending channel on the 1-hour frame, adhering well to it, and is heading for a strong breakout and retest.
We are seeing a bounce from the lower boundary of the descending channel. This support is at 0.02700.
We have a downtrend on the RSI indicator that is about to be broken and retested, supporting the upward trend.
We are looking for stability above the 100 moving average.
Entry price: 0.02750
First target: 0.02888
Second target: 0.03017
Third target: 0.03187

#MYRO/USDT#MYRO
The price is moving within a descending channel on the 1-hour frame and is expected to break and continue upward.
We have a trend to stabilize above the 100 moving average once again.
We have a downtrend on the RSI indicator, which supports the upward move by breaking it upward.
We have a support area at the lower limit of the channel at 0.03110, acting as strong support from which the price can rebound.
Entry price: 0.03280
First target: 0.03455
Second target: 0.03683
Third target: 0.03966
A bullish pattern was formed...Hello friends
Given the entry of buyers and the formation of an ascending pattern, you can enter into a transaction with capital and risk management and move towards the specified goals.
*Trade safely with us*

#MYRO/USDT#MYRO
The price is moving within a descending channel on the 1-hour frame, adhering well to it, and is on its way to breaking it strongly upwards and retesting it.
We are seeing a bounce from the lower boundary of the descending channel, this support at 0.02200.
We have a downtrend on the RSI indicator that is about to break and retest, supporting the upward trend.
We are looking for stability above the 100 Moving Average.
Entry price: 0.02368
First target: 0.02450
Second target: 0.02630
Third target: 0.02800

#MYRO/USDT#MYRO
The price is moving in a descending channel on the 1-hour frame and is adhering to it well and is heading to break it strongly upwards and retest it
We have a bounce from the lower limit of the descending channel, this support is at a price of 0.01670
We have a downtrend on the RSI indicator that is about to break and retest, which supports the rise
We have a trend to stabilize above the moving average 100
Entry price 0.01920
First target 0.02133
Second target 0.02133
Third target 0.02267

#MYRO/USDT#MYRO
The price is moving within a descending channel on the 1-hour frame, adhering well to it, and is on its way to breaking it strongly upwards and retesting it.
We are seeing a bounce from the lower boundary of the descending channel. This support is at 0.01037.
We have a downtrend on the RSI indicator that is about to break and retest, which supports the upward trend.
We are looking for stability above the 100 moving average.
Entry price: 0.01134
First target: 0.01200
Second target: 0.01273
Third target: 0.01362

MYROUSDT 2DMYRO ~ 2D Analysis
#MYRO This trade is very high risk. Buy from here with a short -term target of at least 15%+.

MYRO BUYHello friends
Due to the price correction, we are now at the bottom of the price and are on important support.
You can buy in steps according to the specified ranges.
We have also specified price targets for you.
*Trade safely with us*