$MYRO Poised to Break Above Consolidation, Eyes 200% Surge The Solana-based memecoin $MYRO is showing strong bullish signs, poised to break out from its recent consolidation phase with a potential 200% surge on the horizon. As traders anticipate a breakout, technical and fundamental indicators align, making $MYRO a token to watch closely.
Technical Analysis
$MYRO is currently trading with a Relative Strength Index (RSI) of 52, suggesting moderate momentum. While the asset remains below key moving averages, this setup strengthens the case for an impending breakout. Historically, tokens breaking above prolonged consolidation phases often witness sharp price increases, and $MYRO seems to be mirroring this trend.
A confirmed breakout from the current resistance could trigger a price discovery mode, paving the way for a 200% move. However, traders should monitor volume and key resistance levels to validate the move before entering positions.
The Myro Narrative
Beyond technical indicators, the Myro project stands out as a community-driven memecoin inspired by Raj Gokal’s dog, Myro. In an era where dog-themed tokens like CRYPTOCAP:DOGE and CRYPTOCAP:SHIB have dominated narratives, $MYRO finds its unique place within the Solana ecosystem.
Market Data & Price Action
- Current Price: $0.019886
- 24-Hour Trading Volume: $15,915,903
- 24-Hour Performance: +30.33%
- Market Cap: $18,776,340
- CoinMarketCap Ranking: #854
- Circulating Supply: 944,203,815 MYRO
$MYRO’s impressive 30.33% surge in the last 24 hours indicates strong buying interest. With increasing trading volume and a solid market presence, the token is gaining traction as a promising investment within the memecoin space.
MYROUSD

MYRO ANALYSIS (1D)The correction of MYRO started from the point where we placed the red arrow on the chart.
It is one of the meme coins that has dropped significantly. The pattern of this drop is a large diametric.
The green zone is where the price could push upward to complete wave F.
Targets are marked on the chart.
A daily candle closing below the invalidation level will invalidate this analysis.
For risk management, please don't forget stop loss and capital management
Comment if you have any questions
Thank You

300% gains BONK Best Level to BUY/HOLD swing trade setup🔸Hello guys, today let's review daily price chart for BONK. Outlook remains bullish currently pullback in progress, however buying low still is a perfect trade setup.
🔸BONK is one of the top rated solana meme coins. currently undergoing correction and still not complete, however risk/reward is shifting in bulls favor right now. we are close to the floor / reload zone for the bulls.
🔸Recommended strategy bulls: Price action contained within bullish channel. get ready to buy low near 11000/13000, TP is 33000/36000 +300% gain. BUY/HOLD setup for patient traders. keep in mind that BONK already got a heavy valuation, so do not expect miracle overnight gains.
🎁Please hit the like button and
🎁Leave a comment to support our team!
RISK DISCLAIMER:
Trading Futures , Forex, CFDs and Stocks involves a risk of loss.
Please consider carefully if such trading is appropriate for you.
Past performance is not indicative of future results.
Always limit your leverage and use tight stop loss.

MYROUSDT 2DMYRO ~ 2D Analysis
#MYRO This trade is very high risk, But if you still have a Conviction in this coin, the price increase of 20%+ is not too difficult from here.

#MYRO/USDT Ready to go higher#MYRO
The price is moving in a descending channel on the 1-hour timeframe and sticking to it well
We have a bounce from the lower limit of the descending channel, this support is at 0.0365
We have a downtrend on the RSI indicator that is about to break, which supports the rise
We have a trend to stabilize above the moving average 100
Entry price 0.0391
First target 0.0415
Second target 0.0464
Third target 0.0521

MYRO ROADMAP (1D)From the point where we placed the red arrow on the chart, it seems that MYRO's correction has begun.
This correction appears to be a diametric pattern, and we are currently in wave E of this diametric, which is a bearish wave.
The green zone represents a low-risk area for buy/long positions.
The closure of a daily candle below the invalidation level will invalidate this analysis.
For risk management, please don't forget stop loss and capital management
Comment if you have any questions
Thank You

#MYRO/USDT Ready to go higher#MYRO
The price is moving in a descending channel on a 15-minute frame and sticking to it well
We have a bounce from the lower limit of the descending channel, this support is at a price of 0.0573
We have a downtrend on the RSI indicator that is about to be broken, which supports the rise
We have a trend to stabilize above the moving average 100
Entry price 0.0588
First target 0.0606
Second target 0.0627
Third target 0.0658

The Best Level to BUY/HOLD MYRO 600% gains🔸Hello guys, today let's review daily price chart for MYRO. Noteworthy compression in progress right now, bullish 3 drives pattern pending completion in January 2025.
🔸Three drives defined by subsequent lows at 12 cents, 6 cents, final low incoming at 3 cents, get ready to BUY LOW for massive gains in the next 4-8 weeks.
🔸Recommended strategy bulls: bullish structure and compression in progress. Accumulate near 3-4 cents, TP bulls is +600% gains, final exit at 24/25 cents. good luck traders!
🎁Please hit the like button and
🎁Leave a comment to support our team!
RISK DISCLAIMER:
Trading Futures , Forex, CFDs and Stocks involves a risk of loss.
Please consider carefully if such trading is appropriate for you.
Past performance is not indicative of future results.
Always limit your leverage and use tight stop loss.

#MYRO/USDT#MYRO
The price is moving in a descending channel on the 4-hour frame and is expected to continue upwards
We have a trend to stabilize above the moving average 100 again
We have a descending trend on the RSI indicator that supports the rise by breaking it upwards
We have a support area at the lower limit of the channel at a price of 0.0582
Entry price 0.0669
First target 0.0779
Second target 0.0897
Third target 01020

MYROUSDT 3DMYRO Update ~ 3D
#Myro Retesting this support block,. If you still have Conviction on this coin,. This support block would be a very good buy spot for now. buy in stages with a minimum target of 20%+

MYROUSDT 3DMYRO ~ 3D
#MYRO So far it continues to maintain this support level. If you still have Conviction on the coin,. Buy in stages from here. with a minimum target of 20%+
Give me some energy !!!After this heavy drop, MYRO has now formed an ascending triangle in the 15-minute time frame, which could be a sign of a bullish trend. Please note that this analysis is in the 15-minute time frame.
Give me some energy !!
✨We spend hours finding potential opportunities and writing useful ideas, we would be happy if you support us.
Best regards CobraVanguard.💚
_ _ _ _ __ _ _ _ _ _ _ _ _ _ _ _ _ _ _ _ _ _ _ _ _ _ _ _ _ _ _ _
✅Thank you, and for more ideas, hit ❤️Like❤️ and 🌟Follow🌟!
⚠️Things can change...
The markets are always changing and even with all these signals, the market changes tend to be strong and fast!!

#MYRO/USDT#MYRO
The price is moving in a descending channel on the 4-hour frame and is sticking to it well
We have a bounce from the lower limit of the descending channel and we are now touching this support at 0.0960
We have a downtrend on the RSI indicator that is about to be broken, which supports the rise
We have a trend to stabilize above the moving average 100
Entry price 0.1030
First target 0.1146
Second target 0.1229
Third target 0.1325

MYROUSDT Approaches Descending Channel Breakout!MYROUSDT TEchnical analsysi update
MYROUSDT has been trading within a descending channel pattern for the past 250 days and is now moving toward the channel's resistance line for a potential breakout. In recent days, volume has increased, and the price is trading above the 100 and 200 EMAs on the daily chart, which is also considered a bullish signal for MYRO.

MYROUSDTMYRO ~ 3D
#MYRO This support block is a great time to buy gradually. With a short term target of at least 20%++

MYROUSDTMYRO ~ 3D Update
#MYRO Very clearly, a break of this resistance line will confirm that bullishness is coming quickly.

MYROUSDT Bullish Flag!MYROUSDT Technical analsysi update
MYRUSDT is forming a bullish flag pattern on the 4H chart, and the price is now breaking out of the flag. On the daily chart, the previous resistance zone is acting as support, with the 100 and 200 EMAs providing support at the flag's bottom. A strong bullish move can be expected.
Buy zone : Below $0.113
Stop loss : $0.0975
Take Profit 1: $0.124
Take Profit 2: $0.140
Take Profit 3: $0.20

MYROUSDT Set to Break Resistance SoonMYROUSDT technical analysis update
MYRO price is moving towards the resistance level, which has previously rejected multiple attempts. This time, the price is likely to break through the resistance, and we can expect a 100%–200% move in the mid-term. MYRO volume is gradually increasing.
Buy after the breakout confirmation in the day chart.

MYROUSDT Trend Reversal ConfirmedMYROUSDT technical analysis update
MYROUSDT has been trading within a range for the past 70 days. The price has now broken through the resistance zone with high volume and is breaking above the 100 EMA on the daily chart. This can be considered a bullish signal for MYRO.
Hexa

MYROUSDTMyro ~ 3D ✅
#Myro If you like trading Memes. Maybe you need to pay attention to this meme to start buying. maybe to gain 20%++ from here is not that difficult. This meme was once hype at its time.

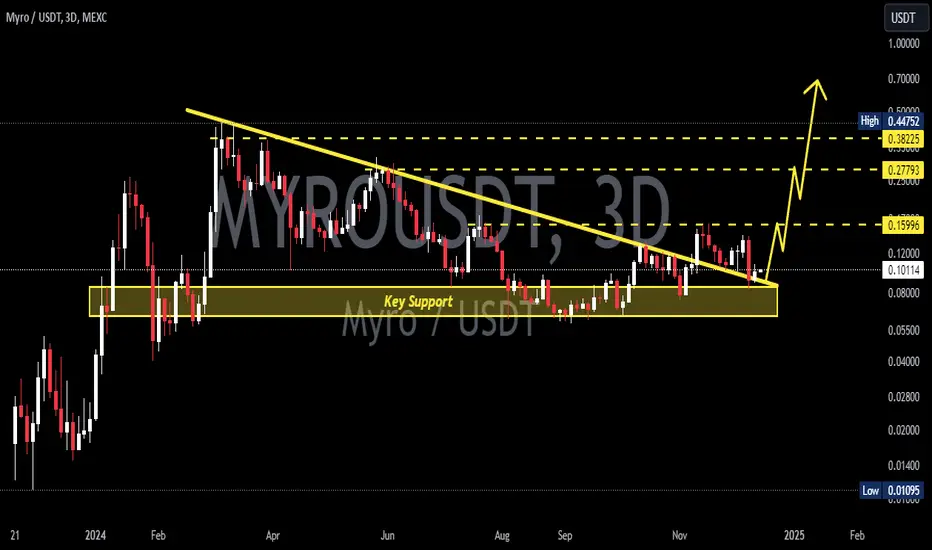
Myro targets If we will see new Solana Memecoins hype this is BYBIT:MYROUSDT targets
Possible Targets and explanation idea
➡️D tf downtrend correction since March 2024
➡️ 0.45 target will be like a magnet
➡️ Would be good to see close W fvg
➡️ Test buy line or fundamental value Take profit indicator
➡️ Need to see new money inflow in Myro or D and W tf Money power indicator
➡️Based on Trade On we could track sell and buy local trades. Waiting main signal on W tf for uptrend
Hope you enjoyed the content I created, You can support with your likes and comments this idea so more people can watch!
✅Disclaimer: Please be aware of the risks involved in trading. This idea was made for educational purposes only not for financial Investment Purposes.
---
• Look at my ideas about interesting altcoins in the related section down below ↓
• For more ideas please hit "Like" and "Follow"!

MYRO has good signals for continuing the bullish movementMYROUSDT is forming a falling wedge on Daily timeframe , Up we go if we do breakout. the price can be bullish and I expect the price to go up to the Fibonacci line of 0.618 = 0.2. Stay tuned for more updates, thanks.
✨We spend hours finding potential opportunities and writing useful ideas, we would be happy if you support us.
Best regards CobraVanguard .💚
_ _ _ _ __ _ _ _ _ _ _ _ _ _ _ _ _ _ _ _ _ _ _ _ _ _ _ _ _ _ _ _
✅Thank you, and for more ideas, hit ❤️Like❤️ and 🌟Follow🌟!
⚠️Things can change...
The markets are always changing and even with all these signals, the market changes tend to be strong and fast!!

MYROUSDT Falling Wedge Breakout: Bullish Momentum BuildingMYROUSDT technical analysis update
MYRO recently broke out of the falling wedge pattern and is now bouncing off retest support. The key resistance lies at the $0.10 level, and once the price breaks through, a strong bullish move in MYROUSDT is expected.
Thanks
Hexa
