$MYRO long idea$MYRO is showing some relative strength
If Bitcoin will continue to move in range holding 67k level, we can long MYRO around .150 to .143 targeting those poor highs above
Targets:
.185
.203
.234
Stoploss:
Below .13
MYROUSDT

MYRO looks bearishFrom where we put the red arrow on the chart, it looks like MYRO's bullish diametric is over and the BNX correction has started.
It looks like a correction of an ABC or more complex pattern as we are now in the middle of wave B
It can move down from the red box.
The targets are clear on the chart
Closing a daily candle above the invalidation level will violate the analysis
For risk management, please don't forget stop loss and capital management
When we reach the first target, save some profit and then change the stop to entry
Comment if you have any questions
Thank You

MYRO ANALYSIS (6H)It is one of the famous symbols of the SOL network, which is trending.
It seems to have formed a large diametric which is now at the end of the E wave.
If it reaches the green range, you can look for buy/long positions.
The targets are marked on the chart.
Closing a daily candle below the invalidation level will violate the analysis
For risk management, please don't forget stop loss and capital management
When we reach the first target, save some profit and then change the stop to entry
Comment if you have any questions
Thank You

#MYRO/USDT#MYRO
We have a bullish channel pattern on a 4-hour frame, the price moves within it and adheres to its limits well
We have a green support area at 0.120
We have a tendency to stabilize above moving average 100
We have an uptrend on the RSI indicator that supports the price higher
Entry price is 0.1670
The first goal is 0.200
The second goal is 0.230
The third goal is 0.2733

#MYRO MIDTERM TRADE SETUP!#MYRO Breakout this ascending triangle pattern, and currently it is coming to retest it.
If it successfully retests this pattern, then we can expect a potential rally.
Technically, as per the pattern, we can expect almost a 60% bounce.
Entry: CMP and add more up to $0.203
SL: $0.191
Leverage: 2X to 5X
DYOR, NFA

MYRO UpdateMYRO failed to pump as i was previously expecting. I think we will see another leg down before pulling back up. I am monitoring the price action and i will look closely the $0.12/0.10 area. This is a strong support zone were price could perform a reversal pattern and come back to new highs

MYRO Is getting strongerMYRO is a coin that gave me good profits this year. Who is following me from some months, has achieved a good 8x on MYRO. Now i think we are ready for round two, and this coin is getting stronger. I think we will see a solid upside moves, my first target is the resistance area at $0.22 first and $0.32 second

MYRO Bullish Breakout Coming 4hr candle MUST close above 0.15447
Set Alert at 0.16434
Market Cap 140M
MEME
stop loss 0.14501
target 0.20259
Not financial advise

#MYRO/USDT#MYRO
The price is moving in a downward channel and adheres to it perfectly on a 1-hour frame, about to break to the upside
The currency has been listed on more than one trading platform, which gives it a strong bullish momentum
We have a positive divergence on the RSI indicator that strengthens the trend
Entry price is 0.2470
The first target is 0.2755
The second goal is 0.3045
the third goal is 0.3362

MYRO Expecting a bounceI am expecting a bounce on MYRO here. We can see it's moving on strong support level, and price started a deviation here in the previous weeks. Considering the recent pump on BTC, we can expect a pump on MYRO also, targeting the resistance area at $36

EVEAI Following the setupEVEAI is nicely following my previous setup. It dropped, and it's now ranging in a good accumulation zone. As we can see, it has already broken up from main trendline. I expect a pump in the coming weeks

MYRO Long setupMYRO is bouncing from a support zone (black box) and looks ready for a new pump. I placed my stoploss just below local bottom, targeting new highs

MYRO/USDT Eyeing for a Bullish Momentum? 👀🚀MYRO Analysis💎Paradisers, get ready as #MYROUSDT catches our eye with its notable trajectory, heading towards critical support following a rebound off a substantial resistance.
💎With the momentum potentially in its favor, there's a significant chance for a recovery from this point, echoing the resilience shown by this support in past encounters, where it initiated strong bullish actions four times.
💎Currently, #Myro is experiencing a downturn, as evidenced by pronounced red candles that signal hefty selling pressure. However, we're keeping a step ahead, watching how the price interacts with the key support level. Upon securing confirmation, we'll tactically plan our approach.
💎For the savvy trader, if #MYRO's momentum falters at this crucial support and descends further, we'll eye a bullish resurgence from the lower demand zone, bolstered by liquidity. There's a solid likelihood for $MYRO to rally from this dip, whereas a breach below this point could precipitate a marked decline.

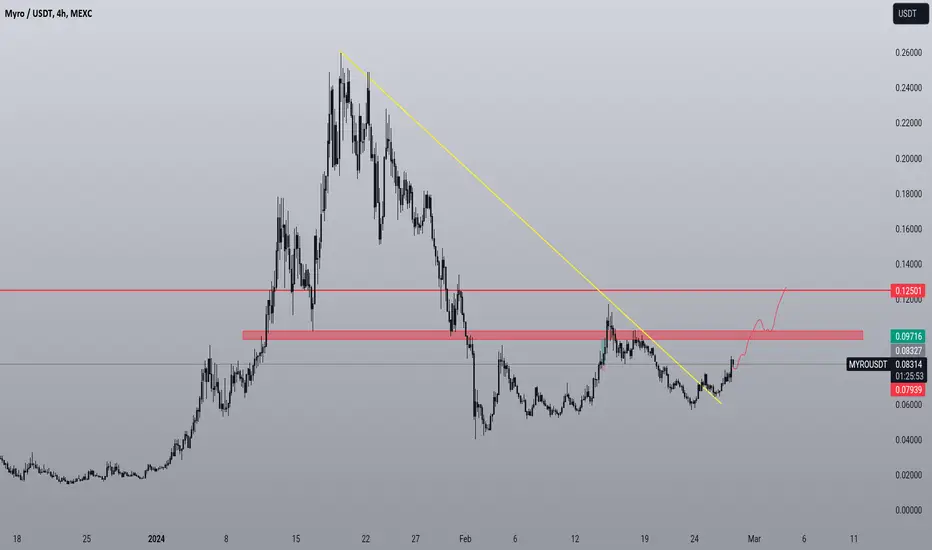
MYROUSDTPRice is retracing in the weekly control candle. Good clean chart. Just have to be patient to see if a potential bottom is forming.

The road to 1$ MYROMYRO is definitely one of the best coin i bought this year. I started buying from 0.07, we are up 6X and when price will reach $1, we will be at 14X of profit. I highlited the resistance level where i expect the price to bounce

Capitalizing on MYRO: Strategic Long Opportunity in MyroMEXC:MYROUSDT is showcasing a compelling setup for a potential long position. The technical indicators on the 4-hour chart signal a consolidation period post a significant uptrend, marked by the price holding firmly above key moving averages and an established ascending trendline. While the inherent volatility of meme tokens commands a cautious approach, the current chart patterns aligned with prudent risk management suggest a favorable entry point for traders looking to leverage Myro's current momentum. As always, such trades should be balanced with a well-considered strategy, especially given the often unpredictable nature of meme-based digital assets.
Here is my Setup arguments and why am i entering a long position here and targeting only 200% and exit without taking any more risk or greed:
Breakout Above Resistance: Which may now serve as support, offering a good risk-to-reward ratio for entry.
Ascending Trendline Support: The ascending Magenta Trendline that served before as a strong support that was respected in the logarithmic scale of the chatrt which indicates an overall bulllish momentum.
Bullish Price Pattern: The consolidation pattern resembles a bull flag, which often precedes continuation of the uptrend which actually happened to be broke upwards and retested.
Price Above EMAs: Suggesting a continued bullish trend.
And also not to forget the overall sentiment in the meme market right now especially in Solana. So these are all enough reasons for me to open a long trade here with only 200% TPR as mentioned.
It is essential to consider risk management strategies such as setting a stop loss below the last swing low, and to size the position appropriately for your portfolio. Additionally, external factors such as market news, fundamental analysis, and overall market sentiment should be considered before entering a trade.
Peace out

Some thoughts about MYROMYRO is for sure in a good uptrend, and actually i can't see nothing that would make me think about a drop. But i expect the price to touch the main trendline i drawed. Here we have two possibility:
Retest it again and next resume the pump
Break it down, retest it and drop
If the price will drop, it will be awesome to see MYRO to trade again in the 0.055/0.08 zone. I don't know if we will ever be there again, but it would be an awesome entry point.

Here is your first 6x MYROI started buying MYRO at $0.056 and actually we are up around 6x. It was a great journey, and this is not the end. I expect a continuation till next resistance zone at $0.5

MYROUSD 1D#MYRO ~ 1D
Make purchases in stages from here. Minimum target 20%.
Make a purchase with a small amount, because this is a meme token.

MYRO Update : On trackMyro is nicely following my main ideas. It's actually accumulating and ranging in the 0.1-0.055 zone. I expect a little correction before pumping targeting the resistance zone at 0.12
MYROUSDT LIMIT ORDER!!BYBIT:MYROUSDT.P
Myrousdt seems to be bottoming on all charts so i have put a limit order in for the long!
I am considering doing a stream for you guys, comment if i should!
thanks people, happy thursday

Elliott Wave Analysis with Volume Profiles and Open InterestMYROAnalysis. eliott wave: the price action conforms to elliot wave theory, suggesting a potential bullish move with the completion of wave 5. volume profile (January 38th - february 3rd) the initial volume profile indicates that the price has previosly visted the point of control (poc), and it appears to be retracing towwards the upper 70% line, which could serve as oyr TP3. Volume profile (february 2nd-february 19th): the subsequent volume profile suggest that the ptice is finding support around the 70% line, this support level has also acted as resistance in previous instances. Openinterest: there is a bullish and green candle observed in the open interest data, indicatng potential bullish sentiment.

MYRO Scalp longI am scalping long MYRO. BTC is pumping, and i expect a pump on alts also. MYRO is in accumulation zone, and looks ready to target resistance zone, tight stop
