MYRO/USDT Testing Key Support – Breakout or Breakdown?📊 Complete and Relevant Chart Analysis:
The MYRO/USDT pair is currently in a consolidation phase after experiencing a medium-term downtrend. Several key technical elements can be observed in this chart:
---
🟡 Support Zone (Demand Area):
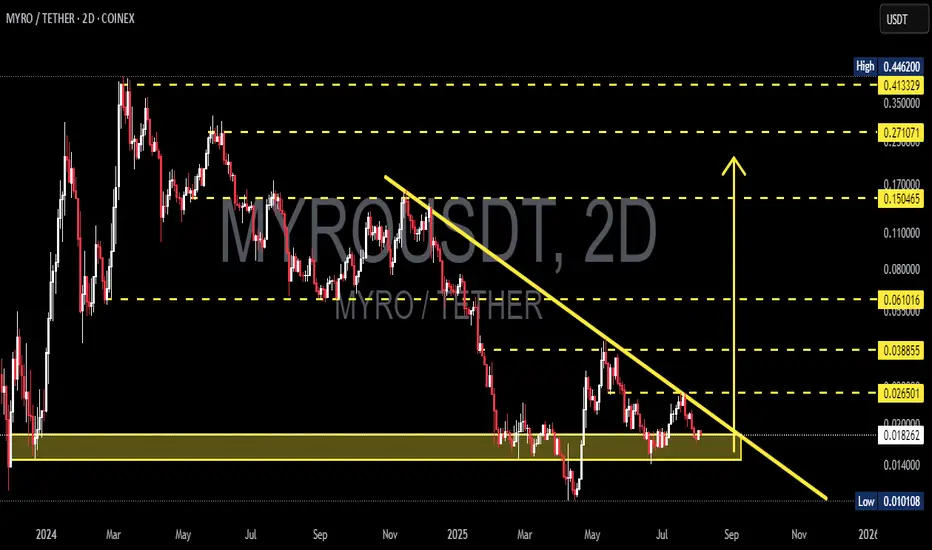
Price is now sitting at a strong support zone (yellow box), ranging around $0.014 – $0.018, which has been tested multiple times throughout 2024–2025.
This zone serves as a potential accumulation base and could act as a springboard for a reversal.
---
📉 Descending Trendline Resistance:
A dominant descending trendline from the November 2024 high continues to suppress the price.
The price has yet to break above this trendline, indicating sellers are still in control on the medium-term timeframe.
---
📈 Key Resistance Levels:
Based on previous structure and potential retracement targets:
$0.026501
$0.038855
$0.061016
$0.150465
$0.271071
---
📉 Nearest Support Levels:
$0.018287 (current price)
If price breaks down below this zone, it may drop toward $0.014000 or even $0.010108 (all-time low)
---
🧠 Pattern & Structure:
A clear Descending Triangle pattern is forming, typically a bearish continuation. However, as price nears the apex and holds the support zone, this could also signal a potential reversal setup.
Volume confirmation will be crucial if a breakout occurs.
---
🚀 Bullish Scenario:
1. Price bounces off the strong support zone and successfully breaks the descending trendline with solid volume.
2. Targets on the upside include:
$0.0265 (minor resistance)
$0.0388
$0.0610 (psychological and technical level)
---
🔻 Bearish Scenario:
1. If price fails to hold above $0.018 and breaks down from the yellow support box:
A drop toward $0.0140 is likely, with potential extension to $0.0101.
2. Increasing selling pressure and low volume on the bounce would strengthen this bearish outlook.
---
🎯 Conclusion:
MYRO/USDT is at a critical juncture, testing a major support level and nearing the end of a descending triangle. The next movement will determine whether we see a bullish breakout or a continuation of the bearish trend.
#MYROUSDT #CryptoAnalysis #AltcoinSetup #SupportResistance #BreakoutTrade #DescendingTriangle #TechnicalAnalysis #CryptoSupport #ReversalPattern #CryptoTrading
Myrousdtanalysis
MYROUSDT Breaks Out of Inverse Head and Shoulders BYBIT:MYROUSDT has a clear breakout from an Inverse Head and Shoulders pattern, signaling a potential bullish trend reversal. Price has decisively broken above the neckline around the $0.025 level, supported by increased volume. Additionally, MYRO price is trading above both the 100 EMA and 200 EMA, reinforcing the bullish momentum.
#MYRO/USDT myro road map ( 1 H )#MYRO
The price is moving within a descending channel on the 1-hour frame and is expected to break and continue upward.
We have a trend to stabilize above the 100 moving average once again.
We have a downtrend on the RSI indicator that supports the upward break.
We have a support area at the lower boundary of the channel at 0.02040, acting as a strong support from which the price can rebound.
We have a major support area in green that pushed the price upward at 0.01900.
Entry price: 0.02087
First target: 0.02178
Second target: 0.02278
Third target: 0.02373
To manage risk, don't forget stop loss and capital management.
When you reach the first target, save some profits and then change the stop order to an entry order.
For inquiries, please comment.
Thank you.

#MYRO/USDT#MYRO
The price is moving in a descending channel on the 1-hour frame and is adhering to it well and is heading to break it strongly upwards and retest it
We have a bounce from the lower limit of the descending channel, this support is at a price of 0.01562
We have a downtrend on the RSI indicator that is about to break and retest, which supports the rise
We have a trend to stabilize above the moving average 100
Entry price 0.01652
First target 0.01730
Second target 0.01784
Third target 0.01886

#MYRO/USDT#MYRO
The price is moving in a descending channel on the 1-hour frame and is adhering to it well and is heading to break it strongly upwards and retest it
We have a bounce from the lower limit of the descending channel, this support is at a price of 0.0190
We have a downtrend on the RSI indicator that is about to break and retest, which supports the rise
We have a trend to stabilize above the moving average 100
Entry price 0.0214
First target 0.0227
Second target 0.0243
Third target 0.0256

#MYRO/USDT Financial covenant#MYRO
The price is moving in a descending channel on the 1-hour frame and is adhering to it well and is heading to break it upwards strongly
We have a bounce from the lower limit of the descending channel, this support is at a price of 0.00250
We have a downtrend on the RSI indicator that is about to be broken, which supports the rise
We have a trend to stabilize above the moving average 100
Entry price 0.0258
First target 0.0283
Second target 0.0309
Third target 0.0340

MYROUSDT 2D AnalysisMYRO ~ 2D Analysis
#MYRO Buy back on retest of this support block with short term target of at least 20%+ from this support.

#MYRO/USDT#MYRO
The price is moving within a descending channel on the 1-hour frame, adhering well to it, and is heading towards a strong breakout and retest.
We are experiencing a rebound from the lower boundary of the descending channel. This support is at 0.02333.
We are experiencing a downtrend on the RSI indicator, which is about to break and retest, supporting the upward trend.
We are heading towards stability above the 100 Moving Average.
Entry price: 0.02387
First target: 0.02434
Second target: 0.02475
Third target: 0.02536

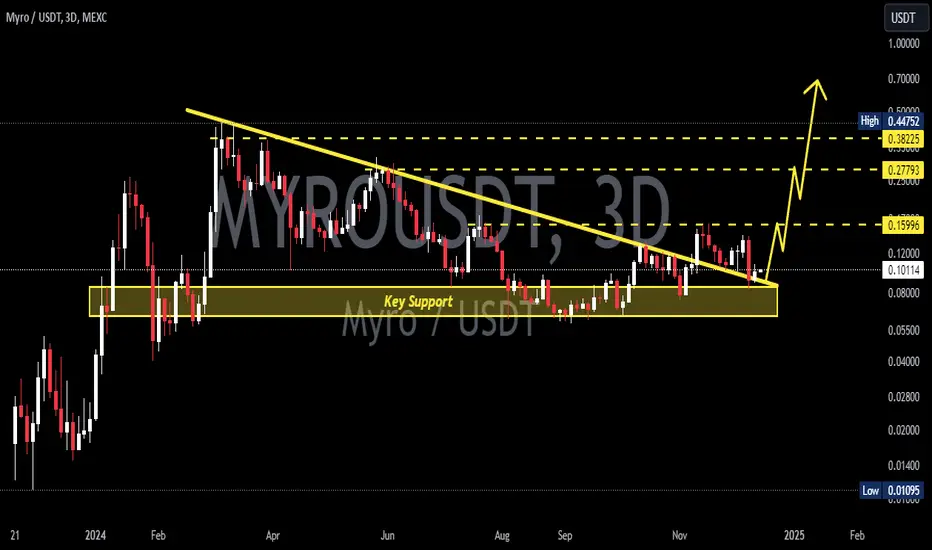
MYROUSDT 3D AnalysisMYRO ~ 3D Analysis
#MYRO This trade is very high risk
Buy gradually from here with a short term target of at least 15%+, long term target $0.2 - $0.4

A bullish pattern was formed...Hello friends
Given the entry of buyers and the formation of an ascending pattern, you can enter into a transaction with capital and risk management and move towards the specified goals.
*Trade safely with us*

#MYRO/USDT#MYRO
The price is moving within a descending channel on the 1-hour frame, adhering well to it, and is on its way to breaking it strongly upwards and retesting it.
We are seeing a bounce from the lower boundary of the descending channel. This support is at 0.01037.
We have a downtrend on the RSI indicator that is about to break and retest, which supports the upward trend.
We are looking for stability above the 100 moving average.
Entry price: 0.01134
First target: 0.01200
Second target: 0.01273
Third target: 0.01362

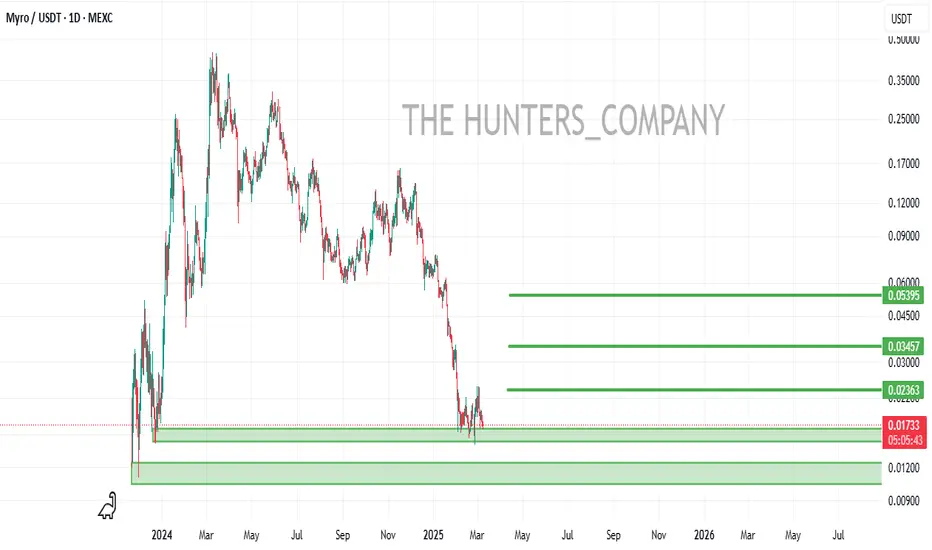
MYROUSDT 2DMYRO ~ 2D Analysis
#MYRO This trade is very high risk. Buy from here with a short -term target of at least 15%+.

MYRO BUYHello friends
Due to the price correction, we are now at the bottom of the price and are on important support.
You can buy in steps according to the specified ranges.
We have also specified price targets for you.
*Trade safely with us*
$MYRO Poised to Break Above Consolidation, Eyes 200% Surge The Solana-based memecoin $MYRO is showing strong bullish signs, poised to break out from its recent consolidation phase with a potential 200% surge on the horizon. As traders anticipate a breakout, technical and fundamental indicators align, making $MYRO a token to watch closely.
Technical Analysis
$MYRO is currently trading with a Relative Strength Index (RSI) of 52, suggesting moderate momentum. While the asset remains below key moving averages, this setup strengthens the case for an impending breakout. Historically, tokens breaking above prolonged consolidation phases often witness sharp price increases, and $MYRO seems to be mirroring this trend.
A confirmed breakout from the current resistance could trigger a price discovery mode, paving the way for a 200% move. However, traders should monitor volume and key resistance levels to validate the move before entering positions.
The Myro Narrative
Beyond technical indicators, the Myro project stands out as a community-driven memecoin inspired by Raj Gokal’s dog, Myro. In an era where dog-themed tokens like CRYPTOCAP:DOGE and CRYPTOCAP:SHIB have dominated narratives, $MYRO finds its unique place within the Solana ecosystem.
Market Data & Price Action
- Current Price: $0.019886
- 24-Hour Trading Volume: $15,915,903
- 24-Hour Performance: +30.33%
- Market Cap: $18,776,340
- CoinMarketCap Ranking: #854
- Circulating Supply: 944,203,815 MYRO
$MYRO’s impressive 30.33% surge in the last 24 hours indicates strong buying interest. With increasing trading volume and a solid market presence, the token is gaining traction as a promising investment within the memecoin space.

MYROUSDT 2DMYRO ~ 2D Analysis
#MYRO This trade is very high risk, But if you still have a Conviction in this coin, the price increase of 20%+ is not too difficult from here.

#MYRO/USDT Ready to go higher#MYRO
The price is moving in a descending channel on the 1-hour timeframe and sticking to it well
We have a bounce from the lower limit of the descending channel, this support is at 0.0365
We have a downtrend on the RSI indicator that is about to break, which supports the rise
We have a trend to stabilize above the moving average 100
Entry price 0.0391
First target 0.0415
Second target 0.0464
Third target 0.0521

#MYRO/USDT Ready to go higher#MYRO
The price is moving in a descending channel on a 15-minute frame and sticking to it well
We have a bounce from the lower limit of the descending channel, this support is at a price of 0.0573
We have a downtrend on the RSI indicator that is about to be broken, which supports the rise
We have a trend to stabilize above the moving average 100
Entry price 0.0588
First target 0.0606
Second target 0.0627
Third target 0.0658

MYROUSDT 3DMYRO Update ~ 3D
#Myro Retesting this support block,. If you still have Conviction on this coin,. This support block would be a very good buy spot for now. buy in stages with a minimum target of 20%+

$MYRO Trend Reversal This coin looks like a solid buy here, definitely spot and also perps with SL below 0.06.
WIll fly straight to ATH

MYROUSDT 3DMYRO ~ 3D
#MYRO So far it continues to maintain this support level. If you still have Conviction on the coin,. Buy in stages from here. with a minimum target of 20%+
#MYRO/USDT#MYRO
The price is moving in a descending channel on the 4-hour frame and is sticking to it well
We have a bounce from the lower limit of the descending channel and we are now touching this support at 0.0960
We have a downtrend on the RSI indicator that is about to be broken, which supports the rise
We have a trend to stabilize above the moving average 100
Entry price 0.1030
First target 0.1146
Second target 0.1229
Third target 0.1325

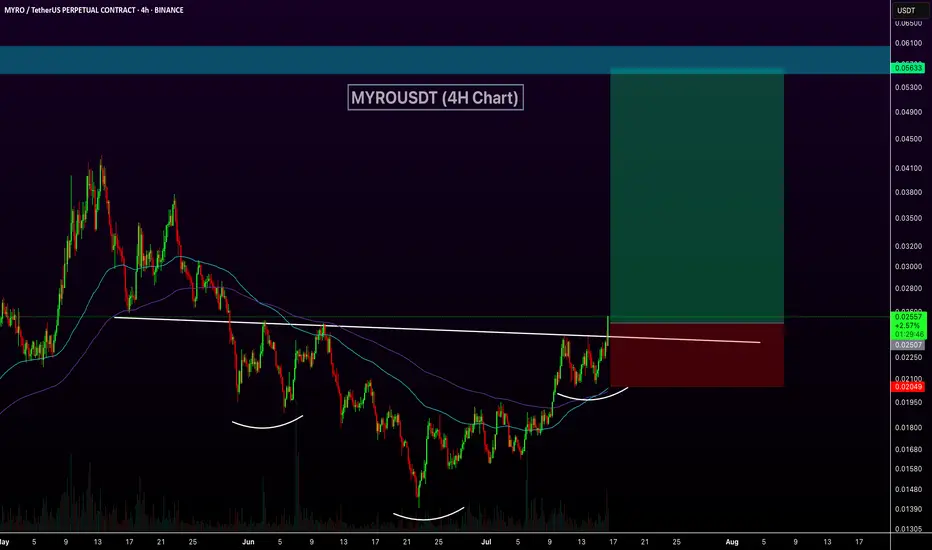
Is MYROUSDT Setting Up for a Bullish Breakout, or Is It a Trap?Yello, Paradisers! 🚨 Are you prepared for the potential bullish move on MYROUSDT?
💎MYROUSDT broke out of a key resistive trendline and is now consolidating. Within this consolidation phase, a W pattern appears to be forming.
💎If MYROUSDT breaks and closes above the resistant zone, this will validate the W pattern and significantly increase the likelihood of a strong bullish move. However, caution is essential! The broader market trend, especially BTC’s price action, will play a crucial role. If BTC shows signs of strength, it will further support our bullish bias. But if BTC starts turning bearish, it’s better to avoid this analysis.
💎On the flip side, if MYROUSDT breaks down and closes below the support zone, this would invalidate our bullish outlook completely.
🎖Always remember, Paradisers, disciplined trading and patience will set you apart from the crowd. Stick to your strategy and wait for the highest probability setups.
MyCryptoParadise
iFeel the success🌴

MYROUSDT Approaches Descending Channel Breakout!MYROUSDT TEchnical analsysi update
MYROUSDT has been trading within a descending channel pattern for the past 250 days and is now moving toward the channel's resistance line for a potential breakout. In recent days, volume has increased, and the price is trading above the 100 and 200 EMAs on the daily chart, which is also considered a bullish signal for MYRO.
