NGCUSDT breakout +2000% possible Gains!
Hey traders,
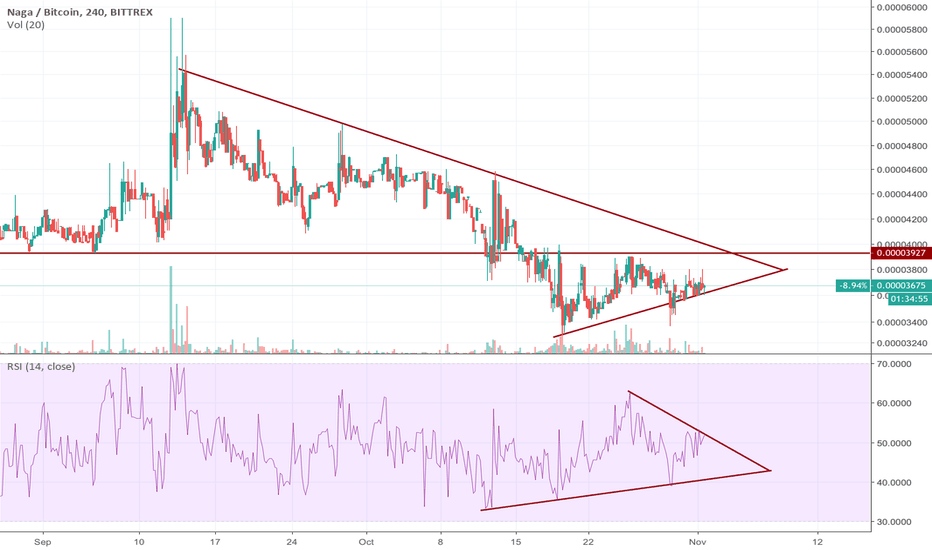
The chart shows a Positive divergence in the RSI indicator.
The NGCUSDT price is testing the daynamic daily resistance & 4H channel .
You can see the broken downtrend line.
I think this coin is a great choice and even if you buy for only 5% - 10% of your funds, it can be a smart bet.
Will it reach the moon?
Do not forget to use Stop loss.
Please like and share.
Thank you.
NAGA
Naga Coin Tenbagger Dream IIChart painting from the early 21st century, artist Maxi Scalibusa. No investment advice or a recommendation to buy or sell any securities. This is entertainment. Start 0.60018810 USD
Please also look at the 1st part. You can find this in the ideas linked below.
ALOHA
Naga Coin Tenbagger DreamChart painting from the early 21st century, artist Maxi Scalibusa. No investment advice or a recommendation to buy or sell any securities. This is entertainment. Start 0.04714986 USD
Naga (NGC) Conquers EMA300, 140% Now Possible!Notice the gray line on the chart... This line stands for EMA300.
NGCBTC produced really strong growth once it moved above this level on 9-Oct.
Now that NGCBTC is trading above EMA300, the doors are open for strong growth.
We can see strong bullish action with any trading above EMA300.
We are also bullish above MA200.
If prices break and close below the MA200 black line, our bullish bias is lost and a new analysis is needed.
Remember to build a plan before you trade.
This is not financial advice.
Namaste.
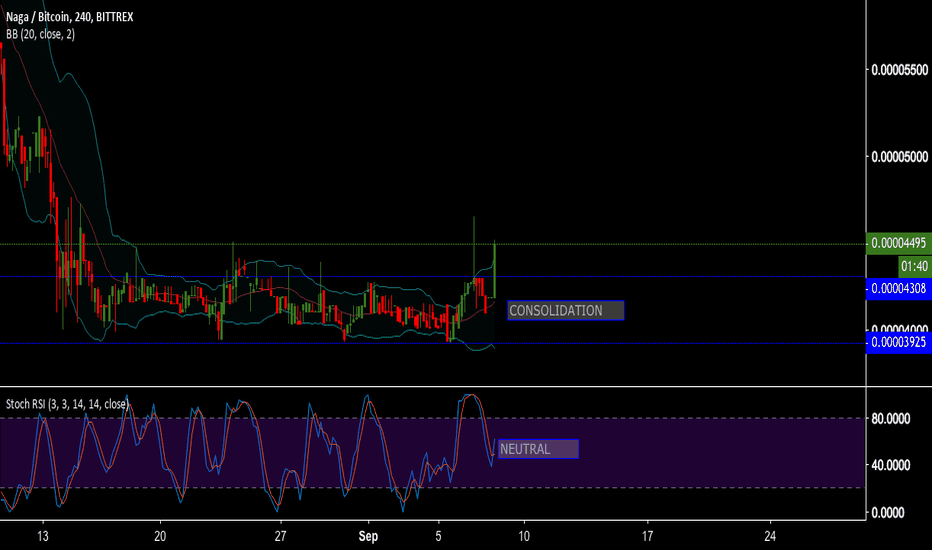
CONSOLIDATING NAGANaga price is on a constant price range spree, as the price doesn't seem to achieve any trend direction from the near term price movements. Stochastic RSI confirms this as it is converging at the centre around the neutral level, 50. Currently no trade signal setup is recommended on Naga. Traders should wait on this until further clear entries are observed. Price is testing the upper band on the bollinger bands, and this could be a possible sign on an uptrend break.
NAGABTC
NGCBTC


