Nakedchart

GBPAUD TRADE IDEA POTENTIAL 200-300 PipsWhat’s Up Forex Community...
Been a long time, however #ForexFargo checking back in.
Analysis is on #GBPAUD today.
Will Be Looking For Long as long as...
Holds as Support Zone
Wait for Price Action confirmation
Price has potential to stop hunt & wick off @ A Daily Low level of 1.80550ish for Premium Entries (aggressive)
Wait for 1hr closure above zone for solid confirmation (conservative)
Potential 200-300 Pip Reward
Potential Entries would be @ 1.80550-181250
Waiting to see what AUD news does later in terms of creating potential stop hunts and getting better entries at a institutional level if possible.
If price doesn’t make it down to my projected area, then I will look to enter this trade as price enters my zone marked as a conservative approach with less risk involved.


CADJPY Price Action AnalysisThe all structure chart CADJPY price can move up based on open price sequence candle.

Gold Price Movement- Price Action Trading AnalysisBased on gold chart analysis the price movement can drop at price level 1395.80.


EURJPY Breakout Get Ready For BIG MOVES!My Idea On EURJPY .
EURJPY possible collapse since the price have been closed below daily Uptrend TRENDLINE,Minor RESISTANT And Still inside DOWNTREND CHANNEL.
Wait for pullback before ENTRY.
Take-profit on nearest support
If Price fail to close above 123.200 it will likely to break lower
This is just my opinion on EURJPY .
Trading foreign exchange carries a high level of risk.
All predictions are strictly speculative and for educational purposes only therefore Use effective risk management.
However trading is complex instruments and involve high Risk and may not be suitable for all investors. Past performance does not guarantee future results.Trading foreign exchange carries a high level of risk.
All predictions are strictly speculative and for educational purposes only therefore Use effective risk management.
However trading is complex instruments and involve high Risk and may not be suitable for all investors. Past performance does not guarantee future results.
Trade At Your Own Risk.
Happy Trading Pals.

Bullish Falling Wedgeit is clear " Bullish Falling Wedge " setup. if it doesn't break the TL most probably it would test the H4 support line again before going up to complete those continuation pattern. just being alert for coming up news. peace


ETH 1D Morning Star LongETH 1D Morning Star Long.
Good R:R here. 1D Morning star pattern and stop below 1D ATR Low.

XBT Futures LongOne of few futures long I am looking at for 2019. Waiting for September futures to long to 6k.


BTC/USD - Why Weekly Levels Are Important Hey guys... been a few day since doing a video, so I thought I would highlight why I believe being mindful of weekly levels are extremely important to your trading plan. While I think indicators can be useful, personally, i'm trying more and more to minimize their use and stick to price action along and limit the amount of time spent in the charts. As I have mentioned before, the more and more time i spend in the charts the more i start to see what i want to see and that is not a good thing.
I hope you enjoyed the video, give me a like and leave me your thoughts!

NZDUSD 1:1/1:2 RRRI am not a professional trader and this is just a trade which i take. This is also not a trading signal.


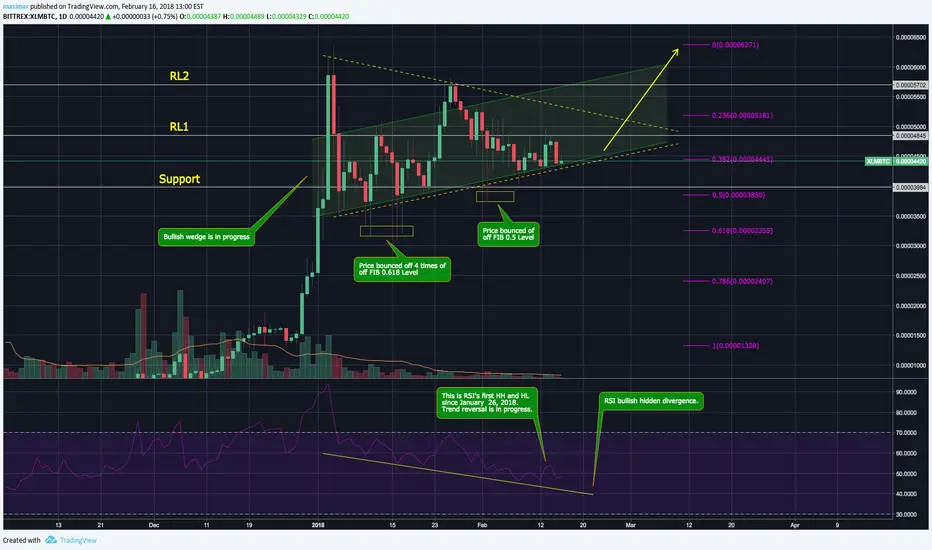
$XLM bullish hidden divergence on 1D chartWell, Lumen has many positive bullish signs, but the strongest sign to go long is a major BULLISH HIDDEN DIVERGENCE on RSI's daily chart. While price was gaining bullish momentum, RSI created more LL's for a whole month. As of now we see our first HH and HL to confirm trend reversal in oscillator. Bullish wedge will pop very soon. See ya at the moon.
$ZEC bearish divergence in progress on 6H RSI chartZcash is in perfect uptrend channel with many bullish signs, but it may experience bit of overheat via regular bearish divergence on 6H RSI chart. RSI is overbought, making lowest high under 70, where the price is trending up. In trading book it may signal for the short. Long term ZEC is super bullish. In near future it may have a bit of decline to existing support.


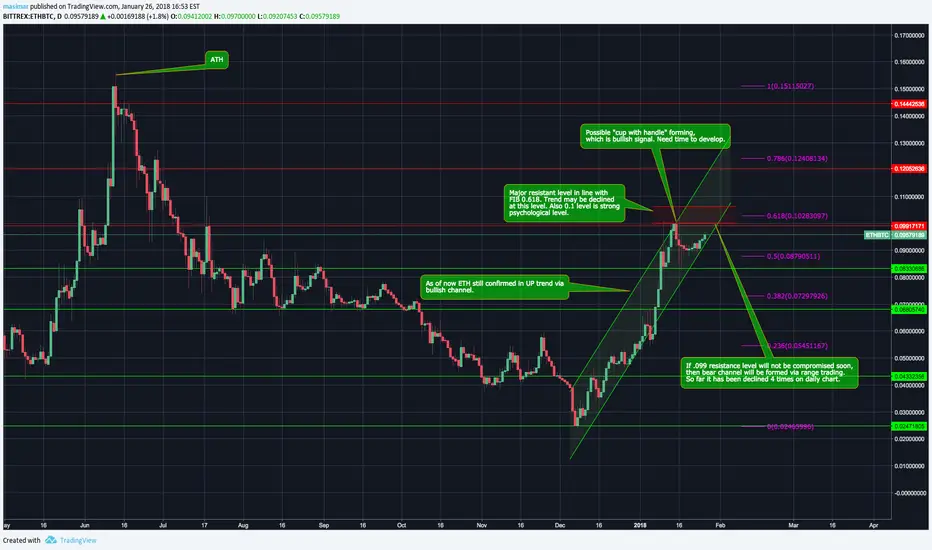
$ETH is at the major decision point, naked charts, no indicatorsEtherium is at the brink of a decision point. If we can break thru 0.99 level, then it will absolutely moon and possibly flip BTC one day soon. But something tell me we may experience a small correction. Let's see how it will develop within next few days. I'm neutral again.