What Is Naked Forex Trading, and How Do Traders Use It?What Is Naked Forex Trading, and How Do Traders Use It?
Traders rely on various tools and techniques to trade the forex market. Naked forex trading is one of the oldest and most popular trading approaches among currency traders. This article delves into the details of naked trading, providing insights into its implementation and distinguishing features that set it apart from other analysis techniques.
Understanding Naked Forex Trading
Naked trading is a trading style that involves analysing markets using a clean price chart, meaning one without technical indicators. Traders who use this method make decisions based on real-time price movements and their trading instincts.
Naked trading has its roots in the early days of trading, long before the advent of sophisticated technical analysis tools and indicators. Early traders relied solely on price action and market behaviour to make trading decisions. By stripping away the complexity of modern trading tools, naked trading aims to return to the fundamental principles of trading, emphasising the importance of understanding market psychology and price dynamics.
Core Principles of Naked Forex Trading
Naked forex trading is based on the following principles:
- Price action analysis is the foundation of naked trading, focusing on the examination of asset price movements without the help of technical indicators. Traders rely on bar, line, or Japanese candlestick charts to identify patterns, trends, and key support and resistance levels. By concentrating on real-time price movements, traders aim to make their trading decisions based on how prices behave at specific levels.
- Naked trading emphasises simplicity and clarity as it removes the clutter of numerous trading tools. This approach helps traders maintain a clear view of the market, making it potentially easier to identify trading opportunities. The simplification also reduces cognitive load, enabling traders to focus on the most critical market movements.
- Trader instinct, often referred to as "gut feeling" or "trader's intuition," plays a significant role in naked trading. This instinct is honed over time through experience and the extensive observation of price movements and market behaviour.
Key Techniques and Tools
Mastering price action analysis is crucial in naked trading. These are the four key tools for those who use naked trading.
Candlestick Patterns
Candlestick patterns play a crucial role in naked trading strategy by providing visual representations of price movements over a specified period. Traders look for different price formations to analyse potential market reversals, continuations, or indecisions. Common candlestick patterns include doji, engulfing patterns, hammer, shooting star, and spinning top. Each offers insights into market sentiment and potential future price movements.
Chart Patterns
Chart patterns on price charts indicate potential trend reversals or continuations. Traders using naked trading techniques rely on chart patterns like flags, rounding top/bottom, diamonds, and rectangles to identify key levels where the price is likely to react. These patterns help traders anticipate market movements and plan entry and exit points accordingly.
Support and Resistance Levels
Support and resistance levels are fundamental concepts in naked trading, representing levels the price struggled to break above (resistance) or hold above (support). Traders identify these levels on price charts to anticipate potential price reversals or breakouts. Support and resistance levels are crucial for setting profit targets, placing stop-loss orders, and managing risk.
Trendlines and Channels
Trendlines and channels are used by naked traders to visualise the direction and strength of a trend. Trendlines connect successive higher lows (uptrend) or lower highs (downtrend) on a price chart, helping traders identify trend reversals or confirm trend continuations. Channels are formed by drawing parallel lines to connect highs and lows, creating a channel in which the price typically moves.
Advantages of Naked Forex Trading
Naked trading has many advantages; therefore, it’s still used by traders around the globe. Here are the key benefits of naked forex trading:
- Enhanced Focus and Simplicity: This approach removes market clutter as it offers enhanced focus by eliminating complex technical indicators. Without the distraction of multiple indicators that provide lagging signals, traders may respond more effectively to changes in price movements.
- Improved Market Understanding: By relying on naked trading tools, traders may better understand market behaviour and psychology. Observing price action directly on charts potentially enhances traders' ability to interpret market sentiment, identify key support and resistance levels, and anticipate potential trend reversals or continuations. This hands-on approach fosters a deeper understanding of the nuances of the market and improves trading skills over time.
- Flexibility and Adaptability: Traders are not constrained by specific indicator signals or rigid trading rules. Instead, they can adjust their approach based on real-time price action and evolving market dynamics. This flexibility allows them to take advantage of emerging opportunities and adapt their strategies to potentially mitigate risks.
Challenges and Limitations
Although naked trading can be effective, it has limitations that a trader considers before relying on this approach.
- Learning Curve: As naked forex trading relies heavily on interpreting price action without the assistance of technical indicators, traders may need to dedicate considerable time and effort to mastering candlestick patterns, chart analysis, and understanding market psychology. Developing the skill to interpret price movements accurately demands persistence and consistent practice.
- Emotional Discipline: A notable challenge of naked trading is the absence of clear buy or sell signals provided by indicators, which can lead to heightened emotional responses to market fluctuations. Traders must maintain discipline by adhering to their trading plans, implementing risk management strategies, and avoiding impulsive decisions.
- Market Noise: Navigating market noise is another hurdle in naked trading. Market noise refers to random price fluctuations that obscure meaningful price patterns. Traders need the patience and experience to distinguish between significant price movements and temporary fluctuations.
Practical Application of Naked Forex Trading
Setting up a trading plan is essential for implementing naked forex trading. Traders might use the following rules:
- Define Your Trading Goals: Determine your financial objectives, risk tolerance, and period of trading.
- Select Currency Pairs: Choose currency pairs that align with your trading strategy and offer sufficient liquidity.
- Identify Key Trading Times: Determine optimal times to trade based on market volatility and your availability.
- Establish Entry and Exit Rules: Define criteria for entering trades based on price action signals, such as candlestick patterns or support/resistance levels. Similarly, rules for exiting trades should be established to potentially lock in returns or cut losses.
- Risk Management: Implement risk management strategies, including setting stop-loss orders and calculating position sizes based on your risk tolerance and account size.
- Review and Adapt: Regularly review your plan to assess its effectiveness and make necessary adjustments based on evolving market conditions and personal trading performance.
Real-Life Examples and Case Studies
Real-life examples and case studies illustrate how naked forex trading principles are applied in practice:
Example 1: Trading Support and Resistance
A trader identifies a currency pair approaching a key support level on the daily chart. They wait for a bullish reversal candlestick pattern, such as dragonfly doji, to form near the support level. They enter a long trade with a stop-loss below the support level and a profit target at the next resistance level.
Example 2: Trend Confirmation
A trader observes a currency pair in a strong downtrend on the hourly chart. They wait for a pullback to a trendline and look for a bearish engulfing pattern to confirm the continuation of the downtrend. They enter a sell trade with a tight stop-loss above the trendline. However, it is difficult to determine the profit target as there are no swing lows nearby.
The Bottom Line
When they understand the naked trading forex strategy, traders may use it in other markets, including stocks and cryptocurrencies*. However, it's important to note that any analysis does not guarantee effective trading, and other factors should be considered alongside chart analysis. Risk management and a proper mindset are essential for long-term consistency.
FAQs
What Is Naked Trading in Forex?
Naked, or price action trading, is a forex trading approach that involves analysing the market using a clean price chart without any technical indicators. Traders relying on this method make decisions based on real-time price movements and their trading instincts rather than past performance. The strategy emphasises identifying key support and resistance levels, trend reversals, and price corrections purely through the observation of bar, line, or candlestick charts.
Can I Trade Without Chart Patterns?
Yes, trading without chart patterns may be possible using alternative methods such as indicator-based strategies, quantitative models, fundamental analysis, or sentiment analysis. These approaches allow traders to analyse the markets based on technical indicators, mathematical algorithms, economic data, or market sentiment.
What Is a Chart Pattern in a Price Action Strategy?
A chart pattern in a price action strategy refers to the specific formations and shapes created by the price movements of an asset, which traders use to analyse future market behaviour. These patterns emerge due to the collective actions of buyers and sellers and can indicate potential trend reversals or continuations. Some common chart patterns include triangles suggesting a consolidation before a breakout, Quasimodo indicating a potential trend reversal, and flags signalling the continuation of an existing trend.
What Is the 5-3-1 Trading Strategy?
The 5-3-1 trading strategy is a disciplined approach designed to help traders focus and improve their trading skills. It involves trading just five currency pairs to reduce complexity and enhance expertise in those markets. Traders then use only three specific strategies to master and consistently apply. Finally, they select one trading timeframe to maintain consistency and avoid confusion.
*Important: At FXOpen UK, Cryptocurrency trading via CFDs is only available to our Professional clients. They are not available for trading by Retail clients. To find out more information about how this may affect you, please get in touch with our team.
This article represents the opinion of the Companies operating under the FXOpen brand only. It is not to be construed as an offer, solicitation, or recommendation with respect to products and services provided by the Companies operating under the FXOpen brand, nor is it to be considered financial advice.
Nakedtrading

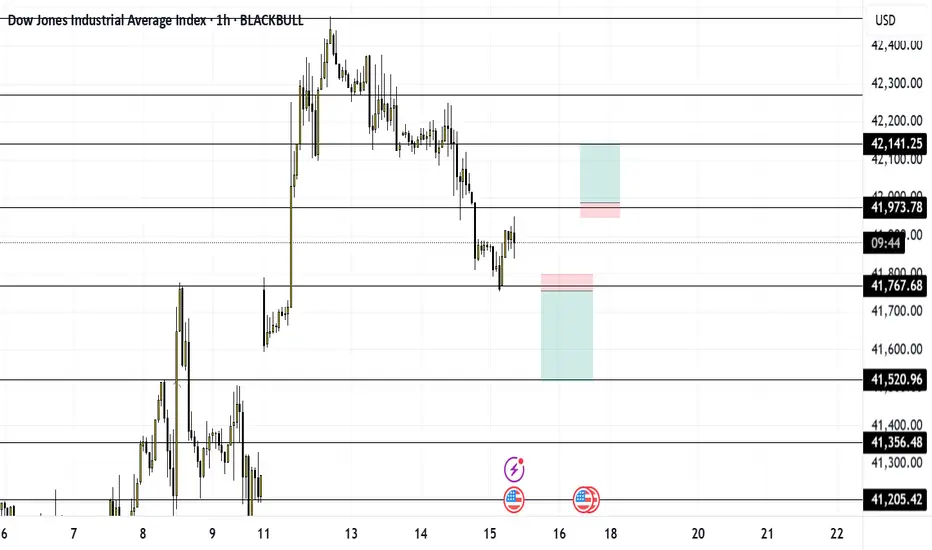
US30 MAY 15What kind of birds stick together? Velcrows! And we shall stick together as we conquer this market. Today price is stuck between 2 key areas (41,973 and 41797).
I am going to wait for price to break and retest one of those areas before I get into a buy or sell respectfully. on the 1m timeframe.
And I'm trading level to level. If it goes for the sell, it is evident that price will try to fill in the price gap that it left behind and few days ago. 41,527 level
And if price decides that it wants to go for the buy, I'll buy up to the next level where price last stopped on the hourly, 42,139 level.
But, like a 21-year-old girl, 5 shots in off of Tequilla, price will do whatever it wants, so trade responsibly. And have fun!!!
Trade idea - EURCHF Long4H
Bullish impulse: indication .
Pattern within pattern: confirmation.
Inverse head & shoulders, Bullish fake out flag.
Clear support & resistance zone is there.
Corrective approach towards entry zone.
-68 Fib completion aligning with entry zone .
= Buy limit set.
1% risk.


Mastering Naked Forex Trading: Strategies, Pros, and TipsEmbarking on the journey of "Naked Forex Trading" marks a departure from conventional trading methods, as traders eschew traditional technical indicators in favor of a purer, more intuitive approach. This article delves into the operational intricacies, diverse strategies, and nuanced pros and cons of naked trading, offering practical insights and tips to navigate this distinctive trading method successfully.
Understanding Naked Forex Trading:
Naked forex trading represents a paradigm shift in trading philosophy, where traders base their decisions solely on price action, devoid of the clutter of technical indicators. It entails analyzing raw price movements on charts, such as identifying support and resistance levels, drawing trendlines, and interpreting candlestick patterns. By embracing the " naked " approach, traders aim to gain a clearer, unfiltered perspective on market dynamics and sentiment.
Operation Of The Naked Trading Strategy:
At its core, naked trading simplifies the trading process by stripping away the complexities of technical indicators and focusing solely on price action. Traders develop a keen eye for key support and resistance levels, draw trendlines to identify market trends, and meticulously analyze candlestick patterns for potential trading opportunities. This approach emphasizes disciplined adherence to entry and exit rules based on observable price movements, fostering a deeper understanding of market dynamics.
Naked Trading Strategies:
Naked trading encompasses a spectrum of strategies, each tailored to exploit specific aspects of price action. These strategies include:
1. Identifying Support and Resistance:
Traders discern significant support and resistance levels on price charts, observing price reactions near these levels and making decisions based on historical significance and current market dynamics.
2. Drawing Trendlines:
Trendlines are sketched to delineate the prevailing market direction, enabling traders to identify potential entry and exit points aligned with the trend's trajectory.
3. Analyzing Candlestick Patterns:
Traders scrutinize candlestick patterns to gauge market sentiment and anticipate potential reversals or continuations. Patterns such as doji, engulfing patterns, and pin bars provide valuable insights into market psychology.
4. Recognizing Price Action Patterns:
Common price action patterns, including double tops, double bottoms, and head and shoulders formations, are identified to anticipate future price movements and inform trading decisions.
5. Executing Breakout Trading:
Traders identify consolidation zones or chart patterns signaling potential breakouts, entering positions when prices breach resistance or support levels, anticipating significant price movements.
6. Observing Engulfing Patterns:
Bullish or bearish engulfing patterns, where one candle fully encompasses the preceding one, serve as signals for potential reversals or continuations, guiding traders in their decision-making process.
7. Naked Trading with Moving Averages:
While purists adhere to pure price action analysis, some traders integrate moving averages to complement their naked trading strategy, providing additional confirmation of trends.
8. Monitoring Round Numbers and Psychological Levels:
Round numbers and psychological levels on price charts act as additional support or resistance levels, influencing trader behavior and serving as strategic decision-making points.
9. Pattern Recognition:
Traders develop proficiency in recognizing various chart patterns, such as triangles, wedges, and rectangles, leveraging breakouts or breakdowns from these patterns as potential trading opportunities.
10. Implementing Multiple Time Frame Analysis:
Combining naked trading strategies with multiple time frame analysis enriches traders' understanding of market conditions, providing insights into both short-term fluctuations and long-term trends.
Achieving success in naked trading demands a comprehensive understanding of market dynamics, disciplined pattern recognition, and the ability to interpret raw price charts effectively. Patience and effective risk management are essential to capitalize on high-probability trading setups and mitigate potential losses.
Pros And Cons Of Naked Trading Strategy:
The naked trading strategy offers several advantages:
1. Simplicity: Naked trading simplifies the trading process by eliminating the clutter of technical indicators, making it accessible for traders of all levels of experience.
2. Focus on Market Dynamics: By focusing solely on price action, naked traders develop a deeper understanding of market dynamics and trends.
3. Adaptability: Naked trading strategies can be applied across various financial markets and timeframes, providing flexibility and adaptability to changing market conditions.
4. Emphasis on Trader Psychology: Naked trading places a significant emphasis on understanding trader psychology and market sentiment, leading to more informed trading decisions.
5. Versatility in Strategies: Naked trading allows traders to customize their strategies based on their preferences and trading styles, incorporating a wide range of price action techniques.
However, naked trading also presents some challenges:
1. Subjectivity: Naked trading often involves subjective analysis, as traders interpret price action based on their individual perspectives, leading to potential variations in trading decisions.
2. Lack of Confirmation: Without the aid of technical indicators, naked traders may lack confirmation of signals, increasing the risk of false signals and trading errors.
3. Limited Predictive Power: Naked trading primarily focuses on historical price movements, which may limit its ability to predict future market conditions accurately.
4. Vulnerability to Whipsaws: In volatile or low-liquidity markets, naked trading strategies may be more susceptible to whipsaws, resulting in unexpected losses or missed opportunities.
5. Learning Curve: Mastering naked trading requires a solid understanding of price action analysis and market psychology, posing a steep learning curve for novice traders.
Tips For Trading Naked Without Indicators:
To optimize naked trading strategies, traders can employ the following tips:
1. Practice on a Demo Account: Open a demo account to practice naked trading and refine your skills without risking real capital.
2. Incorporate Order Flow Analysis: Use order flow analysis to gain insights into market dynamics and identify potential trading opportunities.
3. Develop Trading Psychology: Cultivate a disciplined mindset and emotional resilience to navigate the ups and downs of trading without the aid of indicators.
4. Utilize Forex Correlation and Currency Strength Meter: Leverage forex correlation and currency strength meter tools to identify correlations between currency pairs and gauge market sentiment.
5. Explore Other Price Action Trading Strategies: Expand your repertoire of price action trading strategies, such as supply and demand trading or range trading, to enhance your trading toolkit.
In conclusion Naked forex trading epitomizes the power of simplicity and reliance on price action analysis, offering traders a clear and unfiltered view of market dynamics. While it presents challenges such as subjectivity and a steep learning curve, traders can overcome these obstacles through diligent practice, analysis, and a deeper understanding of market psychology. By integrating diverse strategies, adhering to sound risk management principles, and honing their analytical skills, traders can harness the full potential of naked trading and navigate the forex markets with confidence and precision.

$WBA 11DTE SHORT PUT 10% profit target #WBA #options10% TP for my cap in 10 days? It's good....
Any kind of naked PUTs on big instrument are my favorite at high IVR with divergence.
My choice for today: Walgreens Boots Alliance Inc.
Reasons:
- RSI is already oversold with big divergence
- breakeven point is little close, but allowed loss ($50 max) is manageable
SETUP:
NAKED PUT for NASDAQ:WBA , because IVR is high, for 0.7cr
* Sell 2 NASDAQ:WBA OCT13 '22 PUT
Max profit: $152
Probability of 50%Profit: 72% (TP: $95)
Profit Target relative to my Buying Power: 10%
Req. Buy Power: $1035 (max loss without management before expiry, no way to let this happen!)
Tasty IVR: 84 (very high)
Expiry: 11 days
SOLD OCT13'22PUT @ 0.76cr

usdjpy to create a strong higher highAfter earning small chips from the shorts I decided to go long and participate in the trend. This pair is still in an uptrend. The dollar is creating higher lows and structurally higher highs. I noticed a breakout of consolidation then a retest. The re-test presented a bullish reversal pattern followed by volume. I project price to push to atleast 144.808

usdjpy reversal signal at retest highAfter a 1 hour variation of an evening star during the London session this morning, I was alert during the New York session to see if price would be strong enough to push beyond its latest high; especially after a bullish engulfing. Price merely closed off with some buy exhaustion only to followed by a doji. This set-up looks like a false break of a major resistance level which is why I decided to take advantage of the retest during the best time of the day. Although the dollar yen is still overall bullish, there are sellers coming in to keep price from pushing higher. I've shorted the highs, no lower low yet except for intraday 5min. which is my entry point. Stop loss just above the high.

USDJPY high around 143.800The dollar has been in a weak uptrend for the past few hours so I decided to take advantage of some indecision at a high. Price presented a shooting star on the 30minute chart as well as a strong bearish engulfing on the 5min at the exact area needed for a short. This area is exactly where price closed at then was immediately rejected on last Friday (6/23). This retest could be early considering NY session is hours away. Also the lower timeframes haven't began creating lower low yet.

USDJPY retracement at the highAfter a few indecision candles at the high, followed buy a volume push up to a major resistance, I became alert that a bearish setup might present. Friday closed off with a variation of a bearish engulfing. When price closes beyond a price then closes right back beneath it its a sign that this price is being rejected. Naked analysis tells us that the 1hour chat has already began its downward momentum. A minor double top formed. My short entry was based on the high volume bearish engulfing re-test at the neckline. The 30MIN chart has begun creating its lower highs and lower lows. This is a short scalp. the buy will likely present later in the week.

USDJPY to create another higher highUJ is still in its major uptrend as price continues to create strong higher highs and indecision lower lows. I took a buy based on the 30min structure. My target is the next daily resistance level. I believe that buying at a higher low off of a retest is a valid opportunity. Especially after a volume bullish engulfing candle.

USDJPY uptrend scalp to higher highThe daily closed bullish but with some buy exhaustion which led me to believe that there still some bullish momentum but not much. The 1H made a clear higher high and decided to hold at its lows but created some bullish reversal signals on top of support. The moving avergae plays as support as well. Upon the breach of a 30min correction trendline. I believe price is on its way back to test its high or create a new one. Afterall, this is an overall uptrend.

Time to go long on AUDUSDThis pair has been retracing for a few days now. I believe that after Wednesday's close, price is very close to reversing. The presentation of an indecision candle on top of a major support and between the 23.6% and 38.2% fib, signifies that momentum is slowing down for bears. I would wait for more bearish activity during following hours, and potentially for buyers to come in while there's volatility. Reversal candlesticks on top of this support are valid buy opportunities for at minimum 80pips. Look to buy after a false breakout to the downside or after the final low.

GBP/USD, AUD/JPY, NZD/JPY and USD/JPY on watch for me today.GBP/USD:
• If price pushes up to give us a confirmed second top and the last part of the move is corrective, then I'll be looking to get short with a risk entry after a phase line break on either the one hour or the fifteen minute chart.
• If price pushes up to give us a confirmed second top and the last part of the move is impulsive, then I'll be awaiting a subsequent convincing impulse down followed by a tight flag and then I'll be looking to get short with a reduced risk entry on the break of the flag.
• If neither of these setups present themselves then I will simply wait until another setup which meets my plan materialises.
• If there's any ambiguity then I will not place either of these trades.
AUD/JPY:
• If price pushes down to give us a confirmed second bottom and then it pushes up to give us a confirmed second top and the last part of the move is corrective, then I'll be looking to get short with a risk entry after a phase line break on either the one hour or the fifteen minute chart.
• If price pushes down to give us a confirmed second bottom and then it pushes up to give us a confirmed second top and the last part of the move is impulsive, then I'll be awaiting a subsequent convincing impulse down followed by a tight flag and then I'll be looking to get short with a reduced risk entry on the break of the flag.
• If neither of these setups present themselves then I will simply wait until another setup which meets my plan materialises.
• If there's any ambiguity then I will not place either of these trades.
NZD/JPY:
• If price pushes down to give us a more horizontal pair of bottoms and then it pushes up to and ideally just above our rayline, then so long as the last part of this move up is corrective I'll be looking to get short with a risk entry after a phase line break on the one hour or the fifteen minute chart.
• If price pushes down to give us a more horizontal pair of bottoms and then it pushes up to and ideally just above our rayline then so long as this move up is impulsive I'll be awaiting an impulse back down below it followed by a tight flag and then I'll be looking to get short with a reduced risk entry on the break of the flag.
• If neither of these setups present themselves then I will simply wait until another setup which meets my plan materialises.
• If there's any ambiguity then I will not place either of these trades.
USD/JPY:
• If price pushes up to and ideally just above our higher time frame rayline, then regardless of how it does so I'll be waiting for a convincing push back down below both it and the lower ascending trend line of the corrective channel to the left followed by a tight flag and then I'll be looking to get short with a reduced risk entry on the break of the flag.
• If this setup doesn't present itself then I will simply wait until another setup which meets my plan materialises.
• If there's any ambiguity then I will not place this trade.

EURUSD to make its 4H higher highI believe the daily momentum for this pair is still bullish. The 4H retraced to the 38.2% fib and presented a Volume bullish engulfing on top of a trendline . While I do believe the Euro is getting weaker, one more higher high or bullish push would make perfect sense considering the fact that its beneath a major resistance and had been rejected there prior. Its approaching an untested breakout zone while these daily candles aren't very strong.

EURUSD reversal signalI placed a short entry with an 11 pip stop loss. I believe that this intraday uptrend is over, and this week will be relatively bearish beginning with last Friday's daily indecision candle and false break of a resistance.

NZD/USD and GBP/USD on watch for me today.NZD/USD:
• If price pushes up to and ideally just above our upper trend line and the last part of the move is corrective, then I'll be looking for a risk entry after a phase line break on either the one hour or the fifteen minute chart.
• If price pushes up impulsively to and ideally just above our upper trend line , then I'll be waiting for a convincing push back down below our rayline followed by a tight flag where I'll be looking for a reduced risk entry on the break of the flag.
• If price pushes up to and ideally just above our rayline, then regardless of how price does so I'll be waiting for a convincing push back down followed by a tight flag where I'll be looking for a reduced risk entry on the break of the flag.
• If neither of these setups present themselves then I will simply wait until another setup which meets my plan materialises.
• If there's any ambiguity then I will not place any of these trades.
GBP/USD:
• If price pushes up to and ideally just above our upper trend line and the last part of the move is corrective, then I'll be looking for a risk entry after a phase line break on either the one hour or the fifteen minute chart.
• If price pushes up impulsively to and ideally just above our upper trend line , then I'll be waiting for a convincing push back down below our rayline followed by a tight flag where I'll be looking for a reduced risk entry on the break of the flag.
• If price pushes up to and ideally just above our rayline, then regardless of how price does so I'll be waiting for a convincing push back down followed by a tight flag where I'll be looking for a reduced risk entry on the break of the flag.
• If none of these setups present themselves then I will simply wait until another setup which meets my plan materialises.
• If there's any ambiguity then I will not place any of these trades.

EUR/JPY, USD/JPY and USD/CAD on watch for me today.EUR/JPY:
• If price pushes up to and ideally just above our rayline, then regardless of how it does so I'll be waiting for a convincing impulse back down followed by a tight flag and then I'll be looking to get short with a reduced risk entry on the break of the flag.
• If this setup doesn't present itself then I will simply wait until another setup which meets my plan materialises.
• If there's any ambiguity then I will not place this trade.
USD/JPY:
• If price continues to correct between now and I'm awake to place the order then I'll be looking to get short with a reduced risk entry on the break of this tight one hour flag.
• If this setup doesn't present itself then I will simply wait until another setup which meets my plan materialises.
• If there's any ambiguity then I will not place this trade.
USD/CAD:
• If price breaks the upper descending trend line of our most recent piece of structure, it does so impulsively and in a convincing manner and a subsequent tight flag forms, then I'll be looking to get long with a reduced risk entry on the break of the flag.
• If this setup doesn't present itself then I will simply wait until another setup which meets my plan materialises.
• If there's any ambiguity then I will not place this trade.

The final shooting star for the AUDAUDUSD presented a shooting star at a key area of confluence on Wednesday. Price failed to break this confirmed evening star. Thus creating a volatile indecision bearish engulfing at the high. I will short upon a retest of the high or the presentation of a reversal candlestick on the back of the trendline if broken. Price is still pushing for its highest point. ADX is still very bullish for now.

usdjpy to make a big decision todayIn the following video I've provided 3 scenarios in which I would look to take part in any trades. The first of which is quite simply a higher high will produce another higher high.
Both scenarios afterwards are reversals. If price throws indecision in the correct direction, it signals a reversal. The daily close today will suggest a lot at yesterday was relatively volatile.

AUDusd continues to make higher highsThis pair is very beautifully creating its higher highs. I was initially hesitant to go long as price was up trending however there were some bearish signals such as lack of strong bullish candles. This bullish push was made with weaker candles beneath this resistance. After a retracement, and a re-test of support, the trendline, or daily/weekly support.

USDJPYA Indecision pullback to resistanceUSDJPY is in an intraday uptrend again. The overall trend is bullish however I believe that this is a re-test of the former high and based on how price is approaching the resistance it doesn't signal much bullish strength anymore. Price is currently at a high of an untested zone, the all time high and a Daily evening star pattern.

EURUSD double bottomEURUSD is bullish in all aspects of the form. It took a small double bottom to confirm the major Double bottom on the daily. ADX is bullish during the latest high. Price may proceed to retrace to retest the daily support as it was previously rejected. I will buy upon a bullish reversal on top of support.
