NANO

Nano Price Analysis NANO / USD: Healing Its WoundsNano / USD Short-term price analysis
Nano has a bullish short-term trading bias, with the cryptocurrency now trading back above key technical resistance on the four-hour time frame.
The four-hour time frame shows that a bullish inverted head and shoulders pattern has formed, following a bullish breakout from a neutral triangle pattern.
Technical indicators on the four-hour time frame remain bullish, although they are starting to appear overstretched.
Pattern Watch
Traders should note that the NANO / USD pair could soar in value if the inverted head and shoulders pattern across the four-hour time frame is triggered.
Relative Strength Index
The Relative Strength indicator is bullish on the four-hour time frame, although it is now starting to correct from overbought conditions.
MACD Indicator
The MACD indicator on the four-hour time frame remains bullish and continues to generate a buy signal.
Nano / USD Medium-term price analysis
Nano has a bullish medium-term trading bias, with the NANO / USD pair recovering back above its trend defining 200-day moving average.
The daily time frame shows that the cryptocurrency is attempting to stage a major recovery, with price now trading back above the neckline of a large head and shoulders pattern.
Technical indicators on the daily time frame are also bullish and continue to issue a buy signal.
NANO / USD Daily Chart by TradingView
Pattern Watch
Traders should note that the head and shoulders pattern on the daily time frame remain valid and has yet to reach its overall bearish target.
Relative Strength Index
The RSI indicator on the daily time frame is bullish and is now issuing a strong buy signal.
MACD Indicator
The MACD indicator on the daily time frame is bullish and continues to generate a buy signal.
Conclusion
Nano has staged a strong upside recovery, with the recently created bullish pattern on the four-hour time frame changing the technical dynamics in the short-term.
If bulls can continue to hold the NANO / USD pair above key support on the daily time frame, the cryptocurrency may soon make a move to invalidate the bearish head and shoulders pattern.

Nano knocking on heaven's door.
Guppy turned green on the 4H and is about to turn green on the 8H
Massive bull div on the RSI
Multiple tests of previous resistance --> resistance becomes weaker with each touch.
High volume coming in
If this resistance breaks, Nano could seriously rip.
The only other resistance in sight is 70% above us!

Nano trend reversalBullish TK cross, cloud turned green. Bouncing from cloud's bottom/50EMA. 50EMA switched from resistance to support. Volume's back. Breaking out of cloud at the moment. Looks like trend reversal is here.

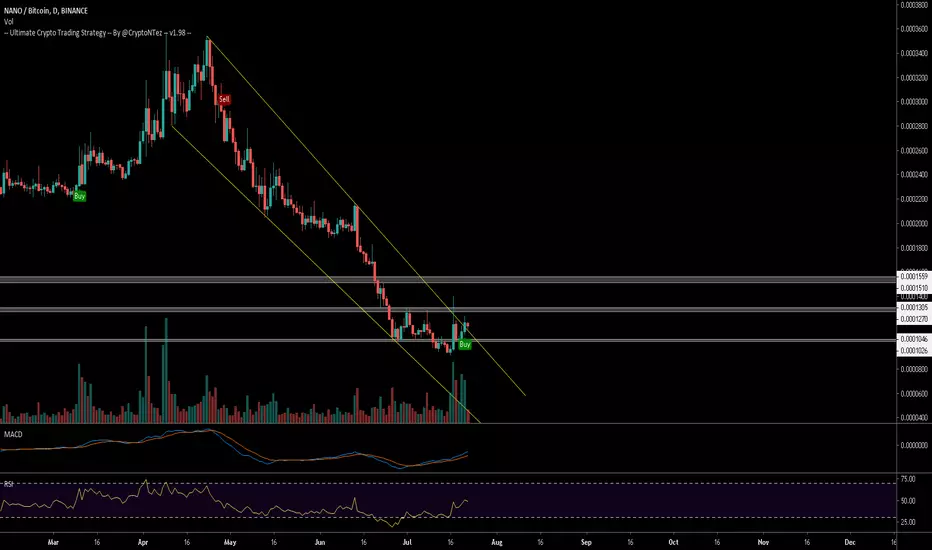
$NANO, Trying to break from a long descending channel $NANO / $BTC
Trying to break from a long descending channel w a Buy Signal of the UCTS on the daily chart.
Inmediate target should be around ~1300sats, and if cleared ~1500.
Volume has been showing nice activity over the last days (let see if we have continuation)
#NANO
NANO 4H Bullish MovementNano has made a large spike with a strong volume on July 17 and now is moving in a bullish trend. MACD is making a transition to bullish and the CCI is already in positive territory, although it did not show the price too overextended. Stochastics are not overbought.

NANO/BTC - Ready to go long?Looking at the chart, it looks like the last 3 months of hell (holding alts in BTC) is coming to the end.
We feel that soon the tide will turn and alt-coins will increase in value again soon. Need to wait for a few more confirmations but early signs are looking up.

$NANO Long entry$NANO
If NANO can hold the support and we will see increasing volume. I will try to dip my toes into NANO.
We saw a nice 50% pump and are now finished retracing. I wan't to see a bounce of the cloud.
Entry: 0.000115
Tight stop (manual): 0.0001100
50% profit target: 0.0001680


NANO BULLISH$NANO
I'm bullish on NANO. CCI crossed green on the daily, nice volume coming in.
I think we'll see a move up to the mid 1400's, perhaps mid 1600's if the move up is strong enough.

Nano on a spring?It looks like Nano just hit a spring and is heading for the first resistance level 1.44. Volume on the 0.89 level was relatively high.

Bullish div on weekly with strong support n rising volumeChart speaks for itself
Fundamentals speak for the project
40X back to ATH's
Seems reasonable for the fastest coin with ZERO fees
Murders BTC on fundamentals as a currency

Nano Price Analysis NANO / USD: Evolving From Bear To BullFundamental Analysis
Nano has been getting some respite from the downtrend after the project released the latest version of its node software Solidus, last week. The update brings a broad range of improvements to the network. It provides added security, efficiency and makes it easier for services to integrate Nano. All these factors should have a positive effect on the adoption of the Nano’s network.
Nano / USD Short-term price analysis
Nano has a bearish short-term trading bias, with the cryptocurrency struggling to move back above key resistance on the four-hour time frame.
The four-hour time frame shows that the NANO / USD pair has suffered a strong technical rejection after bulls tested back towards the neckline of a large head and shoulders pattern.
Technical indicators on the four-hour time frame have turned bullish and are continuing to generate a buy signal.
Pattern Watch
Traders should note that the head and shoulders pattern across the four-hour time frame has yet to reach its overall bearish downside target.
Relative Strength Index
The Relative Strength Index is bullish on four-hour time frame and still shows scope for further upside.
MACD Indicator
The MACD indicator on the four-hour time frame remains bullish and is generating a buy signal.
Nano / USD Medium-term price analysis
Nano has a neutral medium-term outlook, with the NANO / USD pair still consolidating around its trend defining 200-day moving.
The daily time frame is showing that the cryptocurrency is trapped within a large falling wedge pattern, with NANO / USD bulls repeatedly failing to break above the top of the bullish pattern.
Technical indicators on the daily time frame are bearish and continue to issue sell signals.
NANO / USD Daily Chart by TradingView
Pattern Watch
Traders should note that the line of least resistance is currently to the downside, following multiple technical rejections from the top of the falling wedge pattern.
Relative Strength Index
The RSI indicator on the daily time frame is also bearish, although it is now attempting to correct from oversold conditions.
MACD Indicator
The MACD indicator on the daily time frame remains bearish and is still generating a sell signal.
Conclusion
Nano bulls will need to move price above the neckline of the head and shoulders pattern in the near-term or the cryptocurrency is at risk of further substantial losses.
Sustained weakness below the NANO / USD pair’s key 200-day moving average may result in a technical test of the falling wedge patterns lower trendline.


NANO/BTC Reversal Dodji in weekly? Keep an eye onOn top of tech and inherent strengths (faster transactions, feeless, ...) NANO seems bullish in the coming weeks after recent strategic partnerships announcement :
- Lower reach on this pair
- Dodji
- Oversold RSI


Nano - Decision TimeHi folks -
Nano is currently resting on the 100 EMA, after trading in a range from about $1.38 to $2. A break below the 100 EMA could see Nano proceed to support at $1.38 and a very bearish move even lower.
However, a move upwards of $1.65 could see Nano escaping the triangle and moving to a new target above $2.
Leave a like if you appreciate this analysis - and happy trading! :)

NANO/BTC - Looking for new supportNANO is oversold, to the same extent as in august 2018. And hit a new all time low on Binance.
On the chart are fib resistances and possible bounce areas, since are already at a very low RSI, I think NANO can bounce here.
Don't forget about this tech and what is coming up.
-Kappture Pos devices
-Appia Pay
-V19 and the switch from UDP to TCP which allow more easy integration for exchanges


[NANOBTC](80%) Hits Double Bottom, Trade Signal InsideNANO (NANOBTC) Just hit strong support marking a double bottom on Binance.
The RSI is oversold and the MACD is moving higher while prices move lower, bullish divergence.
Let's trade NANO for profits...
-------
Pair: NANO (NANOBTC)
BUY: 0.0001320 - 0.0001420
TARGET:
(1) 0.0001620
(2) 0.0001830
(3) 0.0001970
(4) 0.0002150
(5) 0.0002360
(6) 0.0002500
PROFITS POTENTIAL: 80%
(Buy calculated at 0.0001390)
STOP: Close weekly below 0.0001200.
------
Thanks a lot for reading.
Feel free to hit like to show your support.
This is Alan Masters.
Namaste.

Nano/kappture partnership - Is Nano close to 3,5$?!Can we expect a run to 3,5$ for Nano after partnership formalization with Kappture? Let’s see!
