NAS and Oil Down - Minimal DrawdownQuick thoughts and reasons for trades taken with almost zero drawdown
Nas Short/Oil Short Trades
NAS

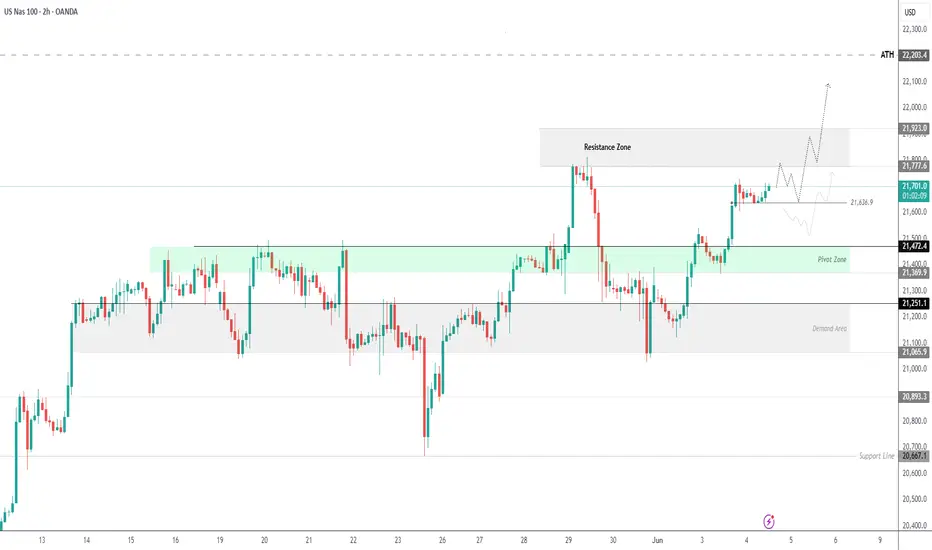
USNAS100 – Bullish Scenario Valid Above 21640, Targeting 21920USNAS100 | Technical Analysis
The price initiated a bullish trend after breaking above 21470, as previously mentioned. It is now continuing toward the target at 21770.
Currently, price is approaching the resistance at 21775.
If it fails to break above and stabilizes below 21775, we may see a consolidation within the range of 21775–21640.
🔺 A 1H close above 21775 may trigger a continued bullish move toward 21920 and 22100.
🔻 A 1H close below 21640 could lead to a correction down to 21475.
Resistance: 21775, 21920, 22100
Support: 21640, 21510, 21370
Nasdaq giving hints of bearishness failing to close above rangePlease review what I think I'm seeing. If you have any comments in regard to these potential levels they are always welcome.
I believe we may be actually bearish from here but without a daily close below the highest block, my decided choice must be neutral. Purely mechanical analysis will save your portfolio 💎
Don't forget to subscribe & share this with someone who is learning 🙏🏾

NASDAQ MEGA BOUNCE ZONEI want to see a super bounce from this demand zone tomorrow due to the recent reactions around this price level. Lots of interest being shown here. I am sized in pretty heftily on MNQ futures. In a $0 or HERO position. WIll be closing my laptop now...

NAS still charging for bullish targets but currently retracingWe are looking at a retest of break points on the session. Going into this session we will monitor what happens at the previously broken levels.
We do have bearish imbalances in LTFs that have yielded neat entry on shorts. Stay sharp in this range.
Share with someone in need on true levels 🔑

[How to] Trade Recap: NAS Short in Asia--quick 70 pips!⚡️ Easy quick short in Asia. Thank you Honk Kong 🙏🏾
Share this with anyone willing to learn the truths of candlestick analysis ✨

Post CPI Update: NAS still very well behaved in this range🎯 As previously mentioned, we were expecting the bearish imbalance to be the magnetic area. Price in this chart is behaving just as it should. As well with bearish imbalance or FVG, we expect price to find it as a trend continuation point.
If we do not get a bullish close over the previous day, we will expect a swift attack of the lows in the coming PA.
Share this with a friend who's learning 🧠

Intraday Update: Indices may be ready for the SMT reversal👀 Clearly we have a bullish reversal from the clearing of a previous daily imbalance range. Of course we expect NAS to get a head start on achieving it's buyside targets and that's just what we get on today.
🧼 Clean buyside ideas happening although we are technically still bearish on the daily until we get a higher close over a previous daily block. This is fine, it just means we will still see heavy bearish flow above lower time frame highs until then no sweat!
Share this with someone trying to learn 🫡

NAS (Indices) still bleeding for sellside correction🙏🏾 As promised in our simple bias methodology, our bearish daily closes are still allowing for the big boys to be adamant about reaching sellside goals for better buy prices
Share with a friend who needs the true levels 🎯

GOLD, NAS, & BTC Daily Overview: Whole Market BleedingDXY is fundamentally bullish but this recent bearish retrace has allowed us to put risk on for a few weeks but the last few sessions have been hungry for correction.
We all know that before we can continue to rally, it will be wise to allow the market to collect more supporters at better pricing. This alongside inefficient price delivery zones will make easy targets for sellside revisit market wide.

LONG ON NAS100Nas is oversold and has rejected a major demand area.
I will be buy nas to the next resistance level

SHORT ON NASToday Im selling nas.
I made good money on the drop from yesterday.
Price has since pulled back into discount and tapped into supply.
News for PMI is coming out which is (expected) to be positive.
I will be selling nas this morning looking to catch at least 1000 points.

SHORT ON NAS100Nas has been failing to break highs.
Highs continue to get Lower coming from a major resistance area.
Telsa, Amazon and others facing back lash for many political reasons. (negative)
I will be selling nas before unemployment news today that expect more people to be unemployed. (negative)
News could set this trade on Fire to the downside.

NASDAQ is potentially OVER pricedSeeing that Nas has been getting weaker against the market makes me think its been propped up a bit and we are open to seeing a decent sized correction to the downside. This will likely shock the media and news but I belive it'll just help the asset reach new highs with a re evaluation of its components at a lower price. Trade Safe, Trade Smart, Trade Drippy!

NQ LongEntry Point: Price is reaching the 0.618 Fibonacci retracement level, with the potential to buy near 20,865.75.
Stop Loss: Set just below the 0.79 Fibonacci level, around 20,690.00.
Take Profit: Targeting a move towards the 0.0 Fibonacci extension around 21,371.25 (blue rectangle area).
Analysis:
The market has experienced a retracement, reaching the 0.618 Fibonacci level. This could act as a support zone for a possible upward move.
The price action suggests a strong potential for a rebound as it aligns with a previous high.
This trade setup offers a favorable risk-to-reward ratio, with the potential for significant upside towards the 0.0 Fibonacci extension.

NAS100/USTEC - 4hr| Descending TriangleSimple Trading: Descending Triangle
Nas100 has been trailing down for the past week. if the price breaks below 20,700, then the bullish momentum may be loss. Expect Nas100 to continue to bounce from one end of the triangle to the other end. Once the Triangle is broken, we can reveal the exact target area. Keep in mind that the last 4hr candle has closed below the previous candle low. Price could be preparing for a pullback before continuing to make a lower low. This will either be a break and retest with continued bearish pressure or a complete fakeout.

SELL NASDAQ UNTIL 11K AND WAIT FOR MORE BLOOD !!!Nasdaq going on a Down trend !!
Sell now and be Patient
PATIENCE IS THE KEY
TP on 11K and wait !!!

nasdaq falltoday as seen in the chart.
we tested the bottom of the range and wherent able to move with enough energy to the upside.
in the american sesion today we dditn ake a new high.
i see weeknes in the market.
entry in blue.
target in green.
to be able to take the win you also have to be able to the loss.\
have fun
Elektra

NAS100 Buy limit orders.Looking forward to place a limit order on NAS100.
Potential trade would be 3R plus, risking 0.5% of the equity.
Limit order will be placed according to the market condition at around ·3:30 -4:00 Pm (UTC +2, timezone)

Market Forecast for Gold into $3,000Gold's consolidation phase within a rising wedge pattern illustrated market uncertainty ahead of the U.S. presidential election and broader economic factors. The price action indicated a retracement towards key support levels at 2,470 and 2,367 USD, aligning with typical market cycles that precede significant rebounds.
This phase suggested a corrective pullback within the broader uptrend, a natural part of the market cycle where consolidation and profit-taking occurred before the next rally. The pullback towards the 2,367 USD level acted as a springboard for a renewed uptrend. Seasonal trends and unforeseen geopolitical events increased gold’s safe-haven appeal, contributing to price acceleration towards the long-term target to 3,000 USD.
With the U.S. presidential election on the horizon, unclear economic policies from potential candidates contributed to market hesitation. This uncertainty often drove investors toward safe-haven assets like gold. Central banks' responses, particularly from the Federal Reserve, Bank of Japan and the European Central Bank, were critical. Interest rate adjustments, inflation controls, and currency interventions all played a role in shaping gold's trajectory. When central banks signaled that inflation was persisting, it accelerated gold’s ascent. Conversely, when inflation moderated and interest rates rose significantly, it created temporary pressure on gold prices. The retracement towards 2,470 and 2,367 USD levels offered a strategic entry point for investors looking to position themselves.
Those who took that trade made money, and I thank you for believing in this chart.

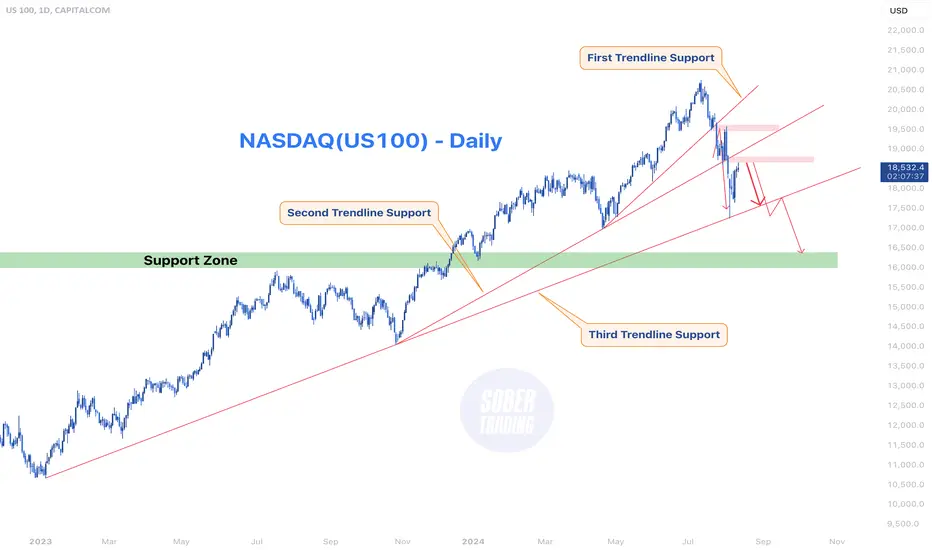
NASDAQ - US100 Facing Bearish PressureThe CAPITALCOM:US100 index is currently facing significant downward pressure, largely due to mounting concerns about the U.S. economy. The potential for a recession is growing as recent data points to an increase in unemployment claims, and the Federal Reserve has decided to delay interest rate cuts. This has created uncertainty in the markets, as higher unemployment could lead to reduced consumer spending, further exacerbating the economic slowdown. The anticipation of prolonged higher interest rates is also weighing on investor sentiment, making the stock market, particularly tech-heavy indexes like NASDAQ, more vulnerable to declines.
Technically, the BLACKBULL:NAS100 index has been following a clear pattern of reactions to its trendlines. The index recently fell and touched the third trendline support, which has historically been a critical level for determining market direction. After this touch, the index attempted a recovery, moving back towards the second trendline, which now acts as a breakeven point. However, the failure to break through this level and the subsequent rejection suggests that the bears are firmly in control. The pattern indicates that the index may face further declines, particularly if it breaches the third trendline support.
In conclusion, both fundamental and technical factors are pointing towards a bearish outlook for the NASDAQ index. The rising possibility of a recession, driven by increasing unemployment claims and the Fed’s cautious approach to rate cuts, has dampened investor sentiment. On the technical side, the index’s inability to reclaim key trendline supports indicates that more downside is likely. As a result, investors should be cautious and prepared for potential further declines in the NASDAQ index in the coming weeks.
NQ1! Critical levelsDetailed explanations are given in the chart.
Comment if you have any questions.
Thanks for reading and good trading!

US30 - 15m Scalp on DowJonesUS30 presents a sell opportunity. The price has just broken below the support zone at 39,300, indicating a potential for further downside. Keep an eye on this level for potential entries.
