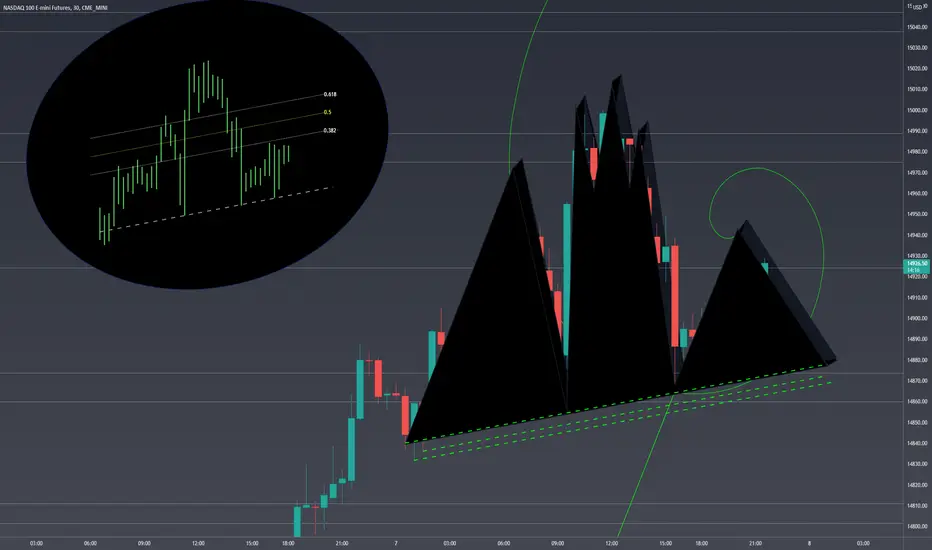
NAS - Price Compression - Rising Wedge or Pennant - in 3DThe ranges have been reduced to to string of doji's on the 2 hour.
NAS

NAS - FOMC Eve - Dimensions and a Pennant Melt-up underway. Watching for a break of the pennant. Apple is in a 4 hour Diamond. Blue Skies for the Nasdaq as we begin November.

NAS - A Scenario A practice that provides opportunity for preparedness, and holds the risk of imprinting bias, scenario planning belies a unique place in the traders tool box. Here is to dream, and in dream form only, that sees a continued massive crash to the upside for the Santa Claus Rally. Followed-up by Rate Volatility, a neckline bounce to a right shoulder and onto the third test of the point of control. The odds are against it, but now, if it comes to pass, it will not be the first-time it has been considered.

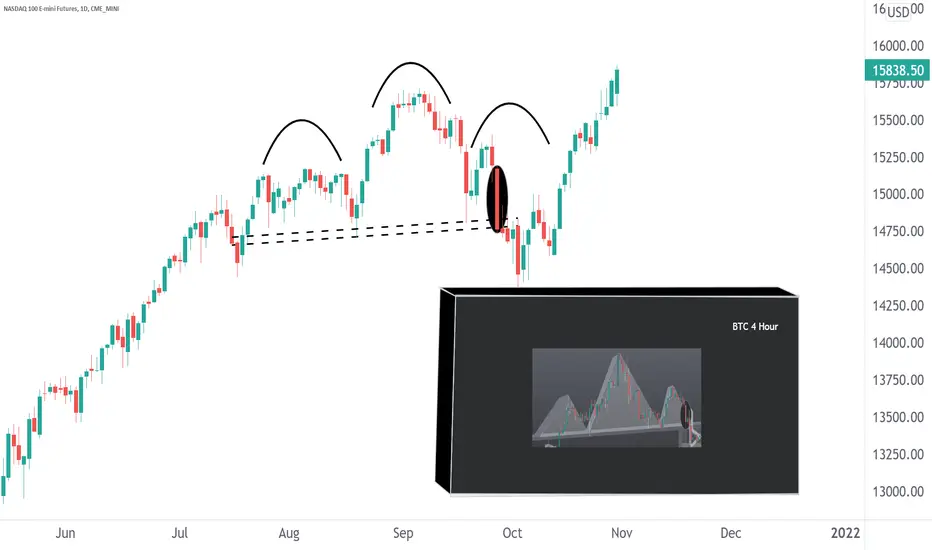
The Right Shoulder - NAS and BTCFrom the Higher Low of the Right Shoulder to the necklines is producing repeating bear plays that have a consistent profile. In this example, NAS from September on the daily, and BTC last week on the 4-hour, show very similar profiles, with opportunity bearish falling to their neckline.
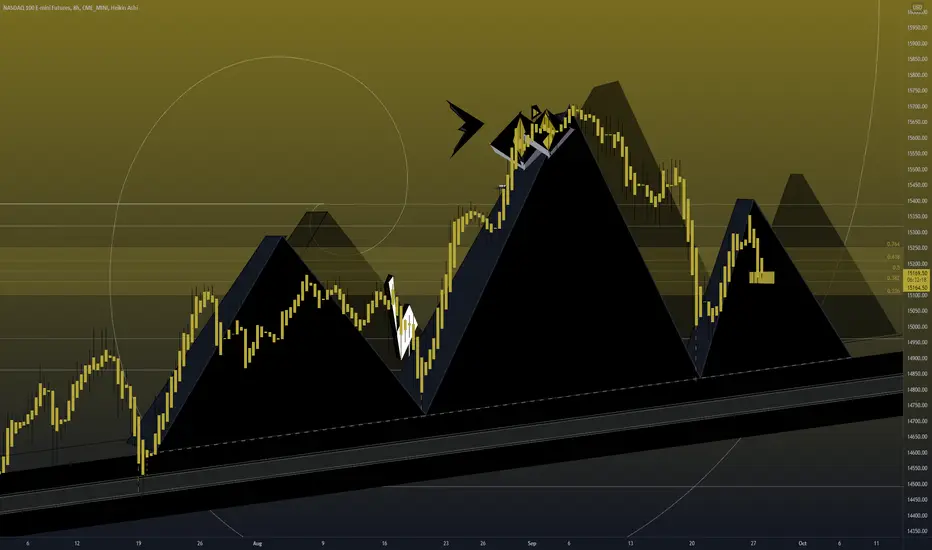
NAS - Diamond Top - Bollinger in 3DSupported by the 2 hour MBB and testing, price formed a Diamond at the top of a range. Diamonds serve as both continuation and reversal patterns.

Short ADI on an upwards wedgePuts on ADI
~SL above ATH (180.77)
~PT1 172.50 (could see strong support here)
~PT2 170
~PT3 168
RSI divergence on last 2 ATH, a rejection at the resistance line in an uptrend, gap to fill on down 168-170
We saw a double bottom from this last impulsive move. a pullback to the neckline at PT1 very likely.

NAS - Short Frame Double TopAfter a great move to the upside, supported by the 2 hour 8 EMA - Watching for Opex fireworks (or just a Friday Fizzle). The Bar Bat is still in play for next week, with further weekly room to the upside.
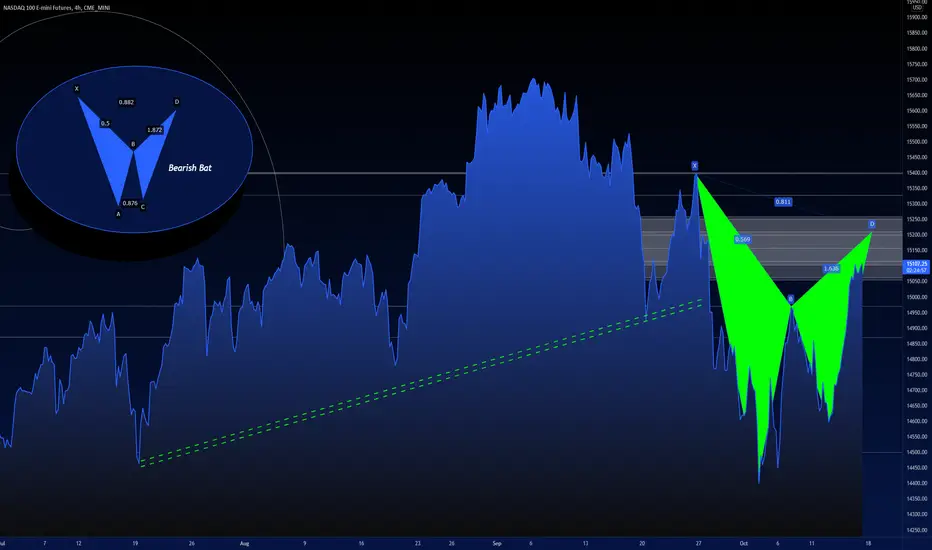
NAS - Bullish Day - Bearish BatKeeping this pattern on the back burner in case options expiry day is met with 'unexpected' sell pressure. My bias is looking up with the recent run and the 10 year retracing to the downside.

LCID bull flagLCID: Strong downwards wedge after impulsive move signals a bull flag
~ What is interesting about this graph is the VI. It showed bearish momentum but yet had increasing price action! Imagine when the VI sends bullish momentum!
~ RSI also has a lot of room to grow.
~ The only errs in this graph are the death cross on the 11th signifying a bear trend. But this cross is weak as it has low volume.
~ Another err is the false breakout on the lower side before coming back in. This can be attested to the QQQ action of dumping today. The fact LCID was able to stay bullish despite QQQ and the VI being bearish/choppy for some of the day

AMD short opportunityAMD: Using fib retracement, after an impulsive move a pullback to the 0.5, 0.618, or 0.786 is very likely and healthy in an uptrend.
~ Golden cross happened on the 11th signaling the start of another uptrend.
~ on the 11th AMD did a similar but smaller sized impulse with a pullback to the 0.786. This helps visualize the theory of fib
~ RSI on the hourly has a lot of room to "dump"

NAS100Pattern: trend
Entry: at nas100 current price we have no entry. we must wait for the support of the level in play to get a good risk to reward ratio on entering a long to the upside trend target and potentially to the supply zones. If this fails to happen we should watch for a DOUBLE BOTTOM ON 1HR TF to potentially buy with the trend. if no double bottom forms we sell off and break trend into targets.

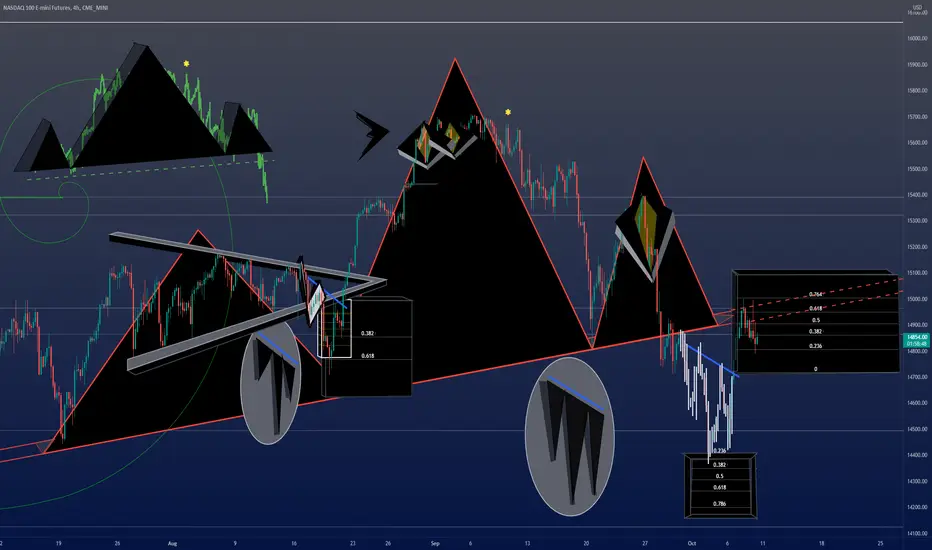
NAS - Bearish Butterfly ConfirmedThe Broadening Falling Wedge found resistance at the .5 Pattern Break Target and has returned to the linear break level after a confirmed harmonic pattern. Will the low job number add to growth concerns as Big Tech earnings are up this month?

NAS - Neckline Back-TestA short frame falling wedge broke bull via a confirmed inverse head and shoulders. Finding resistance at the junction of the pattern break .764 and the Daily H&S neckline (red dashed lines).
NAS - 30 Minute H&S - in 3DSupported by the 2 hour 8 EMA - watching for an overnight Lower High for a right shoulder. Jobs - Taper - Rates - Bond Yields - Rotation.... Tomorrow.
Major Markets WorksheetSPX, through a confirmed iH&S via The Russell 2000, reversed on Friday. Mini-Pennants are forming on the two hour frame. NAS is the outlier, while price advanced with SPX the path included a lower low, invalidating an iH&S pattern. NAS is working on printing a two hour broaden wedge pattern. The Vix hit the 50% Break Target of the Bull Pennant, finding resistance there.

NASDAQ - Falling WedgeNew Pattern in play as NAS finds LH to LL, with resistance and support boundaries emerging.

Market Dashboard - RecapWith NAS and SPX making Lower Lows it time to be on the look-out for RSI Divergences, Volume and a reversal pattern. The prospective i-H&S pattern on NAS was swamped by Russell confirmation of a H&S: as the Vix breaks out a pennant. The game changes Vix +20, in this case resistance is being met with instant selling pressure.

Major Market Dashboard - in 3D The distribution is currently underway with SPX breaking it's bear flag to the downside. NAS and the Russell are showing mirrored patterns; NAS is working on saving a right inverse shoulder and Russ challenging the neckline of a H&S

NASDAQ 100 WED REVERSALPossible breakout to the upside or trap to the downside and then reversal upwards.
First wait for breakout!


NAS - 8 Hour H&S in 3DThe 10 year note broke-out of it's base to 1.49. The market rotated to the Russell 2000, where a 2 hour bullflag has set-up below UBB resistance. Microsoft, Apple and Google are the laggards to recover as Amazon bounced and Tesla broke-out.
Perfect Risk to Reward trade for SPXDespite the fact that the S&P is still largely bullish and a lot of data point to the upside, the truth is that currently the SPX has broken a very key trend that was tested many many times. It hasn't had a 10% correction since September 2020, while it has gone up 42% since its September 2020 low and 109% since its March 2020 lows. The truth is that it could keep going and I think it will go higher medium to long term, but I just feel that it will go to test 3900-4000 before going even more parabolic.
Up until now most were going long on this very obvious trend. Too many perfect bounces on the Monthly Pivots + Diagonal + 50 DMA. Now all these are lost and they could turn into resistance after being support for so long. Of course the really long term trend is bullish and this might just be a trap. A trap to make everyone think the big trend is broken, only to send it higher.
Essentially even if we don't win this trade, the R/R is very attractive. It is 5:1 and I think this trade has at least a 30-35% chance of winning. So if we consider the odds of this trade being a winner and the R/R we can clearly see that his trade is worth it.

lower time frame micro nas. one wick is telling alot.one of the wicks I'm seeing is tilting it to the side of seller resumption. This indicates that price attempted to push higher and was quickly pushed lower. It falied to make a new high in the creation of that wick, which is double bear points. I'm simulator trading today, but I'm short every index and I'm up on every index.
