NAS100 ANALYSIS -UPDATEfrom previous trade set up analysis: If you calculated your risk correctly and played with your entries a little, you would have closed or TP would’ve been hit -depending on your broker spread- with an overall with a good amount of profit while still managed to maintain a good R:R
Current Analysis Update: I’m still anticipating further downside movement on NAS100 but currently on the lower time frames (M15 & H1), as you can see we had an impulse to the upside hence price is likely to push further up to grab liquidity and then after I will be waiting for price to give me a sell entry at least on the H1 or M15 before entering short positions as we are overall still in the correctional phase of an impulse to the downside on the H4.
I will wait for 6-8 H1 candles before entering, if the opportunity does not present itself yet, I will not enter until there is M15 confirmation. Remember, this is not a signal, this is only my analysis/representation of when and how I will be entering this trade. If you guys decide to take this trade, please use proper trade & risk management.
NAS

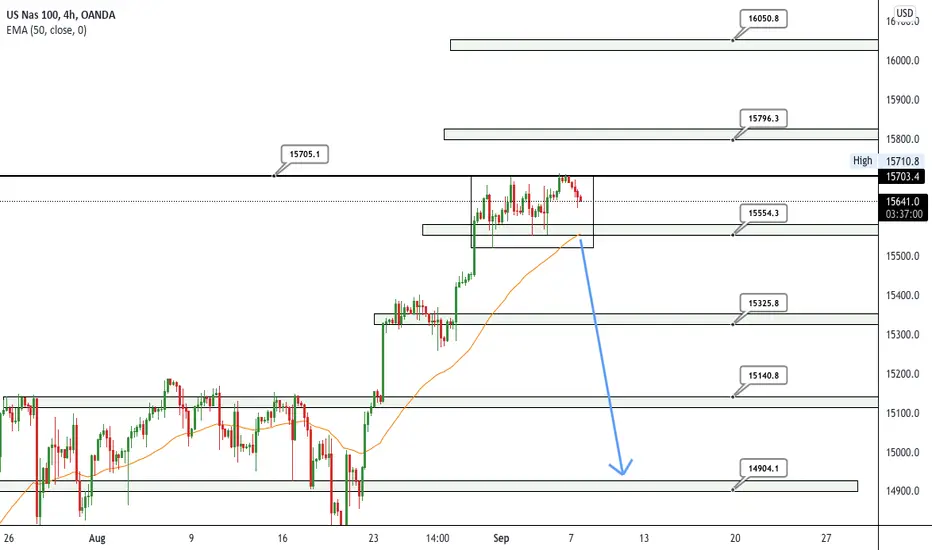
NASDAQ 100 Analysis The market has not changed much since the last analysis. We have been consolidating and would eventually break. I feel We are close in breaking down especially after look at the weekly. If price does break down 15554 then we may see a deep pullback to 14900 zone. However if price break 15700 then we can see new highs of area 16000.
Nas/btcNot financial advise
In my apinion a pump going to cum ⚡🔥💦💦💦💎💎🎓
All happenes will happen fast
Lets see
Fallow and see am I right ?


NAS - Back Testing the Diamond FiftySPX found support at the 2 hour LBB while NAS has lost the MBB. The Lower High off Nas' UBB resistance after the ATH prompted a short frame consolidation. Price has found the middle of the Diamond Range as we approach NFP eve.

NQ1! - Diamond Continuation - 30 Minute PennantFound resistance at the 2 Hour UBB; achieved 35% of the Break Target To Date.

NAS - Diamond Pattern ResistanceThe pattern has taken shape, now on to the turning point. Diamond serve as both continuation and reversal patterns. NAS found support at the combo 2 hour MBB and 8 EMA as the bands compress.

NAS - Diamond Up TopSupported by the 2 hour MBB, NAS is back testing the 2 Hour 8 EMA. Setting a Daily Doji at the Daily UBB.

NASDAQ 100 FRIDAY BREAKOUTIf nasdaq break and close above trendline we can look to go long.
maybe a trendline retest.

NASDAQ 100 THURSDAY REVERSALI Predict a reverse to the upside
If bulls push past yesterday's low, we can get ready to go long.


NASDAQ 100 MAJOR DROP SEPTEMBER 2021I predict a push to the upside from the big players, breakout up inducing retail traders to buy.
And once the buyers are trapped, we can expect a hard sell.

US INDICES..What can you expect from the bearish price action ?
Hello everyone:
Let's take a closer look into the US indices overall, specifically on NASDAQ, SPX, DOW JONES. With the latest development from the lower time frames, we can potentially get the larger bearish correction that we have been patiently waiting for.
Take a look at the price action from a multi-time frame, top down approach. We can reasonably see some higher time frame developments are similar in the past from the Coronavirus period, and bearish price action on the lower time frames as well.
NASDAQ
Higher Time Frame:
Lower Time Frame:
SPX -
Higher Time Frame:
Lower Time Frame:
DOW JONES -
Higher Time Frame:
Lower Time Frame:
Any questions, comments or feedback, welcome to let me know :) thank you

NASDAQ 100 FRIDAY BREAKOUTNasdaq jumped off yesterday previous low made a pullback
and about to breakthrough to the upside.

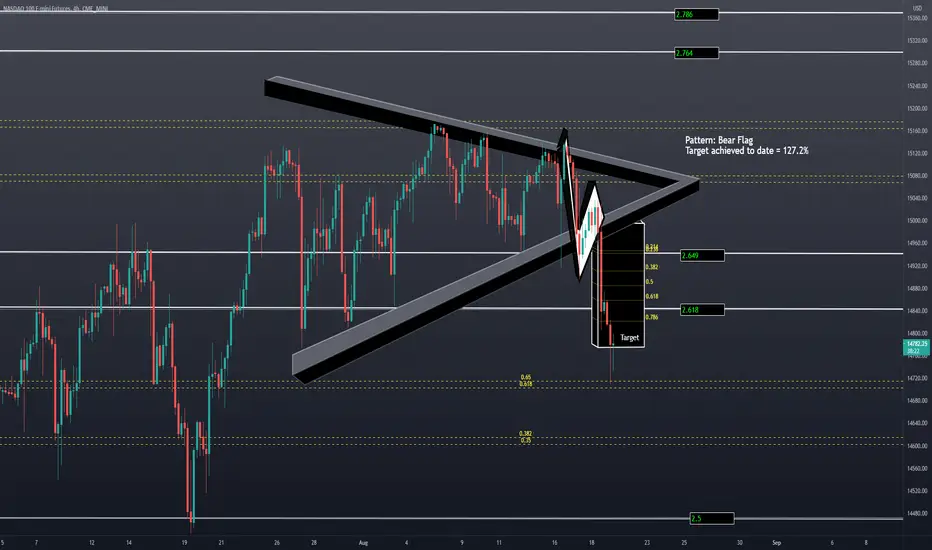
NAS - Achieved 127.2% of the Bear Flag Break Target1.272 is the square of the Golden Mean; 1.618 and often is a place to look for a reaction. Support was found overnight at the Daily 50 SMA, overtaking the Daily LBB on a mini-inverse break in the premarket.
NQ1! - Bear Flag Confirmed - 70% To DateThe release of the Fed notes brought volatility on the 5 min frame, with a double fake-out to the upside before the drop. NAS is now testing Daily support at the LBB with the 50 SMA around 14720.

NASDAQ 100 WED REVERSALDown trend reverse
Nasdaq is dropping down
so I predict a reversal at the low of yesterday.
Predicting a reverse to the upside

TTD.NAS_Range Breakout and Retracement Trade_LongENTRY: 88.97
SL: 78
TP: 97
- ADX>20
- RSI<50,RSI<70
- Daily RS +ve
- Daily FFI +ve
- Daily MACD -ve
- Weekly RS +ve
- Weekly FFI +ve
- Weekly MACD +ve
- Breakout of down trendline with volume on 24 Jun 2021.
- Breakout of down trendline and HVN with volume and gap up on 23 Jul 2021.
- Possible hidden buying on 9 Aug 2021.
- Today closed above previous day candle with higher volume and breakout of range.


NQ1! (Nasdaq) - Weekly Prep - The Big PictureNQ1! continues to push higher, through a period of choppy consolidation. With August Monthly opex on tap, and the Jackson Hole Symposium for the Fed, the last weeks of August before vacations are over should be full of range. The primary pattern is a wedge at the top of the range.

Nas SellPerfect Sell on Nas as it was at an All Time High. Normally don’t trade NFP but the set up was too good not to take.

NAS - GP ResistanceFound the .618 between the 2.65 and 2.764 channel. The jobs number was a beat, with the early reaction a rotation into small caps.

Nasdaq Analysis A quick analysis where i see the market going today. The price has broken out the triangle which was formed on the 4 hour chart, it then came back to retest the structure and go back up. Today if the price breaks out of 15140, we will see price go up to 15240 where it will hit the daily bullish channel centre line. To see where i think price will be going in the next few weeks see the previous post.
