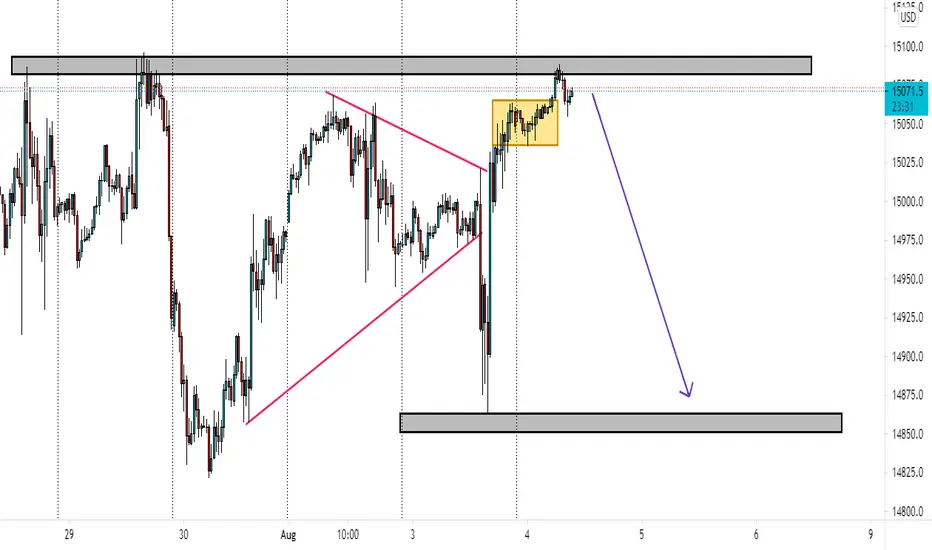
NASDAQ 100 WED REVERSAL PREDICTION!Looking for a drop to the downside. maybe a trap/stop-hunt to the upside and then reverse down!
Wait for entry confirmation!
NAS
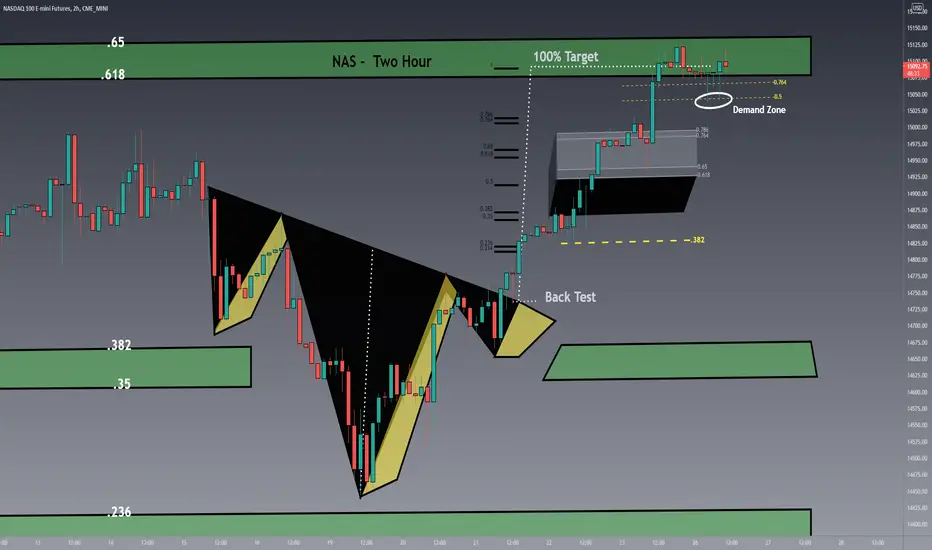
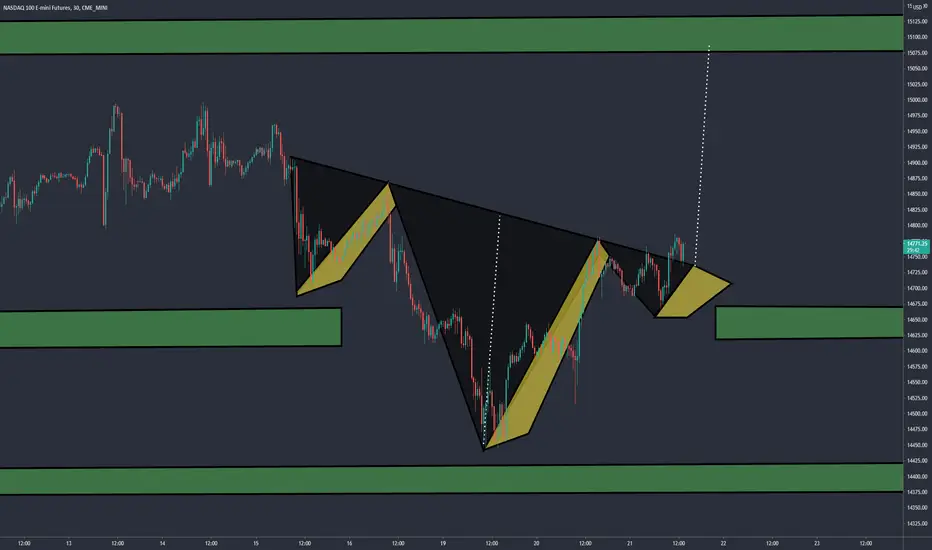
NAS - 2.618 Back Test and HoldThe 2.618 relative to the March 2020 crash will be top watch for the first week of August. NAS setting up and early bull flag on the 5 min frame to open the futures festivities.


Nasdaq Short Term Dip - Then RocketNasdaq correlations to the movement in the 10YR yield are tight.
Scenario 1: 10 yr is looking to break out of a triangle to 1.35%, Nas should dip as a result Aug 2-4 ish if 10yr prediction materializes.
After, 2 possible scenarios:
1.) Monster bounce to double top short term
2.) Continuation to new ATH's for wave 5 completion at the top of the channel.
Stay hedged 100%, could go either way.

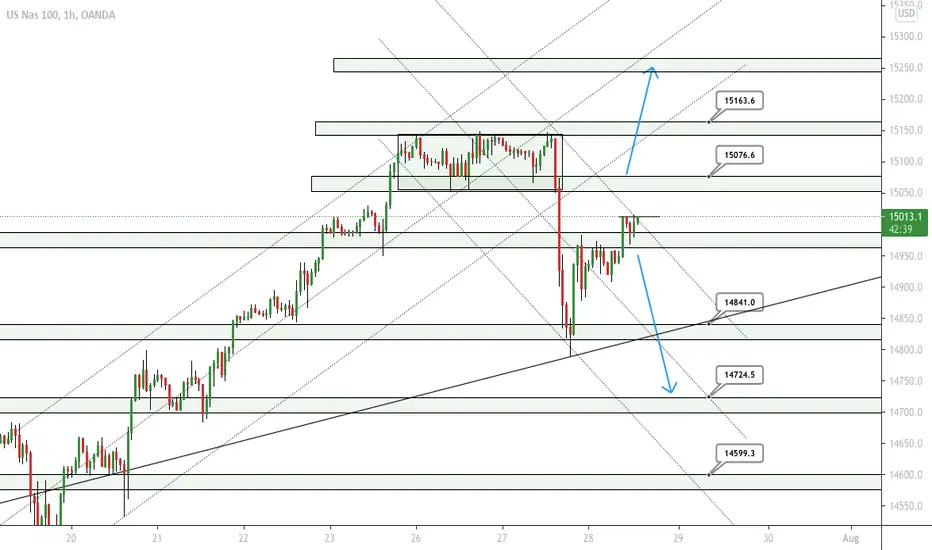
Nasdaq Analysis Hi guys.
We have recovery on nasdaq since the drop yesterday. However It may not be over, we may see more bears pushing price down the down channel to 14841- 14724. However if we do break up 15076 then id except buyers to come back in taking price to new highs. Have your stops in place as New York sessions will be opening and anything is possible with nasdaq.

GBPUSD 7.27Potential setup for GU, we are look for 61.8% retracement then extension into target
Buy 1.381
TP 1.402
SL 1.386

NAS approaching .786 SupportDouble Top bear break after the backtest of the sub .764 . Approaching 2 hour 50 SMA.

Nasdaq Analysis Hi Guys,
Yesterday was a strange day of consolidation on nasdaq. Today I am hoping for a break of 15150. The market is still very bullish. A break of 15150 will take us to 15230 to the middle line on the channel. If the middle line of the channel breaks then price can go 15370. This will be the top of the channel on the daily too, from where price may fall to the 14000s.

NAS Demand ZoneTwo wicks off the channel .5 as Tech earning are upon us. Support at the 2 hour 8 EMA . Showed a wick off the 2 hour MBB . Google remains in break-out mode, with TSLA in a triangle compression, and AAPL at resistance. Short frame support at the 5 min 50 SMA

NAS - Inverse Break At 75% TargetNAS has support at the 2 hour 8 EMA with resistance at the 5 min UBB overnight. A short term H&S is confirming after a strong futures market. Google, Microsoft, Facebook and Amazon lead the way with Apple consolidation out of the cup and handle break. Tech melt-up underway with weekly options expiry today.

NAS - Bull Breaktesting the 2 hour UBB as the inverse pattern confims.. Back tested the 2 hour 8 EMA and that is where support is. Buyers off the 5 min 8 EMA as the break marches up.


NAS inverse back testSupport at the 2 hour 8 EMA as the flush of the 5 min 50 SMA was bought-up on the back test of the inverse. Looking for more volume if it breaks High of the Day - may take a bit longer. 5 min bull flag
NAS - The counter view - Inverse lookwatching for a test of the neckline. A back test would provide a case for a tech earnings melt-up. more info needed with two patterns in play.

Nasdaq analysis New York market will be opening very soon and it will be very interesting to see where this market goes. We are in a very crutial point on nasdaq where this retest on the bullish structure can be the sign for a big fall as analysed last analysis. However if we do see the price creep back inside the structure then we can see more bulls coming back in pushing prices high again and most likely even creating new highs.
For now I will still strongly side with the bears as the bullish structure has been broken. Things can easily change so always have good risk management in place.

NASDAQ 100 DOWNTREND REVRSALExpecting a double bottom after the breakout from consolidation, reversing to the upside.


nasdaq 100 analysis Hi Guys, We have had big drop on nasdaq and I would expect the price to carry on dropping. This bearish move may carry on all the way to 13800 area before climbing back up. It is a retracement that was excepted for a while. In the meantime we will get pullback with opportunities for entry. However if the daily does close back in the channel things may change a lot. we may see more bulls before we see this retracement.

Bulls STOP... Hammer Time! Money hit my account so hard, make me say Oh my Lord. Thank you for blessing me with a mind better than these Dweebs. Now I'm known to call top and bot. Zip up ya drip drop.. you can't touch this! i'm still living and you knowww.... you can't touch this.

March and Sept quad witch are bear territoryMarch and Sept Quad witch are usually when big bear moves go down, well usually the month before. Contracts for the next month start the previous week. Usually end around the 19th and start the 21st.
Institutions and traders like to get in front of it and sell the month before. You can see clear patterns here the last 5 quad witches. So be prepared for some crazy price action early.

PGNY.NAS_Swim Trading VZ Breakout Trade_LongENTRY: 61.99
SL: 55.04
TP1: 66.61
TP2: 70.60
- ADX>20
- RSI<70 but >50. Uptrend still intact.
- MAs aligned.
- Possible hidden buying on 27 Jun 2021.
- Rebounded from pivot point on 28 Jun 2021.
- Strength meter shows weakness. Trade with caution or tighten stop loss in coming days.
