NASDAQ AnalysisMarketing is consolidating ready to break anytime now. We can expect more sell off bring price down to 13298-13168. Just be careful of the fake breaks before it continues the desired direction. Dont get caught up. If the price does decide to go up id wait for 13664 break before taking any buys. This will give me a better clear signal for the buy.
NAS

NAS100i see a big move or long run on nas. market need some rest and ritrace some and creat higher low for this time and i mark a area for this. so next move we wait for this

NDX:NAS100 Looking for Shorts if Monday's highs aren't breachedA longer / bigger time frame indicates a huge shorting opportunity, I've missed a couple of shorts but bought all the way up and knew there was upside still ahead, gamma squeeze anyone?
What do you think?

NAS100 analysisHi guys Sorry I been off few days hence no charts.
Lets get back to it. We have had a really nice fall yesterday, hope you all caught some pips if not I'm sure we will get more opportunities today. As we can see from the chart double top has been formed which resulted in this drop. We have broken through the neckline and we can expect further drops. Just be cautious of your entry as we will defiantly get pullbacks before continuation.
We had reached our target 13664 and now we may get a pullback soon before continuing to come down to next target 13539, 13409, 13298. However if we do go back to 13923 then I will be looking for buys again as sellers failed.
If you want to learn how get a perfect entry, how to draw your perfect support and resistance lines, how to be a winner on nasdaq then get in touch to purchase my course. This week I will be offering half price again to help those who are serious.

nasdaq100 analysis The bears had failed yesterday and bulls have taken back control. Amazing how your support/resistance is so important. as you can see each time it touches it to the pip. We had a quite a bit of bullish movement last night which I assume will continue today. A break of 14064 will will be going towards 14200. However if 14064 does hold it resistance then price can come back down again to 13955 and below.

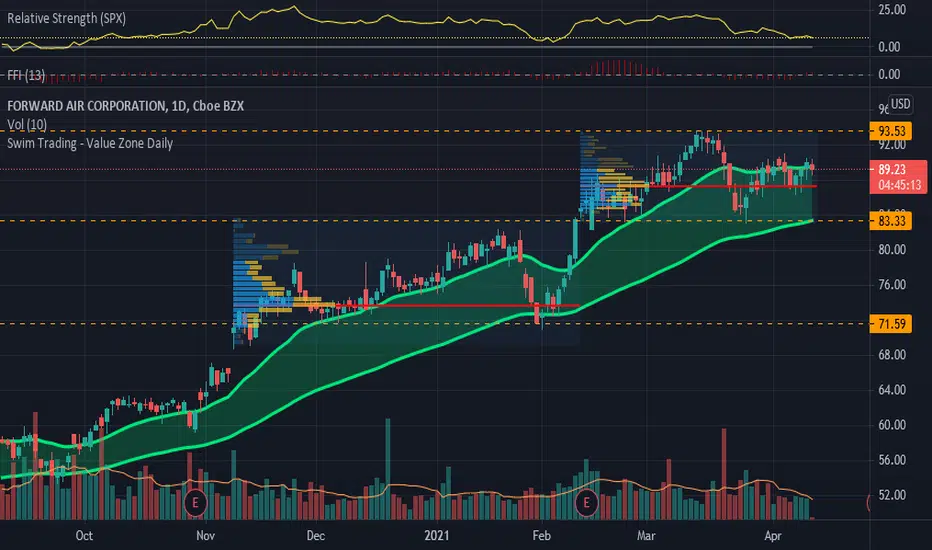
FWRD.NAS_Swim Trading VZ Breakout Trade_LongENTRY: 89.44
SL: 83.13
TP: 98
- ADX<25. Would like to be higher.
- RSI<65 but >50. Uptrend still intact.
- RS and FFI +ve
- MAs aligned
Moonphases backtested QQQ NQ NASMoon phases begin 3 days after, marked by vertical lines. If the trend started the same day I gave it credit. If you could've lost considerably holding till the next moon, I put it in yellow, but still gave credit for initial trend.
Full moon (bot) was correct 9/9 1 ylw
New Moon (top) was correct 7/9 2 ylw
So it seems you can trust moon phases more than most indicators! Overall 88% accurate, with Fulls near 100%, and News @ 77% accurate.

NAS100 AnalysisOn the daily I can see a double top has been formed, so we may see more bearish movements today. A break of13897 we can see price coming down to anywhere between 13800-13665 or further. If the market does respect the current trend line then the price will go back up to 14064, a break here will take us to 14200

AMKR.NAS_Swim Trading VZ Breakout Trade_LongENTRY: 24.30
SL: 22
TP1: 26.07
TP2: 27.50
- ADX<25. Would like to be higher.
- RSI<65 but >50. Uptrend still intact.
- RS +ve
- FFI +ve
- MAs aligned

NAS100 Analysis Hi guys hope you all are well.
Nasdaq has been very indecisive lately been ranging for a while now. The trend is still very bullish and I hope we can see a break through today pushing price back up to 14064 and then further to make new highs. 14200-14400. If the price however does decide it need to come back down we can see it come to 13800 before coming back up. If the price does continue to go down from here then we may see 13665.
For now I will be looking for buys unless I see clear signals this is a sellers market.


nasdaq analysis We had a very nice drop on nasdaq which we were waiting for and this bearish momentum may continue tomorrow. We are currently on the centre trend line on the 4 hour chart. if we break through and come down our target will be anything between 13680-13394. However is the bulls do decide to come back in we will most likely see new highs again target of 14200-14400.
I been getting a lot of messages people keep blowing their accounts. Please protect your account as if that's the only money you have. To become wealthy you need money to trade with. If you blow your account you will eventually just give up. To stay in the game you need to have a account with money. Stop taking silly risks. Stop gambling. And start trading like a pro!!!. I had a student last week who left his job to do this full time, he only started with $200 but he protected his account and focused on growth rather than money. If you focus on money you will never grow. But if you focus on growth money will follow you.

NAS Triangle Break Updatearrived at the 100% target. Currently supported by the 2 hour MBB. The daily 8 EMA is 13864 while the LBB is above at 14344

nasdaq analysis Today we had a pretty bearish day on Nasdaq, Currently the market is consolidating on lower timeframes. If we look at the daily we can see 13915 was previous high which did get broken yesterday, nas making a new high. Today if we get a close back in 13915 then we can expect some more sell off bring price back down to 13607-13540. However the bulls do continue next target will be 14200

NAS100 AnalysisNasdaq has been ranging for the last couple days. on the daily the trend is very bullish. We are very close to our previous high. On the 4hour chart we can see price has hit the top of the trend line. A break of this trend price can move to 12400 and higher. If the price does respect this trend line and pulls back then price will come down to 13600- 13472.
Be careful of the fake break outs. We have had many of them already.

NAS - Diamond MirrorNAS has Res at the 2 hour UBB 2nd Dev. First post will be the double-top at 13858.

Nas 100 - Safe TP If the price fall as expected, it should first landed on fibo level 61.8 at 13120 for TP 1 and if break lower next TP2 is at 12725. Let us secure our profit first.

NAS - H&S UpdateNAS found Support at the 2 Hour 50 SMA . SPX with a bullish backtest of it's 2H MBB 20.

NAS - 30 Min H&STracking this pattern today. A break and backtest of the second neckline is on watch.

NASDAQ Analysis Currently Nasdaq is consolidating. A break to the upside our next target will be 13916. If the price does come down then we will see price come down to 13600- 13472. Nasdaq has been very bullish for days and there is high chance it will continue.

NAS - .786 SupportFriday! NAS held the 2 hour MBB as support with the 2 hour 8 EMA resistance. Forming a triangle between the two for a move today. The bear thesis would be for some profit taking early, while the bull thesis is one of continuation to the top of the larger channel and a completion of the larger triangle break.


