NAS100 AnalysisHI Guys, Ready for another very profitable week. NAS100 had an amazing run last week. This week we looking at 12400 a major key level. A break there we can see new highs or we may even get a bounce from there bringing price down to 12100 a previous consolidation zone. As for today the targets for:
Bulls: 12290- we will have another attempt to reach 12400
Bears: rejection at 12290, will bring price down to zone 12214, and a break of this zone will also be the break of the trend which can bring price between 12214-12100
All the best guys and if anyone needs help: Always here to assist. Remember guys to become a profitable trader we must have a good strategy and plan to execute. We must stop gambling our hard earned money away. If you feel you are gambling then stop and learn to be a profitable trader so you can invest and grow. A investor doesn't blindly put his money in, he is aware of where he is investing, and what return he is expecting. Be like an investor not a gambler!!!
NAS

NAS100 AnalysisNAS100 Analysis
Yesterday We had a close above the 12110 break a strong key level. If we manage to stay out and break out the current trend then we can see nasdaq reaching 12400-12550. If we fail then Nas may come back to 12040- 11900.

NAS100 AnalysisNAS100 Analysis
After a beautiful upward rally yesterday, we are now consolidating in a very important key area where on the daily we can see nas has come up to 12110 many time about 6/7 times and each time got rejected. A break above that level we can see bulls come back in full power but we will know when the day closes tonight. As for today, A break of 12055 will bring us back into our consolidation zone that we broke out yesterday. As for the bulls we need a break out the current trend line to reach 12400 -12500

NAS100 AnalysisNAS100 Analysis
In line with my previous post, We are waiting for a break of the triangle, If the triangle break up then our target will be 12099, A break out this key line we can see bulls come right in taking nas anywhere between 12099-12398. However a break of the downside of 11821 then we can see it come down to 11610 or 11507. Be be advised it will use minor key levels aswell which i havnt drawn. These are only major key levels

NAS100- Daily TimeFrame AnalysisHI Guys, Hope you all had a good trading day yesterday. I will be releasing my daily analysis very soon. Firstly id like you to see what is happening in the daily. It is important to see what is happening in the higher timeframe to be able to execute on the lower timeframes.
We have a triangle that has formed and its been respecting this triangle very nicely. We have had couple of fake break outs from this triangle and they were quite a big 300 pip moves but each time they failed and came back in.
Now that you have seen this triangle im sure you all see the lower timeframe a lot differently and you have a zone to trade in. Weather you are waiting to trade when it breaks or trade inside the triangle , you have a clearer picture to plan.

TRADE UPDATE HELLO TEAM, HERE IS A TRADE UPDATE ON NASDAQ. WE ARE CURRENTLY RUNNING RISK FREE ON THIS TRADE

NAS100 AnalysisNAS100 Analysis
Will we break 12110 today to bring the bulls right back in?. or break through 11901for a bearish momentum. If we do break 12110 then next target will be 12259, as for the bears 11900-11653. It may come down to find support before going back up. You must understand how to use support and resistance to be able to profit from these analysis. These are key major S/R but there are other minor support and resistance that are not drawn on the chart that you must be able to identify and draw yourself. I dont draw all the minors so people dont get confused with alot of lines.


NAS100 AnalysisNASDAQ Analysis
HI Guys. We are still consolidating on nasdaq. We really need a break soon to know exactly where this is going. I am very inclined towards the sell but anything can happen when market is consolidating. We are still at a crucial point on the daily where is may even break out the triangle and go for new highs. Or it may fail and we may see some bearish movements. We can only plan and prepare and be ready.
For the Buyer: 12059- 12218
For the Sellers: 11926- 11786

NAS100 Analysis Sorry for the late analysis. We have a triangle formed on nasdaq. A break down will take us next to 11980- then we will need a break of 11980 support and the trend line for the bears to continue. As for the bulls- We are at a important point on the daily- We really need a break of 12100 for the bulls to continue. if you have a look at the daily you will see a triangle has formed. It failed to break yesterday and if we go back there again we will see if it manages to break.
NAS100 AnalysisNAS100 Analysis
Seeing that triangle I really feel we will come down at least to 11600. Let see what happens
Bears- 11787-11606
Bulls- 12217- 12400

NASDAQ- Quick AnalysisI just thought id post to show what is happening in NASDAQ At the moment on the daily

NAS100 Weekly reviewIm done for this week. Another excellent week.
Weekly NASDAQ Pip Review
Monday: +530
Tuesday: +284, -50,
Wednesday: +151
Thursday: +107, +148, -40
Friday: +106
Blues: +1376
Reds: -90
Total: +1286 Profit
Total NAS Trades: 8 Trades: 6 Win, 2 Loss
Have a wonderful weekend guys!!!


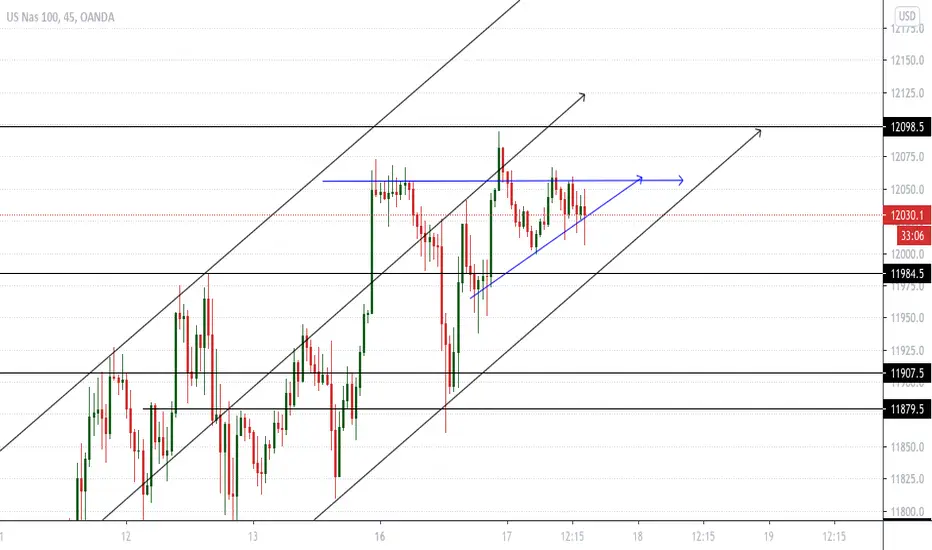
NAS100 AnalysisHI Guys, The market is still in the uptrend and is currently in a consolidation. Today we will hopefully either get a break of 11987 to reach 12127 or we will get a break down out of the trend at 11800 to reach 11705-11585

NAS100- AnalysisNAS100 Analysis
Nas100 currently in a uptrend on the 45min chart. However for the bulls to continue, we need a break of 12000. A rejection at that point will mean we will see bears coming in and breaking out the trend and creating a new downward trend taking it anywhere between 11800- 11586.

NAS100- Target Hit Hope you all got in that breakout. It was a very easy smooth trade. I made it very simple in the analysis today for everyone to understand

NASDAQ Detailed AnalysisNASDAQ Analysis
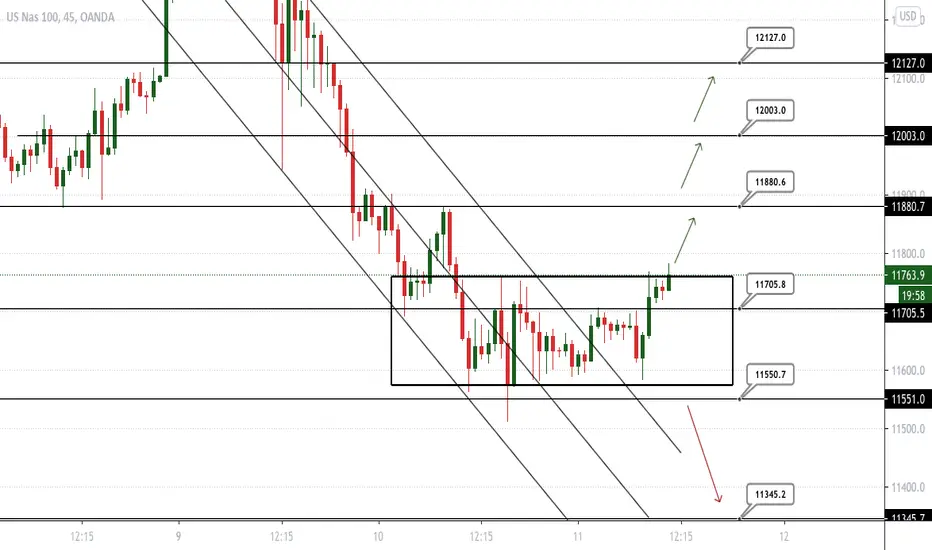
Hello Everyone. Market has been very choppy yesterday and it was same for all pairs. There wasn't much smooth trades. On NASDAQ, We have broke out of our falling channel and it has gone into consolidation. When it does break it our targets are as follow
Buyers: First target 11880, If it break here then next key level is 12000 and if it break this then 12127.
Sellers: Target is 11345 thats if it breaks out the box down and also breaks out our key level 11550.
I use pure price action so my key levels are where i enter or exit. I also draw minor support/ resistance for pullbacks/retest etc. Please make sure when you take trades, you have your confirmations that this trade is going the direction you entered and not fall into traps of false breakout.
NAS100 AnalysisNAS100 Analysis
Target for Sell: 11345 if it break 11550
Target for Buy: 11880 if broken through 11705

Nasdaq ScenarioNasdaq Scenario For Today
╳—╳—╳—╳—╳—╳—╳—╳—╳—╳—╳—╳—╳—╳—╳—╳—╳—╳—╳—╳—╳—╳—╳—╳—╳—╳—╳—╳
NAS pushed up almost to 12452 Mark, but it rejected since it is a major S/R zone.
Right now i think that we can either expext a correction to the downside or a push upwards depending on
if the reject this currenct zone or not.
╳—╳—╳—╳—╳—╳—╳—╳—╳—╳—╳—╳—╳—╳—╳—╳—╳—╳—╳—╳—╳—╳—╳—╳—╳—╳—╳—╳
Trade safe, we in this for the long term.
╳—╳—╳—╳—╳—╳—╳—╳—╳—╳—╳—╳—╳—╳—╳—╳—╳—╳—╳—╳—╳—╳—╳—╳—╳—╳—╳—╳
Let me know your thoughts and questions, don't be greedy dawg and give me a like and follow for
bigmoney profits.
╳—╳—╳—╳—╳—╳—╳—╳—╳—╳—╳—╳—╳—╳—╳—╳—╳—╳—╳—╳—╳—╳—╳—╳—╳—╳—╳—╳
ScenarioPainter

NASDAQ 100 TECHNICAL SUNDAY 08 11 2020hey Traders,
Herewith is the video after the winning of USA presidential elections by Joe Biden.
The market needs first to open then we can consider the impact of the electoral results.
However we have on the video the two options set and ready to take off.
Cheers to Your Profits Guys !!
