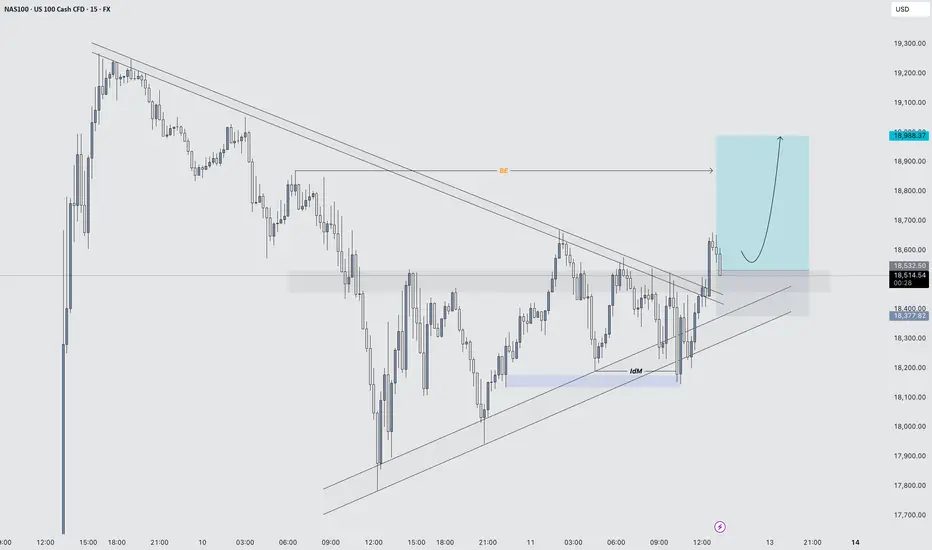
Does the Nasdaq keep dropping after approaching the nearby high?I have 2 zone that are coded as a "no close above" that should have held no issue
The reason why I am short mainly is because we haven't visit 50% of the New Week Opening Gap and we have rejected from 50% of the bearish gap above the range. As well as volumetric divergence after the rally.
I want to see this gap at least partially filled before anything else this week can happen.
NASDAQ 100 CFD

Hanzo | Nas100 15 min Breaks – Will Confirm the Next Move🆚 Nas100
The Path of Precision – Hanzo’s Market Strike
🔥 Key Levels & Breakout Strategy – 15M TF
🔥 Deep market insight – no random moves, only calculated execution.
☄️ Bullish Setup After Break Out – 19150 Zone
Price must break liquidity with high volume to confirm the move.
☄️ Bearish Setup After Break Out – 18820 Zone
Price must break liquidity with high volume to confirm the move.
🩸 15M Time Frame Confluence
————
CHoCH & Liquidity Grab @ 19200
Key Level / Equal lows Formation - 18820
Strong Rejection from 19300 – The Ultimate Pivot
Strong Rejection from 17800 – The Ultimate Pivot
Strong Rejection from 19100 – The Ultimate Pivot
🔥 1H Time Frame Confirmation
Twin Wicks @ 18820 – Liquidity Engineered
Twin Wicks @ 18500 – Liquidity Engineered
Twin Wicks @ 17800 zone – Liquidity Engineered
☄️ 4H Historical Market Memory
——
💯 18 jan 2024 – Bearish Retest 16900
💯 11 jan 2024 – Bearish Retest 16900
💯 18 jan 2024 – Bullish Run After Break That level
Hanzo | Nas100 15 min Breaks – Will Confirm the Next Move

Why the current section is important
Hello, traders.
If you "Follow", you can always get new information quickly.
Please click "Boost" as well.
Have a nice day today.
-------------------------------------
It is not easy to explain everything with just chart analysis.
Therefore, it is true that interpretation of various issues is necessary.
However, I am only explaining the chart.
The reason is that interpretation of various issues other than the chart is not easy for individual investors.
-
(NAS100USD 1W chart)
In order to continue the uptrend, the price must be maintained above the M-Signal indicator of the 1M chart.
If not, there is a high possibility of continuing the downtrend.
Therefore, if the price is maintained above 18693.7, I think it is highly likely that the uptrend will continue.
However, this is a medium- to long-term perspective.
-
(1D chart)
In the short term, the price should be maintained above the M-Signal indicator on the 1D chart.
In that sense, we can see that the current price position is an important section.
However, in order to continue the short-term upward trend, it should rise above the M-Signal indicator on the 1W chart.
In that sense, the support around 19848.3 is an important key point.
-
Currently, the StochRSI indicator has entered the overbought section.
Therefore, even if it continues to rise further, it is expected to show a downward trend in the end.
Therefore, if it is not supported near 19848.3, I think you should prepare for a decline.
At this time, you should check whether it can be supported near 18428.8 and rise.
The reason is that the HA-Low indicator of the 1D chart is formed.
-
The HA-Low and HA-High indicators are indicators created for trading on the Heikin Ashi chart.
The fact that the HA-Low indicator was created means that it rose from the low point section.
Therefore, if it is supported near the HA-Low indicator, then that is the time to buy.
If it falls without being supported by the HA-Low indicator, there is a possibility of a stepwise decline, so you should think about a countermeasure for this.
However, there is a difference between a downward trend following the HA-Low indicator and a simple downward trend.
A stepwise decline following the HA-Low indicator is likely to eventually form a bottom section.
The next volatility period is expected to be around April 29th.
-
Thank you for reading to the end.
I hope you have a successful trading.
--------------------------------------------------

WHY USDJPY BULLISH ??DETAILED ANALYSISUSDJPY is currently reacting strongly from a well-established demand zone near the 142.50–143.00 level. After a sharp correction, price has shown signs of exhaustion at support, suggesting a potential bullish reversal is underway. If this bounce sustains, we could see a significant upside move toward the 157.00 region, aligning with the previous high and maintaining the longer-term bullish structure.
From a technical standpoint, this level has historically acted as a key pivot zone. The bullish engulfing candlestick pattern forming here hints at renewed buyer interest, and with risk-reward highly favorable, this could be an ideal entry point for swing traders. The risk remains limited below 139.00, while the upside potential offers over 1:3 reward.
Fundamentally, the divergence in monetary policy between the Federal Reserve and the Bank of Japan continues to support a bullish outlook for USDJPY. Recent U.S. inflation data came in hotter than expected, reigniting speculation that the Fed may delay rate cuts. Meanwhile, the BoJ has shown minimal inclination to shift away from ultra-loose policy, keeping the yen pressured.
This pair remains one of the top-watched on TradingView, drawing high search volume due to its volatility and potential breakout structure. With market sentiment leaning risk-on and yield differentials favoring the dollar, this rebound from support could be the beginning of a new leg up. Keep an eye on DXY movements and U.S. treasury yields for confirmation.

USTEC,NAS100USTEC is still in a downtrend. The price has a chance to test the resistance zone 19588-19875. If the price cannot break through the 19876 level, it is expected that the price will drop. Consider selling in the red zone.
🔥Trading futures, forex, CFDs and stocks carries a risk of loss.
Please consider carefully whether such trading is suitable for you.
>>GooD Luck 😊
❤️ Like and subscribe to never miss a new idea!

Nasdaq 100 Opens with Bullish GapTrump Exempts Electronics from Tariffs; Nasdaq 100 Opens with Bullish Gap
Despite the weekend, the news flow remained intense amid the escalating trade war. According to media reports:
→ Certain tech products, including those made by Apple, have been exempted from Trump’s tariffs.
→ Trump announced he would make a significant statement regarding semiconductor tariffs on Monday, 14 April.
Stock Indices React to Trump’s Tariff Moves
These announcements were taken positively by the markets. As shown on the chart of the Nasdaq 100 index (US Tech 100 mini on FXOpen), the new week opened with a bullish gap exceeding 1.5% – a stronger performance than the S&P 500 (US SPX 500 mini on FXOpen), which also saw a bullish gap.
This may suggest that market participants are cautiously optimistic that the sweeping tariff measures might be eased through exemptions, delays, or negotiation concessions. Nevertheless, the CNN Business Fear & Greed Index remains in "extreme fear" territory, despite inching higher compared to last week.
As of this morning, the Nasdaq 100 (US Tech 100 mini on FXOpen) has recovered approximately 15% from its 2025 low.
Technical Analysis: Nasdaq 100 (US Tech 100 mini on FXOpen)
Seven days ago, we plotted an ascending blue channel and suggested that its lower boundary could act as support – which has indeed played out.
With the latest data in hand, there is reason to believe that bulls may now be aiming to push the price up toward the channel’s median line. However, as indicated by the arrows on the chart, this median appears to have shifted from acting as support to acting as resistance.
Bulls may also face headwinds from the wide bearish candle to the left, which was formed in reaction to Trump's tariff announcements. According to Smart Money Concept methodology, this area – marked by a bearish Fair Value Gap (highlighted with a rectangle) – may now serve as resistance.
This article represents the opinion of the Companies operating under the FXOpen brand only. It is not to be construed as an offer, solicitation, or recommendation with respect to products and services provided by the Companies operating under the FXOpen brand, nor is it to be considered financial advice.

Nasdaq market analysis: 14-APRIL-2025Good morning! Happy New Week! Here's your daily Nasdaq market analysis. Learn, grow, and trade wisely.

Trade the Structure: NAS100 Possible Retrace & Buy OpportunityThe NAS 100 recently broke its market structure after a twist in trade policy—with Donald Trump delaying tariffs by 90 days—which sparked a robust rally. On the 4‑hour chart, we're looking for a bullish setup where the initial surge might be followed by a pullback into a sideways accumulation zone. This consolidation is expected to form a "spring" pattern—a brief retest that could trap sellers—followed by a clear break of market structure that signals a renewed upward move. The entry is ideally on the breakout, backed by supportive volume, while risk management is maintained with a stop-loss positioned just below the range if/when price retraces into support. 🚀📈💰

Tactical US100 Trading: Converting 1W Trend into 30m Opportunity📈 The US100 index is currently exhibiting a bearish trend pattern on the weekly timeframe. We can observe a notable rally followed by a retracement into equilibrium when analyzed against the previous price wing range.
🔎 Currently, the index is positioned at a premium level, creating an environment where short sellers might be building positions in anticipation of further downward movement. However, market dynamics remain highly sensitive to external influences, particularly unexpected statements and social media announcements from influential figures like Donald Trump.
🌊 With such market unpredictability in play, focusing on shorter timeframes provides more actionable intelligence. Price action signals offer clearer guidance in this volatile environment.
⚡ Trade Opportunity: The 30-minute chart reveals a defined trading range worth monitoring. A definitive break above this range could present an opportunity to enter long positions, while a breakdown below support might signal a favorable short entry point.
🎯 This breakout strategy enables traders to respond to actual market movements rather than attempting to forecast the broader market direction—a particularly valuable approach given the current unpredictable market landscape.
⚠️ DISCLAIMER: This analysis is provided for informational purposes only and does not constitute financial advice. Trading carries significant risk of capital loss and may not be appropriate for all investors. Historical performance does not guarantee future outcomes. Always perform independent research and consider your personal financial circumstances before executing any trades. Market conditions are subject to rapid changes, and no trading methodology ensures profits. The information presented should be used as one of many inputs in your decision-making process.

NAS100 (15min) – Bullish Entry Activated1. Symmetrical Triangle Formation
Price was compressing inside a symmetrical triangle, with a series of lower highs and higher lows, indicating indecision and buildup of pressure.
2. Downside Fake-out (False Breakout)
Price briefly broke below the lower trendline, suggesting a potential bearish breakout.
However, there was no strong follow-through; instead, price quickly reclaimed the trendline and pushed back inside the structure.
This is a classic fake-out, often trapping late sellers and providing liquidity for buyers.
The rejection from the lows resulted in a long wick, signalling strong buying interest and failure to break down.
3. Aggressive Bullish Reaction
After reclaiming the triangle support, price moved rapidly back to the top of the triangle.
The next key move was a strong breakout above the upper trendline, confirming bullish intent.
4. Break and Retest
Price action followed through with a clean breakout above resistance, followed by a minor pullback and retest of the broken trendline, which held as support.
This retest offered a textbook entry point based on price action principles.
5. Bullish Structure Confirmation
Post breakout, price formed a higher low and continued to make a higher high, confirming a trend shift.
This structural change strengthens the bullish outlook.
Weekly Market Forecast: Stocks Markets Could Push Higher!In this video, we will analyze the S&P 500, NASDAQ, and DOW JONES futures for the week of April 14-18th.
The Stock Market Indices ended a turbulent week on a bullish note, and next week could see some continuation. The markets have peeked above the consolidation, and could be on the way to resume the overall bullish trend.
Wait for confirmations of the trend before jumping in! One bad report of tariffs or geo-political news can turn the markets down at any time.
Enjoy!
May profits be upon you.
Leave any questions or comments in the comment section.
I appreciate any feedback from my viewers!
Like and/or subscribe if you want more accurate analysis.
Thank you so much!
Disclaimer:
I do not provide personal investment advice and I am not a qualified licensed investment advisor.
All information found here, including any ideas, opinions, views, predictions, forecasts, commentaries, suggestions, expressed or implied herein, are for informational, entertainment or educational purposes only and should not be construed as personal investment advice. While the information provided is believed to be accurate, it may include errors or inaccuracies.
I will not and cannot be held liable for any actions you take as a result of anything you read here.
Conduct your own due diligence, or consult a licensed financial advisor or broker before making any and all investment decisions. Any investments, trades, speculations, or decisions made on the basis of any information found on this channel, expressed or implied herein, are committed at your own risk, financial or otherwise.

$DXY to 100 and heading lower, bullish for $EURUSDTVC:DXY the dollar index, was the primary driver of the equity bear market in 2022. With TVC:DXY hitting a 5 year high of 114 marked the bottom in AMEX:SPY and $QQQ. The recent strength in TVC:DXY was out of stock with TVC:DXY and Stock markets rising at the same time and dropping when the TVC:DXY is falling. Usually, the risk assets have an inverse correlation to the US Dollar index. These periods in history are unusual and are marked by some kind of macro events like recession etc. With tariffs discussion everywhere that might not be unrealistic to expect some kind of recession.
In that case where is the TVC:DXY headed? Currently the TVC:DXY is at a psychological level of 100. Once it breaks below 100 the next stop might be 95. If we see some kind of soft recession which is my worst-case scenario then we might see the lows of 90 in $DXY. If TVC:DXY goes down by 10% or lower than we can expect to the FX:EURUSD to go back to its recent high of 1.23.
Verdict: Short TVC:DXY ; Long FX:EURUSD , AMEX:SPY and NASDAQ:QQQ

DXY NEXT MOVE AND MARKET EFFECTThe US Dollar Index (DXY) is currently testing a major multi-year support zone around the 99.70–100.00 level. This level has held firm multiple times in the past, acting as a strong demand area during key macroeconomic cycles. Right now, price action is showing indecision with a clear do-or-die moment forming. If bulls defend this zone, we could witness a significant bullish reversal, potentially targeting the 103.00–105.00 range. However, a decisive break below this support could trigger a bearish wave toward the 96.00 handle or even lower.
Technically, this zone is not just psychological, but also a structural demand region, aligning with previous swing lows and price pivots. We’re seeing a potential for either a double bottom reversal or a breakdown structure forming, depending on how the market reacts in the coming sessions. Price is extremely oversold on higher timeframes, which could fuel a relief rally if momentum shifts. The reaction here will be key for broader market direction, especially as the dollar plays a pivotal role across forex majors.
Fundamentally, the DXY is under pressure as recent U.S. macro data reveals weakening momentum. March CPI printed hotter than expected, but other indicators like core PCE, NFP softness, and signs of slowing consumer demand are fueling expectations that the Fed may be nearing a policy pivot. At the same time, global risk sentiment is improving and yields have pulled back slightly, putting pressure on the greenback. However, rising geopolitical tensions and elevated oil prices continue to support USD as a safe-haven asset.
As a professional trader, this is a critical level to watch. I’m keeping an eye on price action confirmation for either a bullish engulfing setup or a clean break and retest of the 99.50 level. Both scenarios offer high-probability trades. Patience here is crucial — let the market reveal its hand, then align with the momentum. Dollar volatility is likely to remain elevated heading into next week, so managing risk with clarity is key.

WHY USDCAD IS DROPPING ?? DETAILED ANALYSISUSDCAD is currently reacting from a strong daily supply zone after a sustained upside move, and we are now seeing clear signs of bearish structure forming. Price has broken through multiple short-term supports and is now trading around the 1.38600 level, sitting right above a key demand zone that held in late 2023. Given the aggressive sell-off and rejection from the 1.43400–1.44500 resistance range, the market appears to be preparing for a deeper retracement. My bearish target is 1.34600, which aligns with the previous major demand level and psychological support.
Technically, the chart shows two strong bearish engulfing moves from supply, followed by lower highs and lower lows. This shift in structure combined with repeated rejections from resistance zones indicates the momentum is shifting in favor of sellers. If the current zone fails to hold on the retest bounce, we could see a strong continuation leg down. I expect a minor correction toward 1.41600 before further downside resumes, offering an ideal risk-reward short setup for swing traders.
From a fundamental perspective, the Canadian Dollar remains firm, supported by strong crude oil prices as WTI holds above $85 amid geopolitical tensions and production cuts. At the same time, recent U.S. data has shown mixed signals, with sticky inflation keeping the Fed cautious, but slowing job growth and consumer spending raising concerns. If oil prices remain elevated and Fed rate cut expectations increase later this quarter, the USDCAD pair is likely to stay under pressure.
With CAD strength driven by energy markets and the USD facing headwinds from softening macro indicators, this setup aligns both technically and fundamentally for a bearish continuation. I’ll be watching for clean rejections from the 1.40000–1.41600 resistance zone before loading more shorts toward 1.34600. Patience is key — this could be a high-probability move in the coming weeks.

NAS100 Triangle Apex – Breakout or Breakdown ImminentBullish View:
• Price is forming higher lows and holding above the lower ascending trendline.
• A breakout above the upper descending trendline near 18,500 would confirm bullish
momentum.
• If the breakout is sustained, potential upside targets include 18,650 and 18,800.
Bearish View:
• Price has tested the lower support trendline and shown weakness near the apex of the
triangle.
• A breakdown below 18,100 would indicate bearish momentum and invalidate the ascending
structure.
• If the breakdown is sustained, potential downside targets include 17,950 and 17,700.

NAS100 Is Bullish! Buy!
Please, check our technical outlook for NAS100.
Time Frame: 1D
Current Trend: Bullish
Sentiment: Oversold (based on 7-period RSI)
Forecast: Bullish
The price is testing a key support 18,440.0.
Current market trend & oversold RSI makes me think that buyers will push the price. I will anticipate a bullish movement at least to 21,081.9 level.
P.S
The term oversold refers to a condition where an asset has traded lower in price and has the potential for a price bounce.
Overbought refers to market scenarios where the instrument is traded considerably higher than its fair value. Overvaluation is caused by market sentiments when there is positive news.
Disclosure: I am part of Trade Nation's Influencer program and receive a monthly fee for using their TradingView charts in my analysis.
Like and subscribe and comment my ideas if you enjoy them!

CADJPY WILL BULLISH OR BEARISH ?? DETAILED ANALYSISCADJPY is currently forming a clear descending wedge pattern on the 12H chart, which historically signals a high-probability bullish reversal. The price has respected both the upper descending trendline and the lower support line with precision over the past few months, but the recent reaction near the wedge support is showing signs of buying interest. With the current price trading at 103.10, we are at a critical juncture where a breakout to the upside could initiate a strong momentum rally toward the 109.00 target.
Technically, this setup is supported by multiple touchpoints on both trendlines, suggesting a mature wedge structure ready to break. The risk-reward ratio is extremely favorable here, with clear invalidation below 100.90 and upside potential aligned with the upper structure of the broader consolidation zone. A confirmed breakout and candle close above the 104.00 resistance area would likely signal the start of a bullish impulse wave targeting 109.00 in the medium term.
On the fundamental side, CAD is supported by firm oil prices, which have remained elevated due to ongoing geopolitical risks and OPEC+ production cuts. Meanwhile, the JPY continues to weaken as the Bank of Japan remains firmly committed to ultra-loose monetary policy, even as inflation expectations globally stay elevated. This divergence in monetary policy between the BoC and BoJ is fueling carry trade flows, further boosting CADJPY's bullish outlook.
Looking ahead, any signs of risk-on sentiment in global markets, combined with resilient Canadian data, could act as a catalyst for the breakout. With the market positioning leaning heavily on JPY shorts and crude oil demand remaining strong, CADJPY is technically and fundamentally poised for a breakout rally. I'm watching the 104.00 zone closely—once cleared, I anticipate a swift move toward 109.00 with momentum on our side.

Actionable Nasdaq insights: 11-APRIL-2025Rise and shine, traders! Start your day with actionable Nasdaq insights. Let's grow your skills together, one chart at a time.

Hanzo | Nas100 15 min / Time To Take A Seriouce Short 🆚 Nas100
The Path of Precision – Hanzo’s Market Strike
🔥 Key Levels & Breakout Strategy – 15M TF
🔥 Deep market insight – no random moves, only calculated execution.
☄️ Bearish Reversal – 19100 Zone
Price must break liquidity with high volume to confirm the move.
🩸 15M Time Frame Confluence
————
CHoCH & Liquidity Grab @ 16880
Key Level / Equal lows Formation - 16350
Strong Rejection from 16350 – The Ultimate Pivot
Strong Rejection from 16890 – The Ultimate Pivot
🔥 1H Time Frame Confirmation
Twin Wicks @ 16890 – Liquidity Engineered
Twin Wicks @ 17000 – Liquidity Engineered
☄️ 4H Historical Market Memory
——
💯 18 jan 2024 – Bearish Retest 16900
💯 11 jan 2024 – Bearish Retest 16900
💯 18 jan 2024 – Bullish Run After Break That level
👌 The Market Has Spoken – Are You Ready to Strike?

Where is the support level for Nasdaq?! Is the bloodbath over?Bearish fair value gap ranges are taking over this chart and when we rally up into them, they have been sending us down over and over.
This week we have had the advantage of a bearish gap from last week's low. This gave us clear reason to seek longs to fill the gap. Now we have a small cushion of long interest in this range after retesting the 2023 yearly candle's broken high.
As long as we remain above this yearly level--16.960ish (Using last year's low for NQ 17,570ish)-- we will see a neat consolidation and sitting upon these levels before the rally that may lead us out of this range.
That is what I expect, however, if we lose these levels, you already know we are headed to the dungeon of a true recession.
20 min breakdown:

12 Tips Every New Forex Trader Should Know!New to Forex? These 12 tips will save you months of frustration.
Forex trading can be overwhelming in the beginning, but it doesn’t have to be. Whether you're just starting out or still finding your feet, these tips are designed to help you avoid common mistakes and fast-track your learning curve.
✅ Save this post
✅ Follow for more Forex insights
✅ Drop a comment with your biggest struggle as a beginner, I might turn it into the next tip!
Let’s grow together. 📈💪

NVIDIA Update 3 Rangebound with new Low for longsIn this video I bring to your attention what we could possibly expect if we lose the current level and if we do then where is the next crucial zone to look for Longs.
If you have read this then pls do Boost my work and any questions then leave them below

WHY GBPUSD BULLISH ?/ DETAILED ANALYSISGBPUSD has successfully completed a textbook retest of a major demand zone around 1.2650–1.2700, and we’re now seeing signs of bullish strength returning to the pair. After a corrective move from recent highs, price respected this zone with high precision, forming a strong bullish rejection candle that signals a potential reversal. With the market pushing back above 1.2850, we now have a clean higher low structure forming, indicating the next bullish leg is likely in play.
Technically, the 12H chart structure aligns well with a bullish continuation model. Price broke structure to the upside, came back to retest the neckline of the previous impulse leg, and is now bouncing with solid momentum. This is a classic demand zone reaction paired with a clean V-recovery pattern. As long as GBPUSD holds above 1.2700, I am targeting the 1.3400–1.3460 region in the coming weeks. The risk-reward setup here is highly favorable, with clearly defined invalidation below 1.2650 and upside potential aligned with macro sentiment.
On the fundamental side, GBP remains supported by persistent wage growth and sticky inflation in the UK economy, leading the market to price in fewer near-term rate cuts from the Bank of England. Meanwhile, the US dollar has started to show cracks as softer inflation data and slower NFP numbers last week are reducing expectations for further Fed tightening. This divergence in policy outlook between the BoE and the Fed is fueling GBPUSD upside, especially as the pair trades around key psychological levels.
Overall, with a strong confluence of technical bounce from demand, bullish fundamentals, and market sentiment shifting toward risk-on, GBPUSD looks well-positioned for further upside. A break and hold above 1.2900 will likely accelerate the move toward 1.3460. I'll be watching closely for momentum continuation setups as the pair builds bullish pressure in this zone.
