Nasdaq's Drop: A Temporary Rebound Before More Downside?I've been calling for a strong correction in the Nasdaq (and all major U.S. indices) since the start of the year—long before the tax war even began. I warned that a break below 20,000 was likely, with my final target set around 17,500.
And indeed, the index has fallen—regardless of what the so-called "cause" might be. Right now, Nasdaq is trading at 18,400, sitting right at a minor horizontal support zone.
________________________________________
A Short-Term Rebound Before More Downside?
📉 Overall Bias Remains Bearish – The broader trend still points lower.
📈 Rebound Likely – A push above 19,000 in the coming days wouldn’t be surprising.
⚠️ High-Risk Setup – Going long here is risky, given the current macroeconomic backdrop.
________________________________________
Trading Strategy: Short-Term vs. Long-Term
✅ For Short-Term Traders & Speculators – A temporary upside correction could offer a buying opportunity.
❌ For Swing & Long-Term Traders – It's better to wait for this rebound to fade and position short for the next leg down.
While a bounce could be on the cards, the bigger picture still points lower—I remain bearish in the long run. 🚀
Disclosure: I am part of Trade Nation's Influencer program and receive a monthly fee for using their TradingView charts in my analyses and educational articles.
NASDAQ 100 CFD

Strong Breakout on WUSDT: Potential for Major Bullish Move WUSDT has recently completed a strong breakout from a key resistance zone, signaling a potential shift in momentum and attracting significant attention from traders. The technical setup points to a confirmed breakout with increased trading volume, which typically precedes a powerful rally. This move is further supported by market participants showing renewed interest in the project fundamentals, positioning WUSDT for a potential bullish continuation.
With solid volume pouring in post-breakout, WUSDT looks ready to make a major move to the upside. Current market structure indicates a healthy retest of the breakout level, setting the stage for a possible rally of 250% to 300% in the coming sessions. Such gains are within reach, especially if broader market sentiment remains positive and volume continues to climb.
Investor confidence in WUSDT is growing, as many see it as an undervalued gem ready to reclaim higher levels. Its technical strength, combined with strong buying activity, presents an attractive opportunity for both swing traders and long-term holders. Watch for key psychological resistance levels to act as future targets while support holds firm below.
✅ Show your support by hitting the like button and
✅ Leaving a comment below! (What is You opinion about this Coin)
Your feedback and engagement keep me inspired to share more insightful market analysis with you!

NAS100 Testing Demand Zone – Major Reversal or More Drops? 📊 Market Overview:
The NASDAQ 100 (NAS100) just tested a strong demand zone (18,900 - 18,950) and is showing signs of a potential reversal. Can buyers push the price higher, or will bears take control?
🔹 Key Resistance Levels: 19,568 | 20,160
🔹 Current Price: 18,977
🔹 Key Support Levels: 18,896 (demand zone)
📉 Price Action Breakdown:
1️⃣ Sharp Drop into Demand Zone
Price recently fell from 19,568 after failing to break higher.
Buyers are now defending the 18,900 support zone, which has historically held strong.
2️⃣ Bullish Reversal Setup?
If the price holds above 18,900, we could see a bullish rally toward 19,568.
A breakout above 19,568 may open the way for 20,160+.
3️⃣ Bearish Breakdown Risk
If the price drops below 18,896, expect further downside towards 18,600 - 18,500.
Sellers would regain control, confirming a bearish continuation.
📊 Trading Plan:
📍 Bullish Case:
🔹 Look for bullish confirmation in the 18,900 - 18,950 zone.
🔹 A strong bounce could target 19,568, then 20,160.
📍 Bearish Case:
🔹 If price fails to hold 18,896, a short setup targeting 18,600 - 18,500 is possible.
🔹 Wait for a clean break & retest before shorting.
🔥 Will NAS100 bounce back from this demand zone, or will sellers dominate? Drop your thoughts in the comments! 👇
📊 Like & Follow for more trade insights! 🚀
#NASDAQ100 #TechStocks #Trading #StockMarket #SupplyAndDemand #Forex #PriceAction

NASDAQ Trade Plan: From 4-Hour Trend to 15-Minute Execution!NAS100 Strategy: Using Fibonacci and Market Structure for Precision!
📊 In this NASDAQ (NAS100) trade idea, I focus on a top-down approach starting with the 4-hour chart. If the 4-hour trend is bullish, I look for higher highs and higher lows. If bearish, I focus on lower highs and lower lows. 🔄 My key strategy is identifying pullbacks into equilibrium—around the 50% Fibonacci retracement level—within any price swing. This is my point of interest.
Once price moves into this area, I shift to the 15-minute chart to refine my entry. 🔍 Here, I wait for a break of structure during the pullback, aligning with the overall trend direction. This approach allows for precise execution while staying in sync with the larger trend. 🚀
⚠️ This is not financial advice. Always trade responsibly and manage your risk.

Nasdaq market analysis: 03-APRIL-2025Good morning Dear Traders! Join me for Nasdaq market analysis for the today. Share your charts, ask questions, and let's discuss trading strategies.

NAS100 short setup alert!Hello traders,
I've identified a prime shorting opportunity on NAS100! As noted in my previous analysis, the index remains under bearish pressure, driven by Apple’s stock decline.
On March 28, 2025, NAS100 broke below 19,100 support zone, confirming strong downside momentum. It then retraced to 19,500, filling an imbalance before facing a rejection.
📉 Trade Setup:
🔻 Sell Zone: 19,200 – 19,350
🎯 Target 1: 18,800
🎯 Target 2: 18,297
🛑 Stop Loss: 19,564
Stay disciplined, trade smart, and secure those profits! 🚀📊

NQ! Long Idea, MXMM and Quarterly TheoryToday I will show you my current long Idea on NQ! following the rules of the MXMM Buy Model and the Quarterly Theory.
Praise be to God
-T-

Nasdaq trading zones: 02-APRIL-2025Discover today's Nasdaq trading zones and refine your market analysis skills.

NAS - Instant Buy on 1 hrFX:NAS100 looks to be in a bullish trend on 1 hr timeframe after forming bullish divergence and reversing the bearish trend. Buying at current prices with SL set below the 1/4hr higher lows!

Nasdaq updated forecast with sell-side & buy-side targetsNQ futures aiming at 18900 level off these last highs. Now seeing developing weakness... expecting sellers to take it down for one more low as we approach the implementation of Trump's tariffs on 4/2.
Look for renewed buyer strength after the next set of lows as we approach the next FOMC rate decision into first half of May 2025.
This is a great swing trade setup for TQQQ, if desired, or long dated in-the-money QQQ call options.

Nasdaq 100 Opens the Door to a New Bearish TrendThe Nasdaq has been one of the indices showing the strongest selling bias in recent sessions. Over the past four trading days, it has fallen by more than 7% , as the market remains gripped by uncertainty surrounding White House trade policies and the threat of a new trade war. The proposed 25% tariffs on several countries are expected to take effect on April 2, and so far, there has been no official indication of a change in schedule. This has increased fears of a potential global economic slowdown, and if these conditions persist, it could further pressure equity indices, especially those already showing strong short-term bearish momentum.
New Potential Downtrend
Since February 20, the Nasdaq has been experiencing consistent selling pressure, driving the index below the 19,000-point level. Recent bullish attempts have so far failed to break through this new downward trendline, which now stands as the dominant technical structure for the index. If selling pressure remains intact, the current bearish trend could extend over the coming sessions.
ADX Indicator
Although the ADX line remains above the 20 level—generally considered the threshold for trend strength—it has been sloping downward, suggesting that the recent buying momentum may be losing strength, potentially leading to a short-term pause in market activity.
RSI Indicator
The Relative Strength Index (RSI) shows a similar picture. The RSI is hovering near the oversold zone at 30, and a bullish divergence has formed, as the Nasdaq has made lower lows, while the RSI has posted higher lows. This could indicate that selling momentum may be weakening, potentially paving the way for a short-term bullish correction.
Key Levels:
20,500 points – Distant resistance: This level aligns with the 200-period moving average. Price action approaching this area could revive bullish sentiment and potentially invalidate the current downtrend visible on the chart.
19,700 points – Near resistance: This level marks the upper boundary of the short-term descending trendline. It may serve as a tentative area for corrective upward movements in the upcoming sessions.
18,800 points – Key support: This level corresponds to 2024’s neutral price zone. If the price breaks below it, it could reinforce the current bearish trend and lead to further downside.
By Julian Pineda, CFA – Market Analyst

NAS100 selling pressure continues due to Apple stock declineHello traders,
As I highlighted in my previous NAS100 analysis, I expected a move to the downside. Technically, the index formed a double top, which was confirmed by a neckline break. Additionally, it has fallen below the rising support trendline from November 2024 and successfully retested it. This week, I anticipate further downside continuation. For an optimal selling opportunity, keep an eye on price action during the New York AM session. Ideally, I’d like to see a minor pullback to 19,200 before considering short positions, with the index potentially targeting liquidity at 18,297 and possibly extending to the 17,235 low from August 2024.
From a fundamental perspective, several factors are reinforcing our bearish outlook on NAS100:
Trade Tariff Concerns – New U.S. tariff measures are fueling trade war fears, weighing on tech stocks.
Inflation & Fed Policy – Higher inflation raises concerns about prolonged high interest rates.
Tech Sector Weakness – Leading NAS100 stocks like Apple and Nvidia are experiencing declines.
Stay cautious and trade wisely! 🚀

NAS100 - Stock market still in a downtrend?!The index is trading below the EMA200 and EMA50 on the 4-hour timeframe and is trading in its descending channel. If the index moves down, it will be clear that it is heading for further moves. At the channel ceiling, I could be close to the next sell-off.
As the new US tariffs are set to take effect on April 2, new evidence suggests that they may be less than the markets had expected. According to a recent report in the Toronto Star, Canada is likely to face the lowest level of tariffs, while Mexico, another member of the US trade agreement, is likely to face a similar situation. In addition, Trump’s recent statements about significant progress in controlling fentanyl (an industrial drug), are seen as a positive sign for improving trade relations.
In this regard, CNBC reported that VAT and non-tariff barriers will not be taken into account in calculating the tariff rate, or at least not fully. The main concern is that by threatening to impose a 25% tariff, Trump is actually preparing Canada and Mexico to accept higher rates than the current conditions. It seems that his goal is to impose the highest possible tariff level. This decision could be an incentive to increase tariff revenue to reduce taxes. Of course, such an approach is associated with high risks, since any level of tariffs can lead to retaliatory measures from trading partners.
In the case of Europe, tariffs imposed on American goods are higher than in other countries, but a large part of them relate to the automotive industry. Europe has previously announced that it is ready to reduce these tariffs. The question now is whether the EU will take a different approach than Mexico and Canada? That is, first impose higher tariffs and then negotiate to reduce them.
This scenario could ultimately benefit the US economy, as the bulk of its trade is with Mexico and Canada. Meanwhile, China remains a complex challenge, as it is the main target of Trump’s tariff policies. In addition, the US president recently proposed imposing tariffs on Venezuela, which could be a pretext for intensifying trade pressure on China. Polls show that 50% of the market expects new tariffs on China, which indicates the level of investor concern.
The European Union has reacted to the Trump administration’s decision to impose new tariffs on imported cars and expressed regret over the move. European Commission President Ursula von der Leyen has said the bloc will seek a negotiated solution to ease tensions, but she has also stressed that Europe’s economic interests will be protected against US trade policies.
The US credit rating has risen to a new low, according to a new report from Moody’s, which warns that tax cuts and trade tariffs could widen the country’s budget deficit.
Analysts at Goldman Sachs and Deutsche Bank say investors expect the effective tariff rate on all imports to be between 9% and 10%, although some analysts at Goldman Sachs have suggested a rate of 18%. However, inflation and exchange rate expectations point to lower figures.
If Trump’s promise of “reciprocal tariffs” is implemented, the effective tariff rate could be even lower than 5 percent, although this depends on whether the agricultural sector is also subject to tariffs. Some reports also suggest that non-tariff barriers may be completely ignored.
According to Deutsche Bank, it is very difficult to determine market expectations precisely. But if the tariff rate ultimately falls between 5 and 7.5 percent, markets are likely to react with more confidence. Otherwise, more volatility and turbulence in financial markets are expected.
At the beginning of the year, markets were in a positive and optimistic mood. The Republican victory in the election, the continuation of tax breaks and the possibility of new support packages were among the factors that reinforced this optimism.
However, factors such as the high US budget deficit, the deadlock in Congress and the high inflation rate have now challenged this optimism. Meanwhile, two important support tools that were effective in the past may no longer be as effective:
1. During Trump’s first term, the stock market was of particular importance to him. Even during the COVID-19 crisis, he constantly talked about the stock market and considered it part of his successes.
The term “Put Trump” meant that even if he made harsh statements, he ultimately acted in the market’s favor.
2. But now, in Trump’s second administration, he talks about “short-term pain” and “economic detoxification.” Tariff threats, reduced investment and policy uncertainty have caused the S&P 500 to fall 10% since February. Trump still considers the market important, but he is no longer as staunchly supportive of it as he used to be.
In addition, this week will include the release of a series of key economic data. Including:
• Tuesday: ISM Manufacturing PMI and JOLTS.
• Wednesday: ADP Private Employment Report
•Thursday: ISM services index and weekly jobless claims.
One of the big risks to the markets is that economic data remains weak while the ISM price sub-indices rise. Such a situation could signal a deflationary tailwind. In such a situation, even if the Federal Reserve moves to lower interest rates, it will still be difficult for the stock market to grow.

Monday NasDaqMorning Buddy, Today I hope to see 2 things that I have put on my Journal, 1 : Nas is within a daily FVG which seems weak to hold, but enough to create a manipulative retracement, either into the highlighted zone, which is a weekly bullish candle. 2 : The gap gets slowly taken, increasing FOMO trading and then retraces leaving $ lows, should this happen I expect to see the market retrace in a way that makes 15 minutes charts going down to 5, seem completely bullish.
I will drop a video later today to keep up with the charts. Stay tuned. Happy Trading

Weekly Market Forecast: SELL THE INDICES!In this video, we will analyze the S&P 500, NASDAQ, AND DOW JONES Futures for the week of March 31st - April 4th.
The equity markets took a bearish turn last week. This is likely to continue for the upcoming week.
Monday is the end of March. Tuesday brings a new week and new opportunities. April 2nd brings... potentially market flipping volatility. The day the Trump tariffs are implemented.
Be careful. Let the market give you direction, and then get involved.
Enjoy!
May profits be upon you.
Leave any questions or comments in the comment section.
I appreciate any feedback from my viewers!
Like and/or subscribe if you want more accurate analysis.
Thank you so much!
Disclaimer:
I do not provide personal investment advice and I am not a qualified licensed investment advisor.
All information found here, including any ideas, opinions, views, predictions, forecasts, commentaries, suggestions, expressed or implied herein, are for informational, entertainment or educational purposes only and should not be construed as personal investment advice. While the information provided is believed to be accurate, it may include errors or inaccuracies.
I will not and cannot be held liable for any actions you take as a result of anything you read here.
Conduct your own due diligence, or consult a licensed financial advisor or broker before making any and all investment decisions. Any investments, trades, speculations, or decisions made on the basis of any information found on this channel, expressed or implied herein, are committed at your own risk, financial or otherwise.

NQ weekly walkthrough and outlook for the next weekExpecting onesided displacement on NQ towards the sellside. Also we have NFP week.

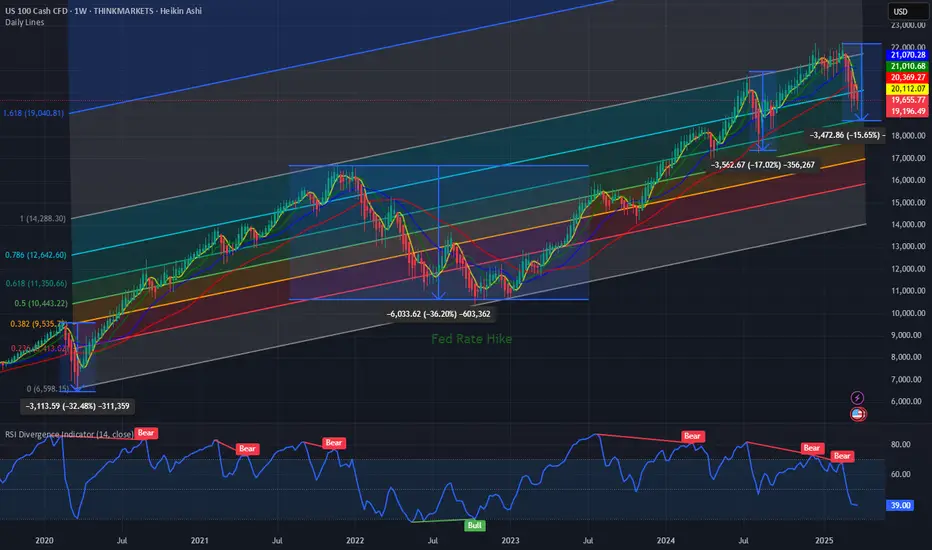
$NAS100 in correction mode. Is a bounce coming?Market experts will say 10% is a correction 20% is a bear market. In the last 5 years NASDAQ100 has been in the bear market 2 times. Once during COVID19 and another time during the FED Rate hike cycle. And it has been in correction mode in Aug 2024 when the Yen carry trade unwound.
Since Aug 2024 PEPPERSTONE:NAS100 has shown great strength with higher highs and higher lows and perfectly within the upward slopping Fib Retracement channel as shown in the chart below respecting the major fib levels and bouncing off from the 0.618 Fib retracement level every time it had a drawdown. The current correction in PEPPERSTONE:NAS100 is very close to the 0.618 Fib retracement level which is currently at 18700. This will indicate another potential downside of 2-3 % and if the Fib levels are supposed to holds then we will see a bottom @ 18700 and a bounce back from those levels. This will also bring down the RSI to low 30s which will indicate an oversold position.
Verdict: Start DCA into $ NAS100 and go long 18700.
NAS100 Is Bullish! Long!
Take a look at our analysis for NAS100.
Time Frame: 9h
Current Trend: Bullish
Sentiment: Oversold (based on 7-period RSI)
Forecast: Bullish
The market is on a crucial zone of demand 19,181.5.
The oversold market condition in a combination with key structure gives us a relatively strong bullish signal with goal 19,921.0 level.
P.S
We determine oversold/overbought condition with RSI indicator.
When it drops below 30 - the market is considered to be oversold.
When it bounces above 70 - the market is considered to be overbought.
Disclosure: I am part of Trade Nation's Influencer program and receive a monthly fee for using their TradingView charts in my analysis.
Like and subscribe and comment my ideas if you enjoy them!

NAS100: Likely rebound at major point within Ascending ChannelCAPITALCOM:US100 is likely to be undergoing a corrective move as it tests the lower boundary of the ascending channel, as shown on my chart. This boundary serves as dynamic trendline support and a significant bullish reaction could happen if buyers step in at this level.
A successful rebound from this support could lead to a move toward the midline of the channel, with the next target at around 22,000 . This scenario would maintain the overall bullish trend structure.
However, a clear breakdown below the trendline support would weaken the bullish outlook and could lead to further downside.
Monitoring candlestick patterns and volume at this critical zone is essential for identifying buying opportunities. Proper risk management is advised, always confirm your setups and trade with solid risk management.
If you have any thoughts on this setup or additional insights, drop them in the comments!

$NQ CorrectionPrice clearly is going towards Sellside Liquidity.
The standard deviation shows -2 to -2.5 is where price would reverse from and its also aligned with Sellside liquidity.
Idea: Bearish.

NDX / M2 Double Top? Echoes of the Dot-Com BubbleThis chart compares the NASDAQ 100 (NDX) to the M2 Money Supply, revealing a potentially critical inflection point. The NDX/M2 ratio has reached levels not seen since the dot-com bubble — and now appears to be forming a textbook double top.

Realtime markups: Indices tailspin to the weekly range lowsAfter rejecting the weekly highs aggressively on Wednesday, we had a clear run toward the low of the same weekly range candle's low. I believe this low will be hit before anything else.
We will see what the Monday open sequence looks like. See you then 🫡

"NAS100/US100" Indices Market Heist Plan (Scalping / Day Trade)🌟Hi! Hola! Ola! Bonjour! Hallo! Marhaba!🌟
Dear Money Makers & Robbers, 🤑 💰💸✈️
Based on 🔥Thief Trading style technical and fundamental analysis🔥, here is our master plan to heist the "NAS100/US100" Indices Market. Please adhere to the strategy I've outlined in the chart, which emphasizes long entry. Our aim is the high-risk Red Zone. Risky level, overbought market, consolidation, trend reversal, trap at the level where traders and bearish robbers are stronger. 🏆💸"Take profit and treat yourself, traders. You deserve it!💪🏆🎉
Entry 📈 : "The vault is wide open! Swipe the Bullish loot at any price - the heist is on!
however I advise to Place buy limit orders within a 15 or 30 minute timeframe most recent or swing, low or high level. I Highly recommended you to put alert in your chart.
Stop Loss 🛑:
Thief SL placed at the recent/swing low level Using the 30m timeframe (19700) swing trade basis.
SL is based on your risk of the trade, lot size and how many multiple orders you have to take.
🏴☠️Target 🎯: 20350 (or) Escape Before the Target
🧲Scalpers, take note 👀 : only scalp on the Long side. If you have a lot of money, you can go straight away; if not, you can join swing traders and carry out the robbery plan. Use trailing SL to safeguard your money 💰.
"NAS100/US100" Indices Market Heist Plan (Scalping / Day Trade) is currently experiencing a bullishness,., driven by several key factors.
📰🗞️Get & Read the Fundamental, Macro, COT Report, Geopolitical and News Analysis, Sentimental Outlook, Intermarket Analysis, Index-Specific Analysis, Positioning and future trend targets.. go ahead to check 👉👉👉
📌Keep in mind that these factors can change rapidly, and it's essential to stay up-to-date with market developments and adjust your analysis accordingly.
⚠️Trading Alert : News Releases and Position Management 📰 🗞️ 🚫🚏
As a reminder, news releases can have a significant impact on market prices and volatility. To minimize potential losses and protect your running positions,
we recommend the following:
Avoid taking new trades during news releases
Use trailing stop-loss orders to protect your running positions and lock in profits
💖Supporting our robbery plan 💥Hit the Boost Button💥 will enable us to effortlessly make and steal money 💰💵. Boost the strength of our robbery team. Every day in this market make money with ease by using the Thief Trading Style.🏆💪🤝❤️🎉🚀
I'll see you soon with another heist plan, so stay tuned 🤑🐱👤🤗🤩
