NASDAQ about to nuke?In my previous ideas and posts i told you about #nasdaq chart structure' s weaknesses. Well, it has already made the extended rally and the time has likely come.
In lower time frame, nasdaq, spx and dji already started dumps and broke the local supports.
In monthly candle stick size, i mean higher time frame, #nasdaq100 chart:
- Formed a huge bearish divergence
- Stoch RSI made bearish triple top
- MACD is warning about the trend reversal (Bullish to bearish)
The strong support zones in HTF are:
Monthly EMA Ribbon at 15000
Monthly İchimoku Cloud bottom at 12000
The stronghold the historical trendline support at 6000.
This strategy is NOT a SHORT TERM strategy and NOT FINANCIAL ADVICE. Dyor.
Just avoid being over greedy.
NASDAQ 100 CFD

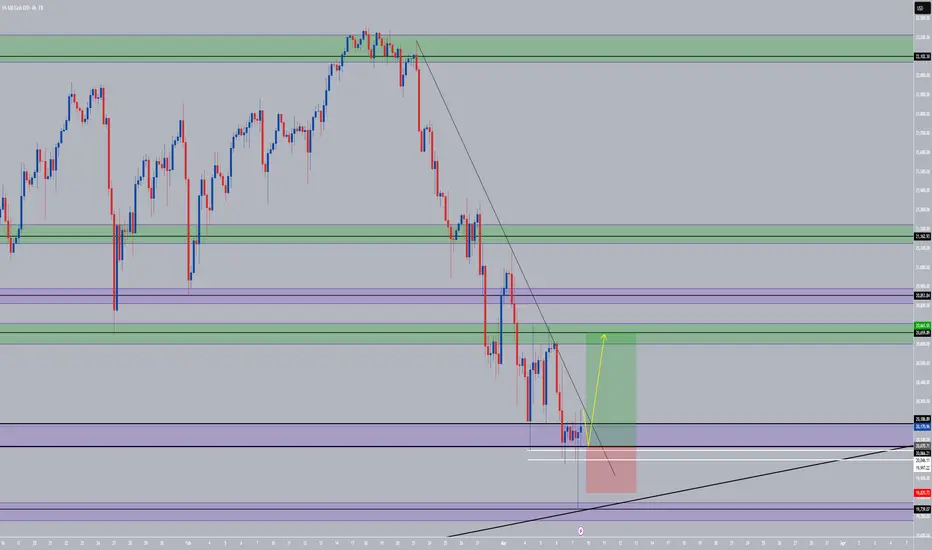
The Next Leg nas100To me this is very bullish (break and retest on lower time frames and even the 6month chart is showing a retest to the last candle close) Im looking for a 50 percent push back up on the bearish candle on the 6month chart and if we continue i will continue to hold and close partials

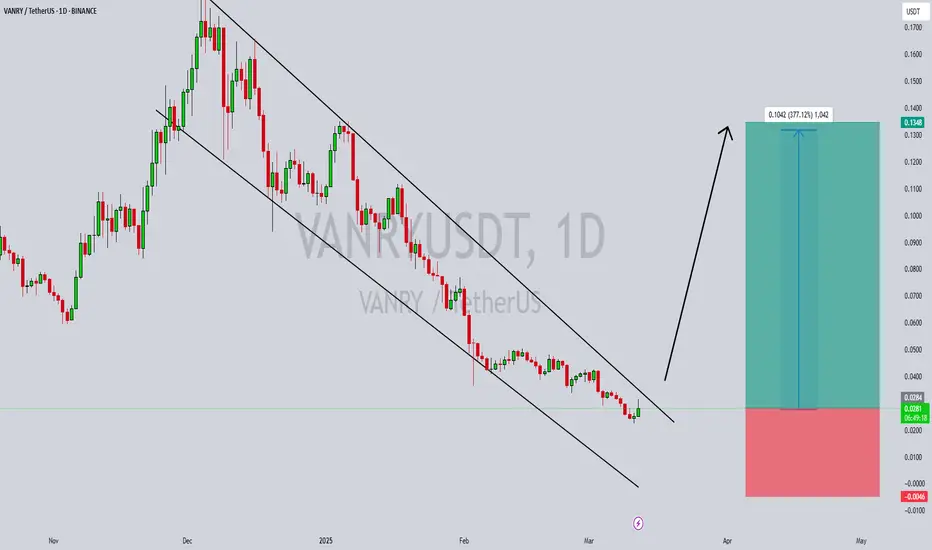
VANRYUSDT Approaching a Breakout from Falling Wedge VANRYUSDT is currently forming a falling wedge pattern, a bullish technical setup that traders are closely watching. This pattern often signals a potential breakout, and with strong volume backing the movement, the chances of a significant price surge are increasing. As the price consolidates within the wedge, buyers are gradually stepping in, indicating growing investor confidence in this project.
The market sentiment around VANRYUSDT remains positive, with investors showing increased interest in its potential. A breakout from this pattern could trigger an explosive rally, with expected gains ranging between 250% to 300%. If the price successfully breaches the resistance, it could initiate a strong uptrend, attracting even more market participants and pushing VANRYUSDT toward higher levels.
With strong volume supporting the price action, traders should keep a close watch on the key resistance level. A confirmed breakout with sustained buying pressure could validate the bullish outlook. As the crypto market remains volatile, proper risk management and technical confirmation are essential before entering a position in this promising setup.
✅ Show your support by hitting the like button and
✅ Leaving a comment below! (What is your opinion about this Coin?)
Your feedback and engagement keep me inspired to share more insightful market analysis with you!
NAS100 H4 | Bullish BreakoutBased on the H4 chart analysis, the price is rising toward our buy entry level at 19,532.22 (Bullish breakout)
Our take profit is set at 20,050.33, a pullback resistance.
The stop loss is placed at 19,127, a swing low support level.
High Risk Investment Warning
Trading Forex/CFDs on margin carries a high level of risk and may not be suitable for all investors. Leverage can work against you.
Stratos Markets Limited (fxcm.com/uk):
CFDs are complex instruments and come with a high risk of losing money rapidly due to leverage. 63% of retail investor accounts lose money when trading CFDs with this provider. You should consider whether you understand how CFDs work and whether you can afford to take the high risk of losing your money.
Stratos Europe Ltd (fxcm.com/eu):
CFDs are complex instruments and come with a high risk of losing money rapidly due to leverage. 63% of retail investor accounts lose money when trading CFDs with this provider. You should consider whether you understand how CFDs work and whether you can afford to take the high risk of losing your money.
Stratos Trading Pty. Limited (fxcm.com/au):
Trading FX/CFDs carries significant risks. FXCM AU (AFSL 309763), please read the Financial Services Guide, Product Disclosure Statement, Target Market Determination and Terms of Business at fxcm.com/au
Stratos Global LLC (fxcm.com/markets):
Losses can exceed deposits.
Please be advised that the information presented on TradingView is provided to FXCM (‘Company’, ‘we’) by a third-party provider (‘TFA Global Pte Ltd’). Please be reminded that you are solely responsible for the trading decisions on your account. There is a very high degree of risk involved in trading. Any information and/or content is intended entirely for research, educational and informational purposes only and does not constitute investment or consultation advice or investment strategy. The information is not tailored to the investment needs of any specific person and therefore does not involve a consideration of any of the investment objectives, financial situation or needs of any viewer that may receive it. Kindly also note that past performance is not a reliable indicator of future results. Actual results may differ materially from those anticipated in forward-looking or past performance statements. We assume no liability as to the accuracy or completeness of any of the information and/or content provided herein and the Company cannot be held responsible for any omission, mistake nor for any loss or damage including without limitation to any loss of profit which may arise from reliance on any information supplied by TFA Global Pte Ltd.
The speaker(s) is neither an employee, agent nor representative of FXCM and is therefore acting independently. The opinions given are their own, constitute general market commentary, and do not constitute the opinion or advice of FXCM or any form of personal or investment advice. FXCM neither endorses nor guarantees offerings of third-party speakers, nor is FXCM responsible for the content, veracity or opinions of third-party speakers, presenters or participants.

Nasdaq 100 Enters CorrectionNasdaq 100 Enters Correction
As shown on the Nasdaq 100 (US Tech 100 mini on FXOpen) index chart today:
→ The index has fallen below the psychological 20,000-point level, reaching its lowest in approximately six months.
→ The decline from the December peak now exceeds 10%, officially marking the start of a correction.
Why the Nasdaq 100 Is Falling Today
Bearish sentiment stems from a combination of factors, including (according to Zacks analysts):
→ The Trump administration’s tariff policies and their potential economic impact. Concerns increased after the latest jobs report showed unemployment rising from 4.0% to 4.1%.
→ Worries about AI investment costs and their long-term profitability.
→ Market anticipation of tomorrow’s Consumer Price Index (CPI) release at 15:30 GMT+3.
Technical Analysis of the Nasdaq 100 Chart
Price movements indicate that the steeper growth channel (marked in black), which had been in place since last August, has lost relevance. A broader view of the chart reveals that the index has now approached the lower boundary of a long-term channel (marked in blue), which has been forming since early 2024. Key price formations that helped define this channel are highlighted in orange.
Given that the index is at the lower boundary of the blue channel and the RSI indicator on the daily chart has dropped to multi-year lows, a short-term recovery may be likely. However, the fundamental backdrop will play a decisive role—clear signs of U.S. economic stability could support a rebound, while extreme fear (as reflected in CNN’s Fear & Greed Index) may continue to weigh on sentiment.
This article represents the opinion of the Companies operating under the FXOpen brand only. It is not to be construed as an offer, solicitation, or recommendation with respect to products and services provided by the Companies operating under the FXOpen brand, nor is it to be considered financial advice.

Short-Term Opportunity in NAS100: Rebound in Play?Since reaching its all-time high (ATH) three weeks ago, NAS100 has dropped approximately 3,000 pips, hitting a low near the 19,000 zone yesterday.
Currently, the CFD price is rebounding, and this recovery could extend into the New York trading session.
Although my overall correction target remains around 18,000, I anticipate a short-term relief rally at this stage.
From a short-term trading perspective, the 19,000 level could present a good entry opportunity. With a tight stop and a target slightly above 20,000, this setup offers a favorable risk-reward ratio.

NAS 100 Overextended – Brace for a Pullback! The NAS 100 is looking highly overextended at the moment 📊. Market conditions are precarious, with many instruments trading into key support and resistance levels on both the daily and weekly timeframes ⏳.
A sharp pullback 📉 could be on the horizon, potentially offering a counter-trend buying opportunity on the lower timeframes for the US 100 💰. If it pushes higher, it may set up a potential short trade 🎯.
🚨 Not financial advice – trade wisely and manage your risk! ⚖️

QQQ long term trend is down with short-term relief rallyI am guessing a bit more downside before we see a relief rally. The AI bubble is starting to unwind, and that falling knife is sharp. I am patiently waiting for some version of a short-term bottom. You can see in the chart that price is has several key support lines within near reach. I would expect testing and hopefully finding some support in the coming days. If it is like the COVID bubble unwind, then we could see a strong reverse rally out of this range. However, I think it is pretty clear QQQ is in correction with a convincing loss of the 200 day SMA.

Nasdaq 100 Drops More Than 4.0% Amid Market UncertaintyThe Nasdaq 100 index has already accumulated a loss of over 4.0% during today’s session and has declined more than 12% since its peak on February 18. The strong bearish movement remains intact as the market anticipates that the new 25% tariffs imposed on countries like Mexico and Canada could begin affecting production costs for U.S. companies. In the long run, this may lead to a low-return environment that could be unfavorable for the index.
Additionally, companies such as Amazon, Nvidia, and Microsoft have seen declines between 3% and 5% in recent sessions, reinforcing the bearish pressure on the Nasdaq due to their heavy weighting within the index.
Momentum Accelerates
With the strong downward bias currently present in the chart, selling pressure has been able to break through the support level at 19,700 points. However, the rapid price acceleration is beginning to have a significant impact, which could lead to short-term bullish corrections.
Oversold Indicators
Bollinger Bands: The bearish momentum has broken below the lower Bollinger Band, which could indicate a high acceleration in recent price movements.
RSI (Relative Strength Index): The RSI line continues to decline below the oversold level of 30, suggesting an imbalance between buying and selling forces.
MACD (Moving Average Convergence Divergence): The MACD histogram has dropped to levels not seen since July 2024, indicating a persistent downward acceleration without giving buyers an opportunity to regain control.
The alignment of these indicators suggests a significant acceleration of the bearish trend, which may lead to a standardization of bullish corrections in the short term.
Key Levels:
18,800 points – Near-Term Support: This level corresponds to lows not seen since September 2024. Persistent trading below this level could further accelerate the strong downward bias currently present in the chart.
19,700 points – New Resistance Zone: This level aligns with the lower Bollinger Band, which may serve as the area where potential bullish corrections could take place in the short term.
20,500 points – Distant Resistance: A neutral zone that has been tested by price movements in recent months. A sustained rally back to this level could challenge the current bearish sentiment prevailing in the market.
By Julian Pineda, CFA – Market Analyst

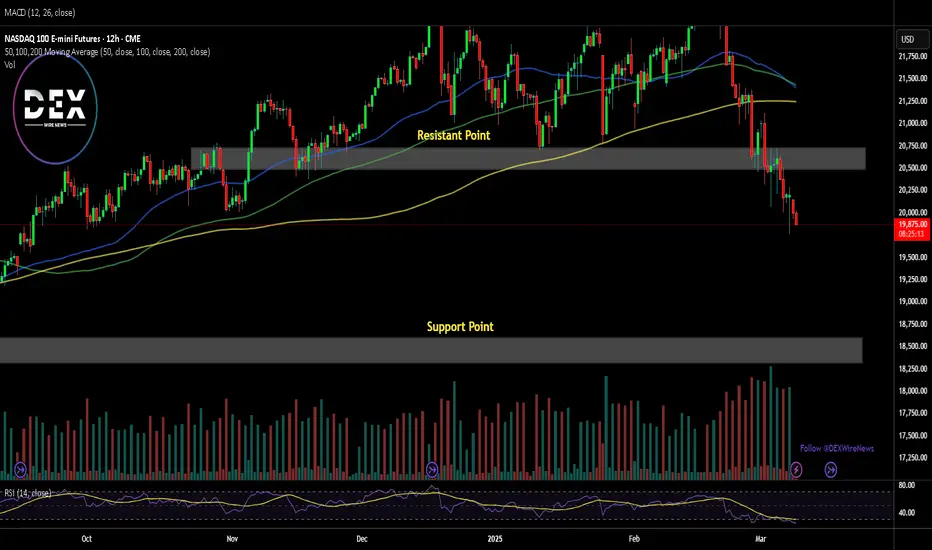
NASDAQ Futures Fall Following S&P's Worst Week Since SeptemberUS stock futures fell solidly Monday as investors and traders took the weekend to process the February jobs report and prepared for a busy week of economic data, headlined by a report on inflation amid concerns over its resurgence under President Trump's unpredictable trade policy.
Dow Jones Industrial Average futures (YM=F) fell 1%, while futures attached to the benchmark S&P 500 (ES=F) also dropped 1% after the index posted its worst week since September. Futures tied to the Nasdaq (NQ=F) also slipped around 1.79%.
All three major indexes looked set to build on losses of more than 2% last week.
For the Nasdaq Composite, the resistance point has been faded with selling pressure increasing, the 18,500 point could serve as support point for Nasdaq price index. However, should a trend reversal occur, the break above the resistant pivot may catalyse a bullish spree as industries, investors and traders are dissecting President Trump's trade policy.
Will the stock market turn positive again?!The index is trading below the EMA200 and EMA50 on the four-hour timeframe and is trading in its descending channel. If the index moves down towards the specified demand zone, we can look for further buying opportunities in Nasdaq. A break of the resistance range and the channel ceiling will also cause the Nasdaq to continue its short-term upward trend.
In February 2025, the U.S. labor market grew at a slower pace than anticipated. According to published data, non-farm employment increased by 151,000 jobs in January, while expectations were set at 160,000.This indicates that while job growth continues, its momentum has been weaker than projected.
The unemployment rate rose to 4.1% in February, slightly above the expected 4%. Meanwhile, labor force participation declined by 0.2 percentage points to 62.4%. Average hourly earnings increased by 0.3% during the month, aligning with forecasts. On an annual basis, wage growth reached 4%, slightly below the estimated 4.1%.
Among various sectors, the highest job gains were recorded in healthcare (52,000 jobs), finance (21,000 jobs), and local government (20,000 jobs). Employment also rose in construction, transportation, social assistance, and manufacturing.
Conversely, some industries experienced job losses. The hospitality sector shed 16,000 jobs, retail lost 6,000, and the federal government reduced employment by 10,000 positions. Additionally, temporary jobs declined by 12,000, signaling a potential slowdown in economic growth.
Overall, the report suggests that while the U.S. labor market remains stable, certain indicators, such as rising unemployment and a decline in full-time jobs, may point to a deceleration in economic expansion. Following the report’s release, the U.S. dollar weakened slightly, but the market reaction was muted due to prior concerns over a more significant decline.
Hassett, the White House economic advisor, stated that future reports are likely to show further reductions in government employment. He emphasized the administration’s plan to cut government jobs and spending while boosting employment in the manufacturing sector. He also confirmed that tariffs are inevitable, arguing that such measures will support the expected 3% to 4% economic growth. Hassett expressed doubt that President Trump would grant exemptions for steel tariffs.
As investors try to adjust to Trump’s evolving trade policies, the U.S. Consumer Price Index (CPI) report for February is set to be released on Wednesday. Given the recent Personal Consumption Expenditures (PCE) index data from January, it is possible that CPI could be entering a new downward trend.
The Federal Reserve’s battle against inflation remains challenging, and the recent rise in price pressures has undoubtedly been frustrating for policymakers. However, signs indicate that U.S. inflation may be shifting course, with expectations of a decline in the coming months.
One major uncertainty remains: tariffs. Trump’s decision to impose a 25% tariff on Canadian and Mexican imports and a 20% increase on Chinese goods, along with additional sector-specific and retaliatory tariffs still under discussion, could undermine the Fed’s efforts to bring inflation down to 2%.
In January, the overall CPI climbed to 3%, marking its highest level since June 2024. Core inflation also reached 3.3%. However, February’s data is expected to ease months of concern about inflationary resurgence, with projections indicating a decline in overall CPI to 2.9% and core inflation to 3.1%. Monthly estimates for both indices stand at 0.3%.
Later in the week, Thursday’s Producer Price Index (PPI) for February will provide further insights into inflationary pressures, while on Friday, investors will closely monitor the University of Michigan’s preliminary consumer sentiment survey for March. Last month’s survey raised alarms, as consumer inflation expectations climbed to their highest level in 30 years.

NASDAQ Potential DownsidesHey Traders, in today's trading session we are monitoring NASDAQ for a selling opportunity around 20400 zone, NAS100 is trading in a downtrend and currently is in a correction phase in which it is approaching the trend at 20400 support and resistance area.
Trade safe, Joe.

S&P, NASDAQ, DOW JONES Weekly Market Forecast: Mar 10-14 In this video, we will analyze the S&P 500, NASDAQ, AND DOW JONES Futures. We'll determine the bias for the upcoming week, and look for the best potential setups.
Markets have been bearish due to mixed numbers employment, Fed statements, and uncertainty in US trade policies. Are the markets poised for a bounce back week? Perhaps. Traders will need to exercise patience before jumping in these volatile markets, waiting for the proper confirmations before we determine a bias. Once the markets tip their hand in that way, we can take advantage.
Enjoy!
May profits be upon you.
Leave any questions or comments in the comment section.
I appreciate any feedback from my viewers!
Like and/or subscribe if you want more accurate analysis.
Thank you so much!
Disclaimer:
I do not provide personal investment advice and I am not a qualified licensed investment advisor.
All information found here, including any ideas, opinions, views, predictions, forecasts, commentaries, suggestions, expressed or implied herein, are for informational, entertainment or educational purposes only and should not be construed as personal investment advice. While the information provided is believed to be accurate, it may include errors or inaccuracies.
I will not and cannot be held liable for any actions you take as a result of anything you read here.
Conduct your own due diligence, or consult a licensed financial advisor or broker before making any and all investment decisions. Any investments, trades, speculations, or decisions made on the basis of any information found on this channel, expressed or implied herein, are committed at your own risk, financial or otherwise.

NAS100 - Bullish Possibility- Resistance zone has push price down but price came right back up testing the resistence zone for the 3rd time... making the chances higher for price to break the resistence area this time.
- The downtrend line has been hit 3 times previously, Very high chances of a bullish break out on the 4th or 5th time.
- Last confirmation, as you look my analysis, you can see a double support in white. If price respect this support zone then it will give a great boost to push price right back up for a great bullish reaction.
* Educational purpose only

EURUSD Bullish Surge: Targeting 1.1000 with 200+ Pips GainEURUSD is currently trading at 1.0700, moving exactly as predicted and showing strong bullish momentum toward the 1.1000 target. The pair has gained significant traction, with price action aligning with technical expectations for a 200+ pip rally. If this momentum continues, EURUSD could push higher, testing key resistance levels before reaching its final target.
From a technical standpoint, the bullish structure remains intact, supported by strong price action and increased buying pressure. A break above minor resistance levels near 1.0800 could accelerate the move toward 1.1000. Traders should monitor volume and price action confirmations to ensure sustained bullish momentum, while also keeping an eye on potential retracements for re-entry opportunities.
Fundamentally, the euro’s strength is driven by market expectations surrounding the European Central Bank’s (ECB) monetary policy, as well as potential weakness in the US dollar. If the Federal Reserve signals a dovish stance or weaker economic data emerges from the US, the dollar could see further declines, supporting EURUSD’s bullish move. Additionally, any positive Eurozone economic data could further fuel the rally.
In summary, EURUSD is following its projected bullish path, with 1.1000 as the next key target. Traders should watch for continued bullish confirmations while staying cautious of economic events that could impact the pair’s momentum. With technical and fundamental factors aligning, the pair remains well-positioned for further upside.

Actionable Nasdaq insights: 05-Mar-2025Rise and shine, traders! Start your day with actionable Nasdaq insights. Let's grow your skills together, one chart at a time.

POSITION REVERSED ON NASDAQWe reversed our position after that we got an IFVG to target the DLQ we have at 19785.48.

NASDAQ Potential DownsidesHey Traders, in today's trading session we are monitoring NAS100 for a selling opportunity around 20700 zone, NASDAQ is trading in a downtrend and currently is in a correction phase in which it is approaching the trend at 20700 support and resistance area.
Trade safe, Joe.

BUY NASDAQI'm sharing with you our trade this morning on NASDAQ which is based on the FVG after the LQ grab, to target the BUYSIDE LIQUIDITY.
Follow for more!

Nasdaq market analysis: 04-Mar-2025Good morning, traders! Welcome to today's Nasdaq market analysis. Compare my price action insights with your own charts and enhance your trading skills.

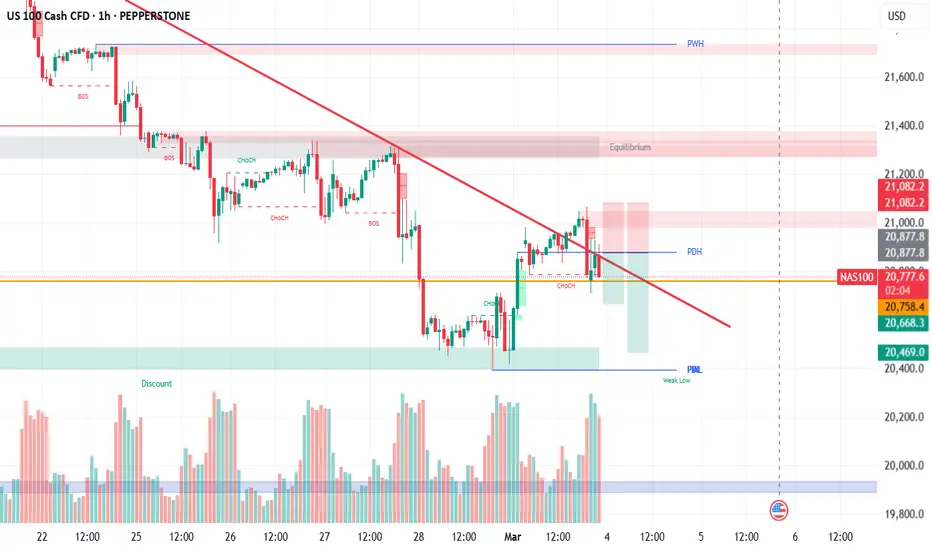
NAS100 Bearish (Descending Trend, DOW LLs)NAS100 Unable to sustain above previous daily high. Overall indexes are seeing sell pressure with RISK ON instruments such as AUD and NZD showing sell off. Technically, bearish trend is not broken and DOW Lower Lows (LLs) still intact. Fundamentally Indexes will remain bearish.
Trade Setup:
Entry at Previous Day High (CMP)
SL at previous LH.
TP at 1:1 and 1:2
TP FILLED ON NASDAQCouple minutes ago, I posted to sell NASDAQ, and now the market reached our TP.
Follow for more trades!
