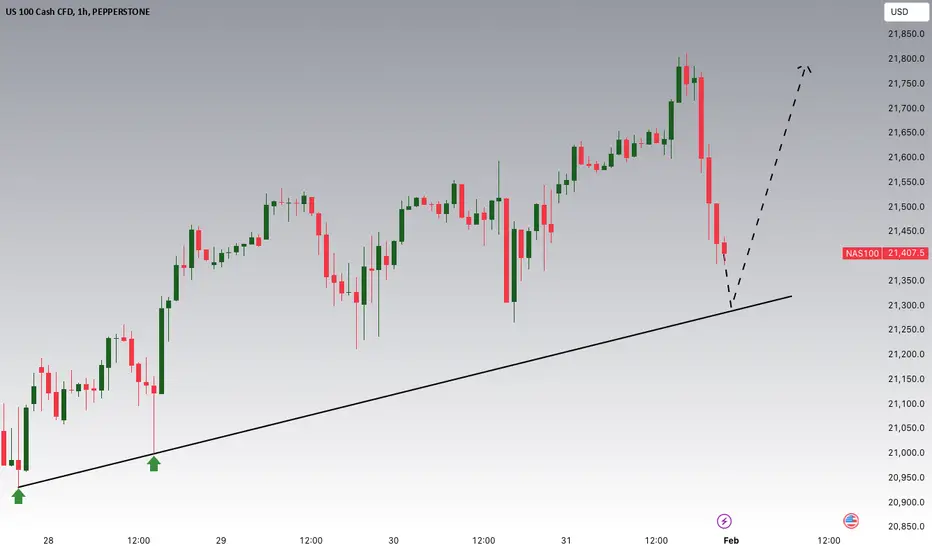
NASDAQ Potential UpsidesHey Traders, in the coming week we are monitoring NAS100 for a buying opportunity around 21300 zone, NASDAQ is trading in an uptrend and currently is in a correction phase in which it is approaching the trend at 21300 support and resistance area.
Trade safe, Joe.
NASDAQ 100 CFD
Nasdaq market analysis: 31-Jan-2025Let’s dive into today's Nasdaq market analysis. Share insights, and potentially spot opportunities for good pips.

Nas100 - 15min ( Sell Scalping Target Range 150 PIP ) The recent analysis of the Nasdaq 100 (Nas100) on the 15-minute timeframe indicates a significant bearish sentiment following a breach of the key level at approximately 21,470, accompanied by elevated trading volume. This development suggests a potential continuation of downward momentum. It is imperative to rely on precise opportunities and analyses rather than mere numerical data, ensuring a more informed decision-making process in the current market environment.
⚡️Nas100 / FXCM
Best Break Our / Key level's 15m Tf
🚨Bearish After Break key level + High Volume / 21470 Area
⚡️ We Only Sent Most Accurate Opportunity and Analysis 💲 Not by Number ..+

Nas100 - 15 min ( Best Buy And Sell Scalping After Break out ) The Nasdaq 100 (Nas100) trading analysis provided by FXCM identifies critical breakout levels on the 15-minute time frame. A bullish sentiment is anticipated following a breakout above the key level at 21,600, particularly if accompanied by high trading volume. Conversely, a bearish outlook would emerge upon a decisive break below the 21,520 level, also supported by significant volume. It is noteworthy that our focus is on delivering the most accurate opportunities and analyses, underscoring a qualitative approach rather than a quantitative one.
⚡️Nas100 / FXCM
Best Break Our / Key level's 15m Tf
🚨Bullish After Break key level + High Volume / 21600 Area
🚨Bearish After Break key level + High Volume / 21520 Area
⚡️ We Only Sent Most Accurate Opportunity and Analysis 💲 Not by Number ..+

CHFJPY Symmetrical Triangle Pattern AnalysisCHFJPY is currently trading at 170.100, with a target price set at 165.000. The trade setup suggests a potential gain of over 500 pips if the price reaches the target. A symmetrical triangle pattern has been identified on the chart, a common technical pattern indicating consolidation before a breakout. In this case, the breakout has already occurred to the downside, signaling a bearish trend. Traders often expect strong momentum after a confirmed breakout, reinforcing the probability of price decline. The target of 165.000 is likely based on measured move calculations from the triangle pattern. Risk management strategies, such as stop-loss placement, are crucial to mitigate potential reversals. Fundamental factors like central bank policies or economic events could influence the trade’s outcome. If selling pressure continues, the price may reach the target faster than anticipated. Monitoring key support and resistance levels will help assess trade validity.

Nasdaq analysis: 30-Jan-2025Good morning, everyone! Today's Nasdaq analysis is designed to educate and empower. Use these insights to refine your price action trading strategy.

Nasdaq 100 Remains Neutral After the Fed's DecisionThe NAS100 initially dropped nearly 0.6% as the Federal Reserve's official decision was announced. However, so far, the event has not been decisive on the daily chart to establish a clear direction. The central bank chose to keep interest rates at 4.5% , as expected, and in its official statement, it acknowledged that inflation remains somewhat elevated and is still far from the 2% target. As long as this rate pause outlook continues, a sustained high level of 4.5% could continue to hinder overall economic activity and may become a key factor in the bearish bias that emerged in December.
Short-Term Sideways Channel:
At the moment, the market remains within a well-defined sideways range, with a ceiling at 22,000 points and a floor at 21,000 points. The price continues to fluctuate within this range, reflecting a clear lack of trend in recent movements. For now, this range stands as the most significant technical formation, potentially serving as a precursor to a much larger trending move.
Neutrality in Indicators:
The RSI line remains near the neutral 50 level , indicating that there is currently a perfect balance between buying and selling forces in the market.
The MACD histogram closely resembles the RSI, oscillating near the 0-neutral line , which suggests that the moving averages do not show a clear short-term trend bias.
The neutral stance of both indicators suggests that the Nasdaq may continue moving sideways for now, aligning with the current range-bound market behavior.
Key Levels:
22K – The most important resistance, aligning with the top of the sideways channel. A breakout above this level could be decisive, signaling new all-time highs and reviving the long-term bullish trend.
21K – A crucial short-term support level, coinciding with the 100-period moving average. Price action near this level could intensify selling pressure, potentially leading to more significant bearish moves.
20K – The ultimate support level currently holding the structure. A drop to this level could tilt the balance towards the formation of a fresh downtrend in the short term.
By Julian Pineda, CFA - Market Analyst

AUD/JPY Bearish Pennant Breakout and 500+ Pips TargetAUD/JPY represents the Australian Dollar against the Japanese Yen in the forex market. The current price is 96.800, with a target price of 86.000, indicating a strong bearish outlook. The expected price drop suggests a potential gain of 500+ pips if the trade moves as predicted. The analysis is based on the bearish pennant pattern, a continuation pattern signaling potential further downside. The price is currently consolidating within the pennant, awaiting a breakout. A bearish breakout would confirm strong selling pressure, leading to a sharp decline. Traders anticipate a drop toward the 86.000 level once the breakout occurs. This setup aligns with technical analysis, where pennants often lead to significant price movements. If the breakout is confirmed, momentum could accelerate the decline. Risk management is crucial, as false breakouts can occur.

Actionable Nasdaq insights: 29-Jan-2025Rise and shine, traders! Start your day with actionable Nasdaq insights. Let's grow your skills together, one chart at a time.

Nas100 - 15 min ( Buy Scalping after Retest Tp Range 300 PIP ) In the current market analysis of the NAS100 via FXCM, a pivotal bearish sentiment is observed following a retest of the key level in the 21400 area, accompanied by heightened trading volume. The analysis conducted emphasizes the significance of this threshold, denoting it as an optimal point for potential market entry. Our focus remains on delivering precise opportunities and insights rather than relying solely on quantitative metrics.
⚡️Nas100 / FXCM
Best Break Our / Key level's 15m Tf
🚨Bearish After Retest key level + High Volume / 21400 Area
⚡️ We Only Sent Most Accurate Opportunity and Analysis 💲 Not by Number ..+

"US100 / US Tech / NASDAQ" Index Market Heist Plan🌟Hi! Hola! Ola! Bonjour! Hallo!🌟
Dear Money Makers & Robbers, 🤑 💰
Based on 🔥Thief Trading style technical and fundamental analysis🔥, here is our master plan to heist the "US100 / US Tech / NASDAQ" Index Metal market. Please adhere to the strategy I've outlined in the chart, which emphasizes long entry. Our aim is the high-risk Red Zone. Risky level, overbought market, consolidation, trend reversal, trap at the level where traders and bearish robbers are stronger. Be wealthy and safe trade.💪🏆🎉
Entry 📈 :Traders & Thieves with New Entry A bull trade can be initiated on the MA level breakout of 21,300.00
Stop Loss 🛑: Using the 3H period, the recent / nearest low or high level.
Goal 🎯: 22,400.00 (or) Escape Before the Target
Scalpers, take note 👀 : only scalp on the Long side. If you have a lot of money, you can go straight away; if not, you can join swing traders and carry out the robbery plan. Use trailing SL to safeguard your money 💰.
📰🗞️Fundamental, Macro, Sentimental Outlook:
The (US100 / US Tech / NASDAQ) market is expected to move in a bullish direction, driven by several key factors.
🟡Macroeconomic Factors:
Interest Rates: The Federal Reserve's dovish stance on interest rates is expected to support the US stock market.
Economic Growth: The US economy is expected to continue growing, albeit at a slower pace, supporting the stock market.
Inflation: Low inflation levels are expected to support the stock market, as they allow for accommodative monetary policy.
🟢Fundamental Factors:
Earnings Growth: Strong earnings growth from major tech companies, such as Apple and Microsoft, is expected to support the NASDAQ100.
Valuations: The NASDAQ100 is trading at a relatively high valuation, but strong earnings growth and low interest rates are expected to support the index.
Sector Rotation: The rotation into growth sectors, such as tech and healthcare, is expected to support the NASDAQ100.
🔵Trader/Market Sentimental Analysis:
Trader Sentiment: The CoT report shows that speculative traders are net long the NASDAQ100, indicating a bullish sentiment.
Market Sentiment: The market sentiment is bullish, with many analysts expecting the NASDAQ100 to continue its uptrend.
Technical Analysis: The technical analysis shows that the NASDAQ100 is in an uptrend, with a bullish breakout above the 13,000 level.
🟣Sentimental Outlook:
Bullish Sentiment: 65%
Bearish Sentiment: 20%
Neutral Sentiment: 15%
🟤Trader and Market Sentiment:
- 55% of institutional traders are long on the NASDAQ 100 index, indicating a bullish sentiment.
- Retail traders are also optimistic, with 60% of traders holding a long position on the index.
⚠️Trading Alert : News Releases and Position Management 📰 🗞️ 🚫🚏
As a reminder, news releases can have a significant impact on market prices and volatility. To minimize potential losses and protect your running positions,
we recommend the following:
Avoid taking new trades during news releases
Use trailing stop-loss orders to protect your running positions and lock in profits
📌Please note that this is a general analysis and not personalized investment advice. It's essential to consider your own risk tolerance and market analysis before making any investment decisions.
📌Keep in mind that these factors can change rapidly, and it's essential to stay up-to-date with market developments and adjust your analysis accordingly.
💖Supporting our robbery plan will enable us to effortlessly make and steal money 💰💵 Tell your friends, Colleagues and family to follow, like, and share. Boost the strength of our robbery team. Every day in this market make money with ease by using the Thief Trading Style.🏆💪🤝❤️🎉🚀
I'll see you soon with another heist plan, so stay tuned 🫂

Nas100 - 15 min ( Buy Scalping After Break The NAS100 index, as analyzed through FXCM's platform, indicates a bullish trend following a breakout at the key level of 21180, accompanied by significant trading volume. This analysis highlights the most precise opportunities available, emphasizing the importance of strategic insights over mere numerical data. Traders are encouraged to consider these findings in their decision-making processes to capitalize on favorable market conditions.
⚡️Nas100 / FXCM
Best Break Our / Key level's 15m Tf
🚨Bullish After Break key level + High Volume / 21180 Area
⚡️ We Only Sent Most Accurate Opportunity and Analysis 💲 Not by Number ..+

Nasdaq market analysis: 28-Jan-2025Good morning, traders! Welcome to today's Nasdaq market analysis. Compare my price action insights with your own charts and enhance your trading skills.

Nasdaq US100: Positioned for a Breakout to New Highs!After a deep retrace on the daily timeframe, I’ve initiated a long position on the Nasdaq US100. The plan is to ride this wave back to its Higher High, capitalizing on the recovery momentum.
Technical Insight:
• Key Structure: The market has shown strong respect for the current retracement levels, providing a solid base for a bounce.
• Trendline Support: Price action aligns well with the trendline channel, indicating potential for upward continuation.
• Fib Levels: The pullback reached a critical zone, signaling that buyers may step in to push the price higher.
Let’s see how this plays out! Always remember to trade with proper risk management and pay yourself along the way!
Note: Please remember to adjust this trade idea according to your individual trading conditions, including position size, broker-specific price variations, and any relevant external factors. Every trader’s situation is unique, so it’s crucial to tailor your approach to your own risk tolerance and market environment.

Bearish Shift in NAS100: What’s Next for the US100 Trend?👀 👉 In this video, we take an in-depth look at the NAS100, analyzing its trend, market structure, price action, key support and resistance zones, and how liquidity is influencing the market. Currently, the US100 is approaching an important support level following a bearish market structure shift. We discuss possible strategies if the trend continues. All the details are covered here. Please note, this is not financial advice.

NAS100 I Bullish Bounce Off Based on the H4 chart, the price is approaching our buy entry level at 21,359.42, which aligns with a key support level that aligns close to the 50% Fibonacci retracement. This level is expected to act as a potential reversal point in the bullish setup.
Our take profit is set at 21,738.52, near the previous resistance zone, a key level where price may encounter selling pressure.
The stop loss is placed at 21,000.94, below the 61.8% Fibonacci retracement and a recent swing low, providing room for price fluctuations while ensuring the bullish setup remains valid.
High Risk Investment Warning
Trading Forex/CFDs on margin carries a high level of risk and may not be suitable for all investors. Leverage can work against you.
Stratos Markets Limited (fxcm.com/uk):
CFDs are complex instruments and come with a high risk of losing money rapidly due to leverage. 63% of retail investor accounts lose money when trading CFDs with this provider. You should consider whether you understand how CFDs work and whether you can afford to take the high risk of losing your money.
Stratos Europe Ltd (fxcm.com/eu):
CFDs are complex instruments and come with a high risk of losing money rapidly due to leverage. 63% of retail investor accounts lose money when trading CFDs with this provider. You should consider whether you understand how CFDs work and whether you can afford to take the high risk of losing your money.
Stratos Trading Pty. Limited (fxcm.com/au):
Trading FX/CFDs carries significant risks. FXCM AU (AFSL 309763), please read the Financial Services Guide, Product Disclosure Statement, Target Market Determination and Terms of Business at fxcm.com/au
Stratos Global LLC (fxcm.com/markets):
Losses can exceed deposits.
Please be advised that the information presented on TradingView is provided to FXCM (‘Company’, ‘we’) by a third-party provider (‘TFA Global Pte Ltd’). Please be reminded that you are solely responsible for the trading decisions on your account. There is a very high degree of risk involved in trading. Any information and/or content is intended entirely for research, educational and informational purposes only and does not constitute investment or consultation advice or investment strategy. The information is not tailored to the investment needs of any specific person and therefore does not involve a consideration of any of the investment objectives, financial situation or needs of any viewer that may receive it. Kindly also note that past performance is not a reliable indicator of future results. Actual results may differ materially from those anticipated in forward-looking or past performance statements. We assume no liability as to the accuracy or completeness of any of the information and/or content provided herein and the Company cannot be held responsible for any omission, mistake nor for any loss or damage including without limitation to any loss of profit which may arise from reliance on any information supplied by TFA Global Pte Ltd.
The speaker(s) is neither an employee, agent nor representative of FXCM and is therefore acting independently. The opinions given are their own, constitute general market commentary, and do not constitute the opinion or advice of FXCM or any form of personal or investment advice. FXCM neither endorses nor guarantees offerings of third-party speakers, nor is FXCM responsible for the content, veracity or opinions of third-party speakers, presenters or participants.

Nasdaq Trading for the last January 25.01.27Hello, this is Greedy All-Day.
Today’s analysis focuses on the NASDAQ.
Friday’s NASDAQ Briefing Results
Chart:
On Friday, the NASDAQ broke above the purple box resistance trendline but failed to break through the next major resistance zone at 22093.5–22111.25.
After the ascending trendline broke, the sell entry zone at 21854.25 was triggered. Although there was a brief rebound before the U.S. session closed, the price eventually dropped further on Monday.
Currently, the price has fallen approximately 300 points from the entry, yielding a profit of around $6,000 per contract.
Detailed Analysis of Friday’s Patterns
Chart:
One key point to note from Friday’s briefing was that the upward pattern was forming a pennant.
When the black box supply zone broke, the chart showed signs of consolidation, as seen with the light blue trendlines.
This consolidation involved higher lows and lower highs, but the breakout signal came from the red box.
However, the breakout attempt failed after the price couldn’t break through the green box.
If the green box had been broken, the pattern would have shifted from a pennant to an ascending triangle, signaling stronger bullish momentum.
Instead, the failure to break out suggests that the pennant formation remains valid.
Also, considering the timing, the breakout attempt coincided with a scheduled economic indicator release, which is why setting a break-even stop-loss would have been the prudent choice.
Economic data releases often disrupt natural chart trends with sudden bursts of trading volume, which is why it’s generally recommended to avoid trading immediately before or after such events.
Trading Within Trend Breaks
Chart:
Using the red box as an example:
Let’s say you entered after the red box breakout 15 minutes before the economic release, even though it wasn’t an ideal entry.
Stop-Loss Strategy: A break-even stop-loss should be applied to protect against volatility during the announcement.
First Stop: If the price falls below your entry level, it’s the first signal to exit the trade.
Second Stop: If the price breaks below the blue box, you must exit because the ascending trendline is broken, invalidating the uptrend.
Stop-loss levels are challenging to specify as fixed numbers because they depend on time and price movement. For trend trading, entry and exit decisions must be adaptive and based on real-time conditions.
Daily Chart Analysis
Chart:
The daily chart shows:
A significant bearish candle following a break of the short-term ascending trendline and the major support level.
A gap-down open, with the price now inside the Ichimoku Cloud.
The current price is testing support near the daily 20 EMA.
Potential Scenarios:
Upside: There’s a slight chance for a gap-filling rebound.
Downside:
A retest of the red box support zone near 21308.
Support at the 60 EMA or Ichimoku Cloud bottom near 21220.
Further major support levels are 21006 and 20694.
Weekly Chart Analysis
Chart:
Last week’s bearish weekly candle completely engulfed the previous week’s body.
The remaining lower wick reaches down to around 21377.75.
Current Market Momentum
Chart:
The NASDAQ is currently in a steep, almost vertical downtrend.
This movement makes it essential to remain cautious:
Entering short positions at this stage carries the risk of a rebound to fill the gap.
Entering long positions could result in further losses if the trend continues downward.
Since most entry points have already been invalidated, it’s best to stay on the sidelines for now.
Conclusion
With Asian markets observing holidays next week (Korea from Monday, China from Tuesday, and Hong Kong from Wednesday), trading volumes are expected to decrease.
Given the current market conditions, taking a step back and avoiding unnecessary trades might be the wisest approach.
Unless significant news impacts the market, there’s a possibility of the session closing with some recovery.
Thank you for your hard work this week, and let’s finish strong. See you in the next briefing! 🚀

27-31 Jan NAS100 expectations.
expecting NAS100 to break the supply zone this week. expecting a retracement first then for the supply zone to fail. price is currently in the premium zone of the daily dealing range which means we may retrace first before breaking the supply zone but i will be looking for buys unless price retraces to a demand zone then i will catch shorts down to the demand zones.

Buy or Sell? Read the caption. I told you...Hello guys
We came with NAS100 analysis.
Due to the heavy selling that has happened now, we need to maintain the defined twin bottom range to maintain the upward trend.
Otherwise, the drop will continue up to the specified limits.
Now, if the price is supported, you can see its growth up to the specified areas.
*Trade safely with us*

#NAS100USD 4HNAS100USD (4H Timeframe) Analysis
Market Structure:
The price has formed a sell engulfing candlestick pattern in a key resistance area, indicating increased selling pressure. This bearish reversal pattern suggests that sellers are gaining control, and the price may start moving lower from this area.
Forecast:
A sell opportunity is expected as the sell engulfing pattern signals a potential bearish reversal. The price is likely to target nearby support levels if the selling momentum continues.
Key Levels to Watch:
- Entry Zone: Near the sell engulfing area after confirmation of continued bearish pressure.
- Risk Management:
- Stop Loss: Placed above the high of the sell engulfing candlestick to manage risk.
- Take Profit: Target significant support levels below for potential downside movement.
Market Sentiment:
The sell engulfing candlestick pattern reflects bearish sentiment, suggesting a potential reversal from the current resistance area. Proper confirmation is recommended before entering the trade to align with market momentum.

Good luck with Nasdaq on Friday 25.01.24Hello, this is Greedy All-Day.
Today’s analysis focuses on the NASDAQ.
Breakout Analysis
Chart:
The ascending trendline broke shortly after the Asian session ended and just before the European session began.
Buy Perspective: None.
Sell Perspective: Although the trendline broke, the current market conditions suggest a need for a different interpretation.
At this point, as the entry and stop-loss levels are near breakeven, it’s advisable to exit and observe further movements.
Net Result: Zero profit for both buy and sell positions.
Daily Chart Analysis
Chart:
The daily chart shows the NASDAQ tested the support at the orange supply zone and closed as a bullish candle on 25.01.23.
Key Observations:
The next resistance zone is the green box, above the blue box supply zone.
A breakout attempt on 25.01.22 failed at 22093.5, which is just below the previous high at 22111.25 from 24.12.26.
The daily chart from 25.01.23 indicates a tightening range with higher lows and lower highs. However, no clear directional breakout has occurred yet.
Current Movement
Chart:
The current price action suggests a pennant formation after the breakout above the red box.
The breakout direction will determine the next major move.
Until then, observing the market from the sidelines appears to be the safest approach.
Trading Strategy
Buy Strategy
Entry 1: Breakout above the purple box & red resistance trendline.
Entry 2: Breakout above the green box high at 22111.25.
Additional Notes:
If the pattern breaks upward and surpasses the purple box, the first resistance is 22093.5, with the major resistance at 22111.25.
While resistance near the major zone could result in pullbacks, a strong upward momentum is possible, particularly as past breakouts have led to sharp rallies.
Reference Chart:
Sell Strategy
Entry: Break below the ascending trendline and 21854.50.
Additional Notes:
Despite occasional breakdowns of the ascending trendline, the market has frequently rebounded afterward.
The primary bearish argument is the failure to break through major resistance.
For a more conservative approach, enter short positions only if the support at 21854.5 (the daily support from 25.01.23) fails.
Reference Chart:
Conclusion
The Asian markets will observe a week-long holiday starting next week:
Korea: Closed from Monday.
China: Closed from Tuesday.
Hong Kong: Closed from Wednesday.
This will likely result in reduced trading volume.
With no major news today, the probability of a bearish reversal seems low.
If no significant catalysts emerge, there’s a chance the market will push higher by the close of the session.
Great work this week! Let’s finish strong. Fighting! 🚀

Nasdaq trading insights: 24-Jan-2025Nasdaq trading insights: Not signals, but informative zones to aid your decision-making. Please note: These zones are not trading advice. Use them as a starting point for your own analysis.

Bizarre NASDAQ Movements 25.01.23Hello, this is Greedy All-Day.
Today’s analysis focuses on the NASDAQ.
Wednesday’s Analysis Results
Chart:
Buy Perspective:
No buy signals were provided.
Sell Perspective:
The first signal for a sell was the break below the ascending trendline, as mentioned earlier.
After the Asian session ended on 25.01.23, the ascending trendline was broken, triggering a sell.
The price dropped by approximately 71 points after the breakdown, yielding a $1,400 profit per contract.
Following Up on Yesterday’s Setup
Chart:
The rising wedge pattern did not fully complete. Instead, the NASDAQ created a new trend in the red box, pushing even higher than the previous pattern.
It eventually re-entered the pattern but has not yet confirmed a full breakout.
A more conservative trading approach would be to wait for a break below the blue zone to confirm a trend reversal.
NASDAQ on the 4-Hour Chart
Chart:
As previously noted, the NASDAQ broke above the upper boundary of the orange box, rallying to 22093 (near the next supply zone’s upper boundary) before a pullback began.
The uptrend remains intact for now.
However, there are some red flags:
The NASDAQ’s momentum appears to weaken, as corrections are becoming more prominent during the end of the U.S. session and in the Asian + European sessions.
Daily Chart Analysis
Chart:
On the daily chart, the current candle is an inside bar following three consecutive bullish candles.
Key Levels:
Resistance: ~22000
Support: ~21806
How today’s daily candle closes will likely play a critical role in determining the market direction for the rest of the week.
Today’s Trading Strategy
Chart:
Buy Recommendation:
None.
Reason:
The price has risen significantly, and it seems prudent to observe the market for now.
While the uptrend is still intact and the price could continue higher without offering clear entries (as seen yesterday), preserving your capital is just as important as making profits.
Sell Recommendation:
Entry: Upon breaking below the orange ascending trendline.
Reason:
Breaking this key trendline could signal a major shift in the market structure.
If this happens, it’s unclear whether the price will test the purple resistance trendline or if a full trend reversal will occur.
Regardless, entering a sell near the highs offers a favorable risk-reward opportunity.
Conclusion
The NASDAQ has displayed strong upward momentum but also signs of weakening, especially in the non-U.S. sessions.
For buyers: Observe from the sidelines and avoid chasing the price.
For sellers: Look for a trendline breakdown to enter positions near the highs, as this could signal the start of a broader reversal.
Stay disciplined and focused. 🚀
