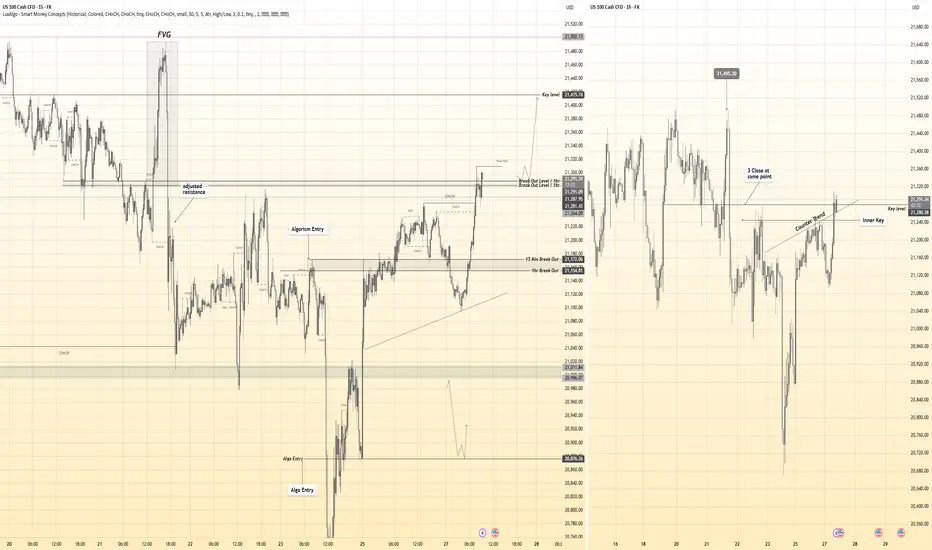
Hanzo / Nas100 15m Path ( Confirmed Bullish Breakout )🆚 Nas100
The Path of Precision – Hanzo’s Market tactics
🔥 Key Levels & Breakout Strategy – 15M TF
☄️ Bullish Setup After Break Out – 21290 Zone ( Break Out Done )
Price must break liquidity with high volume to confirm the move.
🩸 15M Time Frame Confluence
————
CHoCH & Liquidity Grab @ 21300
Key Level / Equal lows Formation - 21000
🔥 1H Time Frame Confirmation
Twin Wicks @ 21250 – Liquidity Engineered
Twin Wicks @ 21150 – Liquidity Engineered
NASDAQ 100 CFD
Nasdaq market analysis: 27-May-2025Good morning, traders! Welcome to today's Nasdaq market analysis. Compare my price action insights with your own charts and enhance your trading skills.

Nasdaq-100 H1 | Swing-low support at 61.8% Fibonacci retracementNasdaq-100 (NAS100) is falling towards a swing-low support and could potentially bounce off this level to climb higher.
Buy entry is at 20,877.40 which is a swing-low support that aligns with the 61.8% Fibonacci retracement.
Stop loss is at 20,640.00 which is a level that lies underneath a swing-low support.
Take profit is at 21,243.05 which is a multi-swing-high resistance.
High Risk Investment Warning
Trading Forex/CFDs on margin carries a high level of risk and may not be suitable for all investors. Leverage can work against you.
Stratos Markets Limited (tradu.com ):
CFDs are complex instruments and come with a high risk of losing money rapidly due to leverage. 63% of retail investor accounts lose money when trading CFDs with this provider. You should consider whether you understand how CFDs work and whether you can afford to take the high risk of losing your money.
Stratos Europe Ltd (tradu.com ):
CFDs are complex instruments and come with a high risk of losing money rapidly due to leverage. 63% of retail investor accounts lose money when trading CFDs with this provider. You should consider whether you understand how CFDs work and whether you can afford to take the high risk of losing your money.
Stratos Global LLC (tradu.com ):
Losses can exceed deposits.
Please be advised that the information presented on TradingView is provided to Tradu (‘Company’, ‘we’) by a third-party provider (‘TFA Global Pte Ltd’). Please be reminded that you are solely responsible for the trading decisions on your account. There is a very high degree of risk involved in trading. Any information and/or content is intended entirely for research, educational and informational purposes only and does not constitute investment or consultation advice or investment strategy. The information is not tailored to the investment needs of any specific person and therefore does not involve a consideration of any of the investment objectives, financial situation or needs of any viewer that may receive it. Kindly also note that past performance is not a reliable indicator of future results. Actual results may differ materially from those anticipated in forward-looking or past performance statements. We assume no liability as to the accuracy or completeness of any of the information and/or content provided herein and the Company cannot be held responsible for any omission, mistake nor for any loss or damage including without limitation to any loss of profit which may arise from reliance on any information supplied by TFA Global Pte Ltd.
The speaker(s) is neither an employee, agent nor representative of Tradu and is therefore acting independently. The opinions given are their own, constitute general market commentary, and do not constitute the opinion or advice of Tradu or any form of personal or investment advice. Tradu neither endorses nor guarantees offerings of third-party speakers, nor is Tradu responsible for the content, veracity or opinions of third-party speakers, presenters or participants.

NAS100 Will Go Down! Sell!
Please, check our technical outlook for NAS100.
Time Frame: 12h
Current Trend: Bearish
Sentiment: Overbought (based on 7-period RSI)
Forecast: Bearish
The price is testing a key resistance 21,208.3.
Taking into consideration the current market trend & overbought RSI, chances will be high to see a bearish movement to the downside at least to 19,875.4 level.
P.S
We determine oversold/overbought condition with RSI indicator.
When it drops below 30 - the market is considered to be oversold.
When it bounces above 70 - the market is considered to be overbought.
Disclosure: I am part of Trade Nation's Influencer program and receive a monthly fee for using their TradingView charts in my analysis.
Like and subscribe and comment my ideas if you enjoy them!

NASDAQ 100 Setup After Bearish Pullback. My Bullish Game Plan!🚀 NASDAQ US100 Update – Key Levels I'm Watching 💡📈
Looking at the NAS100 right now, we’ve seen a strong rally kick off after the weekend 📊🔥 — this comes on the back of an aggressive bearish pullback last week 📉.
📌 My bias is bullish, but with a condition: I want to see price retrace into the 10-minute fair value gap and hold above the previous low 🧠🔍.
If we get a clean pullback, followed by a continuation with higher highs and higher lows, I’ll be watching closely for the first bullish break after that next pullback — that’s where I’d look to position long 🐂📈.
🛑 Not financial advice.
👇 Drop a comment if you're watching these levels too!

NAS100 - Will the stock market go down?!The index is above the EMA200 and EMA50 on the four-hour timeframe and is trading in its ascending channel. If the ascending channel breaks, expect corrective moves, and if this channel line is maintained, its upward path will be available to the next supply range.
In that range, we can also sell Nasdaq with appropriate risk-reward.
With Donald Trump announcing a 50% tariff on imports from the European Union, trade tensions have once again taken center stage in global economic news, temporarily drawing attention away from more structural issues. However, these new developments have not diminished deeper concerns about the U.S. debt crisis and the federal government’s fiscal policies. Last week, the release of details regarding a new budget bill in Congress—coupled with Moody’s downgrade of the U.S. credit rating—sparked renewed anxiety in the markets about America’s fiscal stability. These concerns have now taken on more complexity amid the intensifying trade conflict.
The bill, which narrowly passed through the House of Representatives, could potentially add up to $4 trillion to the federal debt. This projection triggered a sharp reaction in the U.S. Treasury market, causing long-term bond yields to rise significantly.
Trump’s threat to impose tariffs on European goods—specifically naming iPhones—negatively impacted market sentiment in U.S. equities. Past trade confrontations with China suggest that Trump typically avoids actions that significantly harm the stock market and tends to retreat from hardline positions. Thus, buying the dip might be a sound strategy, though accurately timing entry is crucial.
Pinpointing the right entry time remains difficult, and perhaps the most reliable signal would come directly from Trump himself. With the July 9 deadline for the tariffs approaching and no formal trade agreement in place, the best course for market participants is to remain cautious and watch for any signs of a policy reversal.
Despite persistent worries over budget deficits and rising Treasury yields, Morgan Stanley remains bullish on the outlook for U.S. equities and bonds.
Morgan Stanley projects the following:
• The S&P 500 is expected to reach 6,500 by mid-2026, representing a roughly 10% gain from current levels. Key drivers of this growth include lower interest rates, a weaker dollar, and productivity gains fueled by artificial intelligence.
• The recent spike in the 10-year Treasury yield is considered temporary, with expectations that it will decline to around 3.45% by mid-2026. There is still no strong evidence of a significant outflow of foreign capital from U.S. markets.
Although the upcoming week will be shortened due to the Memorial Day holiday on Monday, a packed economic calendar starting Tuesday is expected to quickly reenergize market activity.
Tuesday will bring the release of durable goods orders for April and the consumer confidence index for May—two data points that could provide clearer insight into domestic demand and household spending trends. On Wednesday afternoon, attention will turn to the minutes from the May FOMC meeting, where investors will search for clues about potential shifts in the Federal Reserve’s tone regarding future rate cuts.
Thursday will be loaded with key economic indicators: weekly jobless claims, the first estimate of Q1 GDP, and existing home sales data. The week will conclude on Friday with the release of the Core PCE Price Index, the Fed’s preferred measure of inflation, which plays a pivotal role in shaping its monetary policy decisions.
Meanwhile, Nvidia is preparing to launch its new AI chip, Blackwell, in the Chinese market at a more affordable price. Based on the Blackwell architecture, the chip will be priced between $6,500 and $8,000—lower than the H20 model, which costs between $10,000 and $12,000.
This price reduction results from simpler technical specifications and a lower-cost manufacturing process. The new chip uses GDDR7 memory instead of high-bandwidth memory and lacks the advanced CoWoS packaging technology.
Nasdaq trading insights: 26-May-2025Nasdaq trading insights: Not signals, but informative zones to aid your decision-making. Please note: These zones are not trading advice. Use them as a starting point for your own analysis.

NAS100 (BOS 1H + SUPPLY + OTE)Hello traders!
Now reaction from 705 fib level, Supply = OB 4H. But we can expect mitigation supply and confirmation on LTF. We have BOS on 1H.
Target: till 0.5 global fib level.
P.S: We have also on top OB 2H + OTE
Have a profitable day and don't forget to subscribe for more updates!
If you like this idea drop a like, leave a comment.

2025.05.25 nasdaq weekend analysis📊 Friday Market Recap & Analysis
As previously mentioned, the trend had shifted downward, and I advised against taking long positions—short bias only.
Although the uptrend line was broken twice, one break was a fakeout and the price pulled back up.
Eventually, the red box support zone was broken, and the target was hit with a max drop of $363, resulting in a profit of around $7,260 per contract.
A rebound occurred as the US market opened, but a short-term trendline break at the close suggests Monday's market may lean downward—unless strong positive news emerges over the weekend.
🕰 Weekly Chart View (NASDAQ)
The weekly candle closed just slightly above the previous high, but not significantly—likely meaningless.
The 20-week MA is currently at 20,272.
If the NASDAQ breaks the recent low, there’s a high chance it could drop down to the 20-week MA + top of the Ichimoku Cloud.
📅 Daily Chart View (NASDAQ)
Buying pressure hasn’t fully disappeared yet—NASDAQ is still sitting above the 20-day MA, meaning the trend could revive.
However, if the 20-day MA (around 20,647) is broken, the price may fall into the orange box supply zone.
Historically, we’ve seen a box range movement between 20,400–19,300, so a break of the 20-day MA could lead to a repeat.
For long re-entry, the purple box zone (19,300–18,980) is a strong support area to watch.
✅ Conclusion
・Unless major news comes out over the weekend, Monday’s market will likely retest the 20-day MA.
・If that level breaks, the next drop could be around $1,000, which is significant.
・As always—wait patiently and take the trade when the market gives it to you.

#NQ1! "E-Mini Nasdaq 100" Index Market Bullish Robbery Plan 🌟Hi! Hola! Ola! Bonjour! Hallo! Marhaba!🌟
Dear Money Makers & Robbers, 🤑 💰💸✈️
Based on 🔥Thief Trading style technical and fundamental analysis🔥, here is our master plan to heist the NQ1! "E-Mini Nasdaq 100" Index Market Heist. Please adhere to the strategy I've outlined in the chart, which emphasizes long entry. Our aim is to escape near the high-risk YELLOW MA Zone. It's a Risky level, overbought market, consolidation, trend reversal, trap at the level where traders and bearish robbers are stronger. 🏆💸"Take profit and treat yourself, traders. You deserve it!💪🏆🎉
Entry 📈 : "The heist is on! Wait for the Crossing previous high (19800) then make your move - Bullish profits await!"
however I advise to Place Buy stop orders above the Moving average (or) Place buy limit orders within a 15 or 30 minute timeframe most recent or swing, low or high level for Pullback entries.
📌I strongly advise you to set an "alert (Alarm)" on your chart so you can see when the breakout entry occurs.
Stop Loss 🛑: "🔊 Yo, listen up! 🗣️ If you're lookin' to get in on a buy stop order, don't even think about settin' that stop loss till after the breakout 🚀. You feel me? Now, if you're smart, you'll place that stop loss where I told you to 📍, but if you're a rebel, you can put it wherever you like 🤪 - just don't say I didn't warn you ⚠️. You're playin' with fire 🔥, and it's your risk, not mine 👊."
📍 Thief SL placed at the nearest/swing low level Using the 2H timeframe (19200) Day trade basis.
📍 SL is based on your risk of the trade, lot size and how many multiple orders you have to take.
🏴☠️Target 🎯: 20500
🧲Scalpers, take note 👀 : only scalp on the Long side. If you have a lot of money, you can go straight away; if not, you can join swing traders and carry out the robbery plan. Use trailing SL to safeguard your money 💰.
💰💵💸NQ1! "E-Mini Nasdaq 100" Index Money Heist Plan is currently experiencing a bullishness,., driven by several key factors. .☝☝☝
📰🗞️Get & Read the Fundamental, Macro Economics, COT Report, Geopolitical and News Analysis, Sentimental Outlook, Intermarket Analysis, Index-Specific Analysis, Future trend targets with Overall outlook score... go ahead to check 👉👉👉🔗🔗🌎🌏🗺
⚠️Trading Alert : News Releases and Position Management 📰🗞️🚫🚏
As a reminder, news releases can have a significant impact on market prices and volatility. To minimize potential losses and protect your running positions,
we recommend the following:
Avoid taking new trades during news releases
Use trailing stop-loss orders to protect your running positions and lock in profits
💖Supporting our robbery plan 💥Hit the Boost Button💥 will enable us to effortlessly make and steal money 💰💵. Boost the strength of our robbery team. Every day in this market make money with ease by using the Thief Trading Style.🏆💪🤝❤️🎉🚀
I'll see you soon with another heist plan, so stay tuned 🤑🐱👤🤗🤩

205.05.23 nasdaq analysis
📊 Result of Yesterday’s Trading Strategy
The break of the upward support trendline triggered a sharp drop, delivering solid profits even before the U.S. session opened.
With 1 contract, this setup yielded approximately $2,000 profit, making for an early finish to the day.
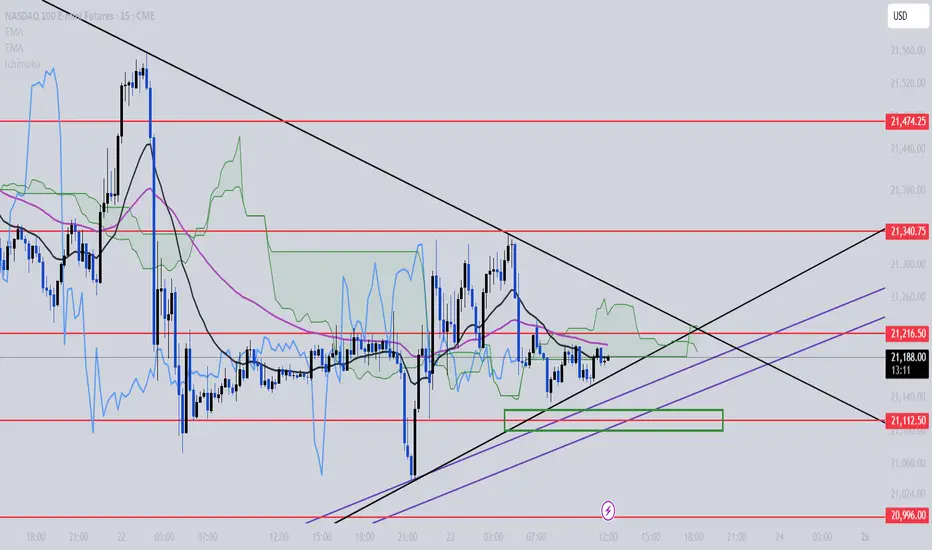
📉 Current NASDAQ Situation
The Nasdaq is on the verge of breaking below the ascending trendline.
Even though it pretends to rise, it consistently gets pushed down — suggesting the bullish momentum is close to being exhausted.
Thus, I will not consider long positions today and will continue to approach the market conservatively.
Today's trading strategy:
If 21112 is broken downward, it will likely enter a corrective phase.
If that happens, I plan to continue shorting with targets down to 20827~20667.
🎯 The target range is wide because if a sharp drop does occur, the strength behind it may lead to a deeper correction, making it worth holding for the extended target.
✅ Conclusion
• It's better to focus on short strategies rather than long positions for now.
• To enjoy the weekend, taking the day off from trading might also be a smart move today.
Hanzo / Nas100 15m Path ( Confirmed Breakout Zones )🆚 Nas100
The Path of Precision – Hanzo’s Market Strike
🔥 Key Levels & Breakout Strategy – 15M TF
☄️ Bearish Setup After Break Out – 21030 Zone
Price must break liquidity with high volume to confirm the move.
☄️ Bullish Setup After Break Out – 21215 Zone
Price must break liquidity with high volume to confirm the move.
🩸 15M Time Frame Confluence
————
CHoCH & Liquidity Grab @ 21000
Key Level / Equal lows Formation - 21050
Strong Rejection from 21210 – The Ultimate Pivot
Strong Rejection from 21100 – The Ultimate Pivot
🔥 1H Time Frame Confirmation
Twin Wicks @ 21200 – Liquidity Engineered
Twin Wicks @ 21050 – Liquidity Engineered
👌 The Market Has Spoken – Are You Ready to Strike?
Hanzo / Nas100 15m Path ( Confirmed Breakout Zones )

Nasdaq-100 H1 | Potential bounce off a pullback supportNasdaq-100 (NAS100) is falling towards a pullback support and could potentially bounce off this level to climb higher.
Buy entry is at 20,898.76 which is a pullback support.
Stop loss is at 20,500.00 which is a level that lies underneath a swing-low support and the 50.0% Fibonacci retracement.
Take profit is at 21,471.38 which is a multi-swing-high resistance.
High Risk Investment Warning
Trading Forex/CFDs on margin carries a high level of risk and may not be suitable for all investors. Leverage can work against you.
Stratos Markets Limited (tradu.com):
CFDs are complex instruments and come with a high risk of losing money rapidly due to leverage. 63% of retail investor accounts lose money when trading CFDs with this provider. You should consider whether you understand how CFDs work and whether you can afford to take the high risk of losing your money.
Stratos Europe Ltd (tradu.com):
CFDs are complex instruments and come with a high risk of losing money rapidly due to leverage. 63% of retail investor accounts lose money when trading CFDs with this provider. You should consider whether you understand how CFDs work and whether you can afford to take the high risk of losing your money.
Stratos Global LLC (tradu.com):
Losses can exceed deposits.
Please be advised that the information presented on TradingView is provided to Tradu (‘Company’, ‘we’) by a third-party provider (‘TFA Global Pte Ltd’). Please be reminded that you are solely responsible for the trading decisions on your account. There is a very high degree of risk involved in trading. Any information and/or content is intended entirely for research, educational and informational purposes only and does not constitute investment or consultation advice or investment strategy. The information is not tailored to the investment needs of any specific person and therefore does not involve a consideration of any of the investment objectives, financial situation or needs of any viewer that may receive it. Kindly also note that past performance is not a reliable indicator of future results. Actual results may differ materially from those anticipated in forward-looking or past performance statements. We assume no liability as to the accuracy or completeness of any of the information and/or content provided herein and the Company cannot be held responsible for any omission, mistake nor for any loss or damage including without limitation to any loss of profit which may arise from reliance on any information supplied by TFA Global Pte Ltd.
The speaker(s) is neither an employee, agent nor representative of Tradu and is therefore acting independently. The opinions given are their own, constitute general market commentary, and do not constitute the opinion or advice of Tradu or any form of personal or investment advice. Tradu neither endorses nor guarantees offerings of third-party speakers, nor is Tradu responsible for the content, veracity or opinions of third-party speakers, presenters or participants.

2025.05.22 nasdaq analysis🔸 Daily Chart Perspective
On the daily timeframe, we can see that the recent low was made within the demand zone, but the market began to fall just before the U.S. session closed. The Asian session appears to be in wait-and-see mode for now.
If the trend continues downward, the red box to the left suggests the possibility of a one-way bearish move. In such a case, a drop toward the 20583 area is open.
The daily 20EMA is also near that zone, and since a one-way drop occurred in the red box area before, the possibility is quite realistic.
🔸 1-Hour Chart View
On the 1H chart, the Nasdaq seems to be forming an expanding wedge.
It's hard to say that a trend reversal to the downside is confirmed yet, because price is still inside the expanding pattern.
However, since the market seems to have formed a short-term top, it gives us a sense of direction for short-term trading.
If the price enters the black box area to the left, that could be seen as a complete trend reversal.
🔸 Today’s Trading Plan
At this point, due to yesterday's sharp drop, there’s no clear buy zone visible.
Only short positions are planned for today.
Short Setup #1
Entry: On break below 21112
TP 1: 21075
Short Setup #2
Entry: On break below 21070
TP 1: 20996
Short Setup #3
Entry: On break below 20970 + trendline break
TP Max: 20830 ~ 20770
🔹 Conclusion
It looks like the trend is leaning toward the downside, but it's best to enter positions only after price breaks out of key support zones.

Going short on the Nasdaq 100CAPITALCOM:US100
The Nasdaq 100 has moved up impulsively on a 5-wave move over the past 6 weeks, which is very bullish long term. However, in the short term, it is overextended, with the RSI indicator over the 70 level.
I expect it to decline over the next couple of weeks to the area marked in the green rectangle, between the 50% and the 78.6% Fibonacci Retracement level.
I hope you find this interesting.
Good luck to you


Nasdaq’s Next Move Revealed This Week – Don’t Miss the Breakout Following a strong surge at the start of the trading week, the Nasdaq reached a new high since March 26th. At this juncture, I anticipate a potential pullback before any sustained upward movement. My analysis suggests monitoring for a retracement to the New Week Opening Gap (NWOG), where price action will likely provide critical insights. I see two probable scenarios:
1. A move to the NWOG, followed by a strong bounce, potentially targeting a new all-time high, as some market commentators have suggested.
2. A weak reaction at the NWOG, leading to a breakdown below this level, with 16,000 as the next key support target.
This week's price action will be pivotal in determining the Nasdaq's near-term direction. I recommend close observation of these levels and disciplined risk management when positioning for either outcome.


Hanzo / Gold 15m Path ( Confirmed Breakout Zones )Nas100
Bias: Waiting For Break Out
Time Frame: 15 Min
Entry Type: Confirmed Entry After Break Out
👌Bearish After Break Out Done : 21200
☄️ Hanzo Protocol: Dual-Direction Entry Intel
➕ Zone Activated: Strategic Reaction from Refined Liquidity Layer
Marked volatility from a high-precision supply/demand zone. System detects potential for both long and short operations.
🩸 Momentum Signature Detected:
Displacement candle confirms directional intent — AI pattern scan active.
— If upward: Bullish momentum burst.
— If downward: Aggressive bearish rejection.

XAUUSD BULLISH OR BEARISH DETAILED ANALYSISXAUUSD is showing a textbook technical reaction from a well-defined support zone around the 3145–3170 range, which aligns perfectly with previous structure and demand zones. After a sharp retracement from recent highs, gold is now posting a strong bullish bounce, validating this level as a significant area of buyer interest. With today’s push above 3230, this bounce confirms our bullish thesis, and I now expect a continuation move toward the 3500 mark in the coming weeks.
Fundamentally, gold remains one of the most favored assets in 2025 due to ongoing global economic uncertainty, rising geopolitical risks, and persistent central bank demand. With US inflation cooling and the Fed signaling the potential for rate cuts later this year, real yields are slipping, giving gold the macro tailwind it needs to push higher. Moreover, recent data from China shows continued accumulation of gold reserves, reinforcing the long-term bullish case.
Technically, this correction appears to be a healthy retest in a strong uptrend. The market has respected the previous breakout level, and we are seeing early signs of momentum returning. The price action is starting to structure higher lows, and if price clears the 3250 level convincingly, it will likely trigger further momentum-based buying. I’m targeting 3500 as the next major resistance, where we could see some profit-taking.
This setup is one of the cleanest long opportunities on the board. With institutional positioning still net long, and technical and macro alignment pointing higher, I see this as a high-conviction trade. As long as price holds above 3145, the path of least resistance remains up. I’ll be closely watching for further confirmation as we build toward the 3500 target.

Nasdaq-100 H1 | Pullback support at 23.6% Fibonacci retracementNasdaq-100 (NAS100) is falling towards a pullback support and could potentially bounce off this level to climb higher.
Buy entry is at 20,898.76 which is a pullback support that aligns with the 23.6% Fibonacci retracement.
Stop loss is at 20,500.00 which is a level that lies underneath a swing-low support and the 38.2% Fibonacci retracement.
Take profit is at 21,471.38 which is a swing-high resistance.
High Risk Investment Warning
Trading Forex/CFDs on margin carries a high level of risk and may not be suitable for all investors. Leverage can work against you.
Stratos Markets Limited (tradu.com):
CFDs are complex instruments and come with a high risk of losing money rapidly due to leverage. 63% of retail investor accounts lose money when trading CFDs with this provider. You should consider whether you understand how CFDs work and whether you can afford to take the high risk of losing your money.
Stratos Europe Ltd (tradu.com):
CFDs are complex instruments and come with a high risk of losing money rapidly due to leverage. 63% of retail investor accounts lose money when trading CFDs with this provider. You should consider whether you understand how CFDs work and whether you can afford to take the high risk of losing your money.
Stratos Global LLC (tradu.com):
Losses can exceed deposits.
Please be advised that the information presented on TradingView is provided to Tradu (‘Company’, ‘we’) by a third-party provider (‘TFA Global Pte Ltd’). Please be reminded that you are solely responsible for the trading decisions on your account. There is a very high degree of risk involved in trading. Any information and/or content is intended entirely for research, educational and informational purposes only and does not constitute investment or consultation advice or investment strategy. The information is not tailored to the investment needs of any specific person and therefore does not involve a consideration of any of the investment objectives, financial situation or needs of any viewer that may receive it. Kindly also note that past performance is not a reliable indicator of future results. Actual results may differ materially from those anticipated in forward-looking or past performance statements. We assume no liability as to the accuracy or completeness of any of the information and/or content provided herein and the Company cannot be held responsible for any omission, mistake nor for any loss or damage including without limitation to any loss of profit which may arise from reliance on any information supplied by TFA Global Pte Ltd.
The speaker(s) is neither an employee, agent nor representative of Tradu and is therefore acting independently. The opinions given are their own, constitute general market commentary, and do not constitute the opinion or advice of Tradu or any form of personal or investment advice. Tradu neither endorses nor guarantees offerings of third-party speakers, nor is Tradu responsible for the content, veracity or opinions of third-party speakers, presenters or participants.

2025.05.20 nasdaq analysisDuring the European session, NASDAQ maintained a downward trend and broke below the 21187 level, as shown here:
This movement suggested a potential shift toward a bearish direction.
However, after that, NASDAQ started forming an upward trend and moved sideways. Eventually, the resistance trendline was broken in the blue box area, which you can see here:
This breakout indicated a short-term trend reversal.
The moment this trend reversal occurred coincided with the U.S. market open, accompanied by a significant surge in trading volume that led to a strong upward move.
At this point, the U.S. session closed with a new high compared to the previous pattern, suggesting that the trend has turned bullish.
However, based on the corrective action seen during the Asian session, it seems that the Asian market is not fully accepting the upward momentum.
Here is the current NASDAQ pattern:
It shows an expanding pennant pattern, with both the highs and lows widening over time.
As of now, it is highly likely that the market will continue to move with volatility in both directions until a decisive breakout occurs.
You can view the current situation in more detail here:
In terms of the upside, even though the price could theoretically reach 22000, it doesn’t hold much significance without confirmation from historical data.
Therefore, I recommend taking buy positions only if the market shows a strong inflection point similar to yesterday’s move.
Even if the recent low of 21112 is broken, the price is still within the expanding pennant pattern, and a rebound remains possible.
A conservative bearish view would only be valid if the price breaks below the previous consolidation area that formed just before the strong rally—specifically the black box range, which is around 20723–20680.
Summary:
There’s a high probability of stop-hunting in the current range.
Whether buying or selling, it's recommended to enter only when a clear setup is provided.
Don’t rely on hope that the price will return to your average entry. If the market chooses a direction during this phase, it could lead to unrecoverable losses.
This could be a highly profitable zone if handled correctly, but trading without conviction is like a drug.
Today is not the only opportunity.

(NQ) | Strong Buyers and Blue‑Box Entry Zones(NQ) | Strong Buyers and Blue‑Box Entry Zones
NQ shows powerful buying pressure, and the marked blue boxes highlight areas where demand has reliably appeared. For those seeking long exposure, two approaches stand out:
Low‑Time‑Frame Breakouts from the Blue Box
Wait for price to dip into a blue‑boxed support zone and then break higher on shorter time frames. A decisive move with rising footprint volume confirms genuine buyer commitment.
Direct Low‑Time‑Frame Breakouts
If price skips a pullback and powers upward on low‑time‑frame charts, that momentum surge—backed by substantial volume—also provides a valid long entry.
Key Considerations
Ensure any breakout is backed by real volume footprint signals, not just price movement.
If these zones fail to hold or volume dries up, stand aside and await the next confirmed setup.
By focusing on these blue‑boxed areas and insisting on volume‑confirmed breakouts, you align your entries with where buyers truly dominate.
📌I keep my charts clean and simple because I believe clarity leads to better decisions.
📌My approach is built on years of experience and a solid track record. I don’t claim to know it all but I’m confident in my ability to spot high-probability setups.
📌If you would like to learn how to use the heatmap, cumulative volume delta and volume footprint techniques that I use below to determine very accurate demand regions, you can send me a private message. I help anyone who wants it completely free of charge.
🔑I have a long list of my proven technique below:
🎯 ZENUSDT.P: Patience & Profitability | %230 Reaction from the Sniper Entry
🐶 DOGEUSDT.P: Next Move
🎨 RENDERUSDT.P: Opportunity of the Month
💎 ETHUSDT.P: Where to Retrace
🟢 BNBUSDT.P: Potential Surge
📊 BTC Dominance: Reaction Zone
🌊 WAVESUSDT.P: Demand Zone Potential
🟣 UNIUSDT.P: Long-Term Trade
🔵 XRPUSDT.P: Entry Zones
🔗 LINKUSDT.P: Follow The River
📈 BTCUSDT.P: Two Key Demand Zones
🟩 POLUSDT: Bullish Momentum
🌟 PENDLEUSDT.P: Where Opportunity Meets Precision
🔥 BTCUSDT.P: Liquidation of Highly Leveraged Longs
🌊 SOLUSDT.P: SOL's Dip - Your Opportunity
🐸 1000PEPEUSDT.P: Prime Bounce Zone Unlocked
🚀 ETHUSDT.P: Set to Explode - Don't Miss This Game Changer
🤖 IQUSDT: Smart Plan
⚡️ PONDUSDT: A Trade Not Taken Is Better Than a Losing One
💼 STMXUSDT: 2 Buying Areas
🐢 TURBOUSDT: Buy Zones and Buyer Presence
🌍 ICPUSDT.P: Massive Upside Potential | Check the Trade Update For Seeing Results
🟠 IDEXUSDT: Spot Buy Area | %26 Profit if You Trade with MSB
📌 USUALUSDT: Buyers Are Active + %70 Profit in Total
🌟 FORTHUSDT: Sniper Entry +%26 Reaction
🐳 QKCUSDT: Sniper Entry +%57 Reaction
📊 BTC.D: Retest of Key Area Highly Likely
📊 XNOUSDT %80 Reaction with a Simple Blue Box!
📊 BELUSDT Amazing %120 Reaction!
📊 Simple Red Box, Extraordinary Results
I stopped adding to the list because it's kinda tiring to add 5-10 charts in every move but you can check my profile and see that it goes on..
