Is NASDAQ ready to correct for a few days?We have a couple of doji candles on the daily chart forming out of a bearish imbalance range in the relative premium. This is the perfect place to test the lows for stops.
We are still bullish but I am going to go neutral for this forecast in anticipation of a slight correction.
Share this with someone who needs a complete top down analysis of where we are staring this week!
NASDAQ 100 CFD

GBPUSD BULLISH OR BEARISH DETAILED ANALYSISGBPUSD is currently forming a clean bullish pennant pattern on the daily chart after a strong impulsive rally, indicating that the pair is consolidating before its next leg higher. Price is hovering around the 1.3360–1.3380 zone, coiling tightly within the pennant structure, and showing signs of breakout pressure building. This is a classic continuation setup in a trending market, and with volume compression and decreasing volatility, the stage is set for a bullish breakout toward the 1.4070–1.4100 region.
On the fundamental side, the British pound remains relatively supported due to recent hawkish rhetoric from the Bank of England, which is still closely monitoring wage inflation and strong labor market figures. Meanwhile, the US dollar is facing headwinds after softer CPI and PPI readings this month, fueling expectations of Fed rate cuts in the second half of 2025. These macro dynamics are increasingly tilting in favor of sterling strength, as investors begin pricing in yield divergence between the Fed and the BoE.
Technically, the bullish structure is intact and the pennant formation is forming right after a sharp move higher, which adds confluence to this pattern. The breakout zone to watch is 1.3380–1.3400, and if bulls can clear this area with momentum, we are likely to see a swift extension toward the 1.4070 level. The risk is well-contained below 1.3340, offering an excellent reward-to-risk ratio for breakout traders and trend followers.
This setup is not only technically sound but also backed by current macro shifts, making GBPUSD one of the most promising long opportunities right now. The market has been consolidating for weeks, building up energy, and with fundamentals aligning, this breakout could drive a strong move into Q3. I'm eyeing the 1.4070–1.4100 target in the coming weeks, and I'll continue to monitor for confirmation and execution signals.

NAS100 - Will the Stock Market Reach Its Previous High?!The index is trading above the EMA200 and EMA50 on the four-hour timeframe and is trading in its ascending channel. If the trend line is broken, I expect corrective moves, but if the index corrects towards the demand zone, we can look for further buying positions in Nasdaq with a risk-reward ratio. Maintaining this trend line will lead to a continuation of the Nasdaq upward trend.
The strong rally in U.S. equities that had pushed the S&P 500 close to record highs for 2025 came to a halt on Friday, following the release of disappointing consumer sentiment data. A report from the University of Michigan revealed a drop in consumer confidence and a surge in inflation expectations to levels not seen in decades—factors that have amplified concerns about the economy’s outlook.
Despite this, some analysts remain hopeful that robust corporate earnings and the temporary suspension of tariffs could provide needed support for the market. Meanwhile, rating agency Moody’s warned that U.S. federal debt is projected to climb to 134% of GDP by 2035, up from 98% in 2024.
Moody’s noted that while the U.S. economy and financial system remain strong, the weakening of certain fiscal indicators has diminished the ability of these strengths to offset negative effects. According to their analysis, trade tariffs will not significantly impact long-term U.S. economic growth, and substantial changes in mandatory spending are unlikely in the near future.
Although the U.S. credit rating has been downgraded, the country’s long-term domestic and foreign credit ceilings remain at AAA. However, Moody’s has revised the overall credit rating for the U.S. down from AAA to Aa1.
One noteworthy detail is that since April 21, the index has seen only one negative trading day—May 9, which experienced only a slight decline. Falling Treasury yields have reduced some market risks, while Donald Trump’s trip to the Middle East has also helped ease political tensions at home. The market clearly reflects growing investor appetite for risk, though the possibility of a correction at these levels remains real.
Looking ahead to this week, traders will closely monitor preliminary purchasing managers’ index (PMI) data for May on Thursday. They will also pay attention to speeches from several Federal Reserve officials to gauge whether the Fed remains focused on economic growth or has shifted more attention to inflation, especially in light of recent U.S.-China trade agreements.
A rise in PMI figures may suggest that business sentiment has improved since tensions eased between the U.S. and China, but investors are also eager for clear guidance on the Fed’s next policy steps. Key speakers include John Williams (New York Fed), Raphael Bostic (Atlanta Fed), Lorie Logan (Dallas Fed), and Mary Daly (San Francisco Fed). If these officials continue to express concerns about elevated inflation risks, the U.S. dollar could continue to strengthen, as markets may price in fewer rate cuts ahead.
As for the equity markets, their reaction remains uncertain. Recently, equities have risen even as expectations for rate cuts have diminished—primarily due to a reduced fear of recession following tariff adjustments. However, with recession fears now less pronounced and a growing narrative around sustained higher rates due to sticky inflation, Wall Street may pull back if Fed officials emphasize upside inflation risks.
In related news, President Donald Trump harshly criticized Walmart’s pricing strategy, stating that the company should absorb the cost of tariffs rather than passing them onto consumers. In a public statement, Trump pointed out that Walmart made billions in profit last year and argued that American shoppers should not bear the burden of higher prices caused by trade tariffs.
Trump also implicated China in the issue, stating that either Walmart or China should take responsibility for these added costs. He warned that both he and consumers are closely watching how Walmart handles the situation.

NASDAQ Trade Setup: Bullish Bias, But Waiting for Retrace!✅ NASDAQ Breakdown: Waiting for the Retrace 🎯
I'm currently watching the NASDAQ 🧠, and here's what I'm seeing across multiple timeframes:
📈 Daily & 4H Timeframes show a strong bullish rally with significant momentum. However, in my view, price is overextended and currently trading at a premium.
📉 Although my bias remains bullish, I'm anticipating a retracement into equilibrium—specifically around the 50% to 61.8% Fibonacci zone 🔁. This would offer a more favorable entry based on value.
📊 In this video, I walk you through:
- The overall trend direction
- Where and how we can anticipate a break of market structure for a clean entry
- Why my buy idea is conditional on the 30-minute chart trending down, then flipping bullish via a structure break 🔄
⚠️ Patience is key! The trade setup may play out at various price levels—wait for confirmation from price action, as detailed in the video 🎥.

2025.05.19 nasdaq analysis🟧
At the close of Friday's session, the daily and weekly candle closed around 21500.
However, in the final hour after market close, Nasdaq broke below the orange trendline.
Then, at the start of Monday’s session, a sharp gap down occurred.
The gap was briefly filled before Nasdaq retested the broken trendline and continued to fall.
🔗
🕒
Nasdaq hasn't confirmed a downtrend yet.
The key is whether 21187, which has held since May 13th, will break.
If it fails, price may fall below the value area it’s held for a week.
Downside targets if 21187 breaks: 21000, 20765.
🔗
🟩
Bullish scenario isn’t dead—this may be a temporary pullback.
Key entry signal: Break above the 15-min 20 EMA.
Target zones vary by strength:
Conservative TP: 30-min 20 EMA
Aggressive TP: 21415, possibly even 21500 if today’s high is broken
🔗
📌 Conclusion
Monday started with a gap down, but support is still holding.
Break below 21187 = potential trend reversal + end of box-range movement.
Buy trades should be cautious & short-term until confirmation of strength.

WEEKLY reaction to these zones Looking for the weekly order block fvg and LTF BREAKER to make an effort down….hopefully because this week has been bullish non stop

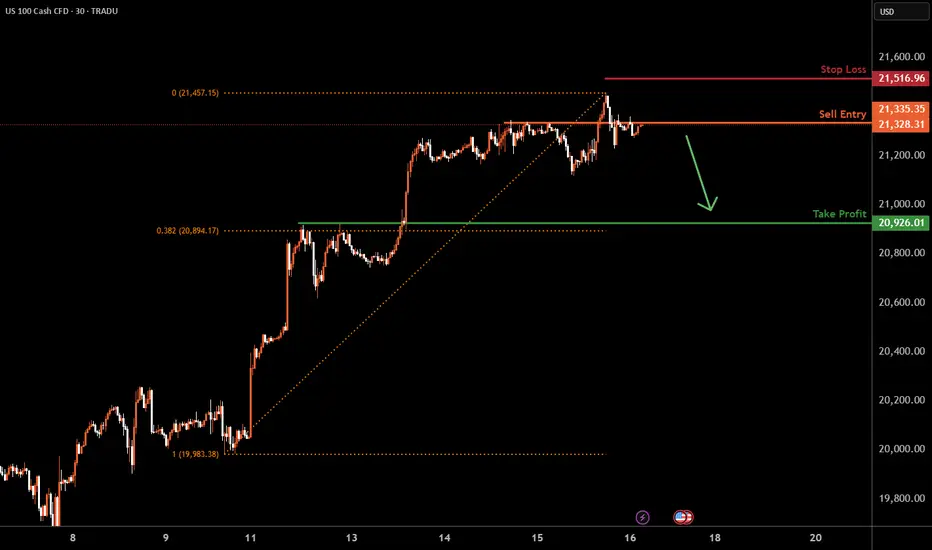
NAS100 I Bearish Drop Based on the H4 chart analysis, we can see that the price is testing our sell entry at 21,335.35, an overlap resistance.
Our take profit will be at 20,926.01, a pullback support that aligns close to the 38.2% Fibo retracement
The stop loss will be placed at 21,516.96, above the swing-high resistance.
High Risk Investment Warning
Trading Forex/CFDs on margin carries a high level of risk and may not be suitable for all investors. Leverage can work against you.
Stratos Markets Limited (tradu.com):
CFDs are complex instruments and come with a high risk of losing money rapidly due to leverage. 63% of retail investor accounts lose money when trading CFDs with this provider. You should consider whether you understand how CFDs work and whether you can afford to take the high risk of losing your money.
Stratos Europe Ltd (tradu.com):
CFDs are complex instruments and come with a high risk of losing money rapidly due to leverage. 63% of retail investor accounts lose money when trading CFDs with this provider. You should consider whether you understand how CFDs work and whether you can afford to take the high risk of losing your money.
Stratos Global LLC (tradu.com):
Losses can exceed deposits.
Please be advised that the information presented on TradingView is provided to Tradu (‘Company’, ‘we’) by a third-party provider (‘TFA Global Pte Ltd’). Please be reminded that you are solely responsible for the trading decisions on your account. There is a very high degree of risk involved in trading. Any information and/or content is intended entirely for research, educational and informational purposes only and does not constitute investment or consultation advice or investment strategy. The information is not tailored to the investment needs of any specific person and therefore does not involve a consideration of any of the investment objectives, financial situation or needs of any viewer that may receive it. Kindly also note that past performance is not a reliable indicator of future results. Actual results may differ materially from those anticipated in forward-looking or past performance statements. We assume no liability as to the accuracy or completeness of any of the information and/or content provided herein and the Company cannot be held responsible for any omission, mistake nor for any loss or damage including without limitation to any loss of profit which may arise from reliance on any information supplied by TFA Global Pte Ltd.
The speaker(s) is neither an employee, agent nor representative of Tradu and is therefore acting independently. The opinions given are their own, constitute general market commentary, and do not constitute the opinion or advice of Tradu or any form of personal or investment advice. Tradu neither endorses nor guarantees offerings of third-party speakers, nor is Tradu responsible for the content, veracity or opinions of third-party speakers, presenters or participants.
2025.05.16 nasdaq analysis
This is the briefing result for Nasdaq as of yesterday.
The briefing began during the yellow box phase.
At that time, I clearly mentioned that the market had entered a short-term correction phase and emphasized the importance of the 21187 support level marked by the red box.
As seen in the chart, the 21187 level was not broken to the downside and instead held as support, followed by a rebound.
This reaffirms the significance of the 21187 level.
Afterward, the trend continued upward.
Looking at the 15-minute chart, there have been consistent lower wicks breaking below support,
which decreases the reliability of a short opportunity simply from a trendline break.
At this point, the trust in a sell-off purely based on trendline breakdown is weakening.
This chart outlines a short-term sell strategy.
As previously mentioned, while the short-term uptrend line has become less reliable,
if we see a break of the trendline and a drop below 21376,
we could expect a pullback toward the blue box area around 21320~21300.
Thus, a short-term short strategy may be valid in this scenario.
From a daily chart perspective, Nasdaq closed with a green candle again,
but the shape of the candle resembles a doji with similar upper and lower wicks.
What we need to focus on here is that Nasdaq has re-entered a high-volume price area (supply zone),
but since no clear direction has formed, many positions seem to be closed off whenever the price pushes higher.
On the downside, since the 21187 support level has held,
this remains the most critical level.
If 21187 is broken downward, it could mark the beginning of a daily-level correction phase.
Conclusion:
No clear direction yet.
While the direction was upward until yesterday, the doji close suggests caution.
For further bullish movement, a confirmed close above the current supply zone is essential.
If the market corrects downward, watch for a break below 21187.
The current price action is forming a channel pattern with higher lows and higher highs.
If traded correctly within this range, good opportunities may arise.

US30 | 15M | BUY ZONEHey There,
After reaching my US30 buy level, my target is 42,481,00
Your likes keep me motivated to share my analyses, and I truly appreciate the support.
Big thanks to everyone showing love

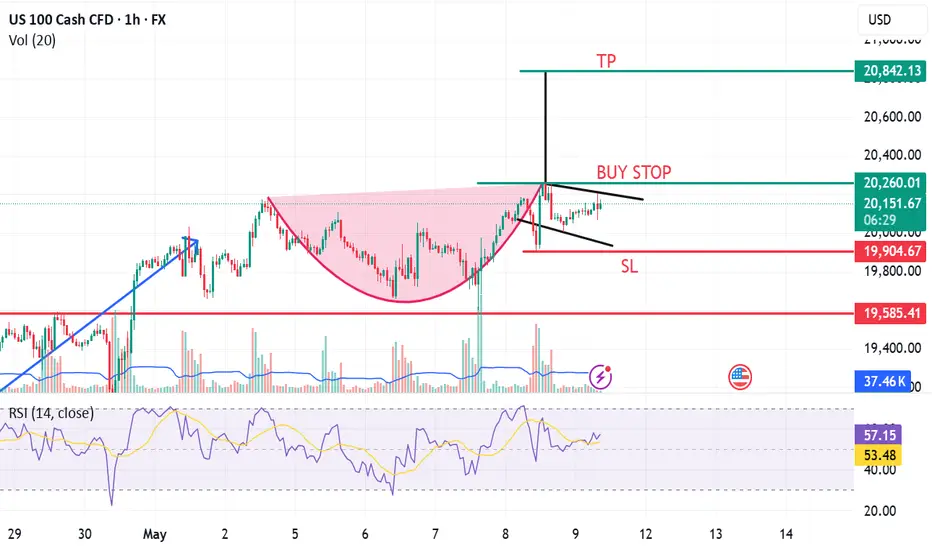
Nasdaq100/Us100 Possible Explosive Up Move About To Happen
Hello everyone! In this idea I have posted a picture of my current setup. I have taken a long positions once the 1 hour candles broke out of and closed beyond this range (Box) My SL is just the other side of this box and I am targeting the ATH on this position.
If another 1 hour box starts to form higher up I will simple add another position and move Stop losses accordingly.
although we have moved back within the range, the buy pressure is squeezing the candles to the top side of this range. This is why I am execting an explosive move. Once sellers are exhuasted it will propell itself to the next key level.
Let me know what you think.
I am not a financial adviser. Trade at your own risk.

NASDAQ US100 Overextended? Waiting for the Pullback🚨 NASDAQ #100# Analysis 🚨
I'm currently watching the NASDAQ (US100) 📊, and in my view, it's looking overextended. Price is now trading into previous daily highs 📈 without showing a meaningful retracement. Historically, when we look back at the chart, we rarely see such strong rallies without some form of pullback 🔄.
A healthy trend typically follows a natural rhythm — rally, retrace, rally or expand, pull back, expand again. In this case, that retracement is missing ❌, which raises caution flags for me 🚩.
🎥 In the video, I break down:
Price action & market structure 🧩
The current trend 📉📈
A potential long opportunity — but only if price pulls back into my point of interest (POI) 🧲 and we then get a bullish break in market structure (BoS) 🟢.
🔒 This is not financial advice. Always do your own research and trade responsibly!

Hanzo : NAS100 15m: Bearish Confirmed After Liquidity Trap Done🔥 NAS100 – 15 Min Scalping Analysis (Bearish Setup)
Bias: Bearish
Time Frame: 15 Min
Entry Type: Confirmed Entry After Liquidity Sweep 21200
🩸 Key Reasons for Entry:
☄️Price manipulated above previous high (liquidity grab trap).
☄️Strong rejection from key supply zone with SMC confluence.
☄️Bearish order block + break of market structure.
☄️Entry respects higher timeframe resistance level.
🔤 Fair value gap / imbalance completed.
🔻Setup aligned with institutional reversal window
Target: Next 15M demand zone / 1:3+ RR
Status: trade active 👌
Nasdaq-100 H4 | Falling toward a pullback supportThe Nasdaq-100 (NAS100) is falling towards a pullback support and could potentially bounce off this level to climb higher.
Buy entry is at 20,336.30 which is a pullback support.
Stop loss is at 19,500.00 which is a level that lies underneath an overlap support and the 23.6% Fibonacci retracement.
Take profit is at 21,500.25 which is a pulback resistance that aligns with the 127.2% Fibonacci extension.
High Risk Investment Warning
Trading Forex/CFDs on margin carries a high level of risk and may not be suitable for all investors. Leverage can work against you.
Stratos Markets Limited (tradu.com):
CFDs are complex instruments and come with a high risk of losing money rapidly due to leverage. 63% of retail investor accounts lose money when trading CFDs with this provider. You should consider whether you understand how CFDs work and whether you can afford to take the high risk of losing your money.
Stratos Europe Ltd (tradu.com):
CFDs are complex instruments and come with a high risk of losing money rapidly due to leverage. 63% of retail investor accounts lose money when trading CFDs with this provider. You should consider whether you understand how CFDs work and whether you can afford to take the high risk of losing your money.
Stratos Global LLC (tradu.com):
Losses can exceed deposits.
Please be advised that the information presented on TradingView is provided to Tradu (‘Company’, ‘we’) by a third-party provider (‘TFA Global Pte Ltd’). Please be reminded that you are solely responsible for the trading decisions on your account. There is a very high degree of risk involved in trading. Any information and/or content is intended entirely for research, educational and informational purposes only and does not constitute investment or consultation advice or investment strategy. The information is not tailored to the investment needs of any specific person and therefore does not involve a consideration of any of the investment objectives, financial situation or needs of any viewer that may receive it. Kindly also note that past performance is not a reliable indicator of future results. Actual results may differ materially from those anticipated in forward-looking or past performance statements. We assume no liability as to the accuracy or completeness of any of the information and/or content provided herein and the Company cannot be held responsible for any omission, mistake nor for any loss or damage including without limitation to any loss of profit which may arise from reliance on any information supplied by TFA Global Pte Ltd.
The speaker(s) is neither an employee, agent nor representative of Tradu and is therefore acting independently. The opinions given are their own, constitute general market commentary, and do not constitute the opinion or advice of Tradu or any form of personal or investment advice. Tradu neither endorses nor guarantees offerings of third-party speakers, nor is Tradu responsible for the content, veracity or opinions of third-party speakers, presenters or participants.

Nasdaq100/UsTech100 Higher Timeframe Analysis
Here we have my view, this is my first TV idea so don't butcher me please LMAO.
You can see on the chart we have had significant price moves to the upside over the past days after a huge decline in the index.
This decline was mostly driven by tarrif uncertainty to my understanding, followed me a huge panic sell off which spiraled the index further down.
However, with tarrifs seemingly easing and other factors driving the price increase, we will see 1 of 2 directions (Obviously).
Over the last few days we have been stuck in a major key level where buyers and sellers had a great fight. We have now broken that zone to the upside. I expect the index to have some sell pressure take over at around the 21,000 area give or take some points targeting the lower zone of 20,300 area.
This is where buyers had control pre tarrif implementation (21,000 PTS). Using the old saying of support becomes resistance and vice versa I expect the index to either stagnate in this zone for a while before breaking higher. Or it will simply sink back down to the lower key levels.
As it currently stands, The uptrend is back in tact on a higher time frame from what I can see. I am not saying here is a great place to long but with good risk management (For swing longs) this might be the confirmation we needed (Break of zone below) to enter long posistions with an SL of 20,000 area and TP of ATH giving a positive RRR trade.
I am personally a scalper hence why I do not post ideas. Usually the setup is done and dusted before I could even type it up XD.
Let me know what you think of the idea, Remember this is not financial advice. I am not liable for any losses incurred if you base your trades off my idea.
Remember trade what you see, not what you think.

Hanzo : NAS100 15m: Bearish Confirmed After Liquidity Trap Done🔥 NAS100 – 15 Min Scalping Analysis (Bearish Setup)
Bias: Bearish
Time Frame: 15 Min
Entry Type: Confirmed Entry After Liquidity Sweep 20720
🩸 Key Reasons for Entry:
☄️Price manipulated above previous high (liquidity grab trap).
☄️Strong rejection from key supply zone with SMC confluence.
☄️Bearish order block + break of market structure.
☄️Entry respects higher timeframe resistance level.
🔤 Fair value gap / imbalance completed.
🔻Setup aligned with institutional reversal window
Target: Next 15M demand zone / 1:3+ RR
Status: trade active 👌

NASDAQ Fall? US100 AnalysisHello everyone.
We had a volatility at stock market last 2 month, it looks like market had good correction and found new buyer. BUT I DON'T THINK LIKE THAT.
After MR. Trump inauguration we saw bear market signals, it was like hedge funds dumped stocks, but after strong sell new buyers came at market and show us pretty good market correction but what will be next? The last 2 months brought intense volatility post-Trump’s inauguration. Hedge funds sold off heavily (S&P 500 dropped ~8% from its December high), but buyers stepped in, pushing a 5% retracement. RSI on SPY shows oversold conditions fading, yet I’m skeptical of this bounce.
Why? Bearish signals linger. VIX remains elevated (>20), and volume on up days is weaker than selloffs. Plus, geopolitics could derail this rally. Over the weekend, Ukraine and Russia discussed a 30-day ceasefire. If talks fail, the West’s new sanctions could spike oil prices (Brent crude already testing $80) and hammer energy-heavy indices like XLE or European markets (DAX).
I’m watching SPY’s 200-day MA (~510) as key support. A break below could signal a deeper pullback to 480. Energy and tech (QQQ) look vulnerable if sanctions hit. What’s your take—buying this dip or bracing for more downside?
Here is my 2 scene what i am expect from market, for me Scene and technical view scene 2 is more logical bur we will see what will be next step for stock market.
For collaboration text me in DM!!!
Always make your own research!!!

Stock Markets Rise Amid US–China Trade Deal ProgressStock Markets Rise Amid US–China Trade Deal Progress
As the chart shows, the Nasdaq 100 index (US Tech 100 mini on FXOpen) formed a bullish gap at Monday’s market open and, as of this morning, is trading at its highest level since early March.
This is driven by the announcement from the Trump administration of progress in securing a trade deal with China, following weekend negotiations held in Switzerland. Treasury Secretary Scott Bessent described the two-day talks with Chinese officials in Geneva as “productive”, adding that more detailed information would be shared on Monday.
As a reminder, the US imposed tariffs of 145% on Chinese goods, to which Beijing responded with a 125% levy on American imports.
Technical Analysis of the E-mini Nasdaq 100 Chart
The chart is showing bullish signals:
→ The downward trendline (shown in orange) was broken around the 19,666 level, which has since acted as support (indicated by the blue arrow).
→ Today, the Nasdaq 100 has moved above last week’s resistance near the 20,175 level.
→ Market fluctuations are forming an upward channel (shown in blue) from the April lows, with the price currently sitting in the upper half of the channel—typically a sign of strong buying pressure.
Further updates on the US–China trade deal may reveal key details, potentially reinforcing the current bullish sentiment in the equity markets.
This article represents the opinion of the Companies operating under the FXOpen brand only. It is not to be construed as an offer, solicitation, or recommendation with respect to products and services provided by the Companies operating under the FXOpen brand, nor is it to be considered financial advice.

NAS100 - Stock Market Expects a Devastating Week!The index is trading above the EMA200 and EMA50 on the 4-hour timeframe and is trading in its ascending channel. I expect corrective moves from the specified range, but if the index corrects towards the demand range, we can look for the next Nasdaq buy positions with a good risk-reward ratio.
U.S. stock futures responded positively to signals from both Chinese and American officials. Looking ahead to the coming week, investor focus is squarely on the Consumer Price Index (CPI) report from the United States—marking the first chance to assess the impact of the new tariffs implemented on April 9.
Meanwhile, ongoing trade negotiations between the U.S. and China remain a crucial factor, with significant implications for inflation, Federal Reserve policy, and overall market expectations. In addition to inflation data, retail sales figures and the preliminary results of the University of Michigan sentiment survey could influence market outlook regarding interest rates—especially since price stability and full employment remain core mandates of the Federal Reserve. At present, Fed officials are working to maintain a cautious stance in order to anchor inflation expectations. However, if clear signs of economic weakness emerge, that stance could shift rapidly—something that several Fed officials have already openly acknowledged.
Retail sales, in particular, could provide a different narrative about the health of the economy. After a notable 1.5% jump in March, estimates suggest that growth in April slowed to just 0.1%. This deceleration may reflect consumer reluctance to spend, stemming either from inflationary pressures or broader economic uncertainty.
Thursday’s data release will include the Producer Price Index (PPI), industrial production, and the Philadelphia Fed manufacturing index—offering a clearer picture of supply-side dynamics and the performance of the industrial sector.
On Friday, attention will turn to a fresh batch of economic indicators: building permits, housing starts, the New York (Empire State) manufacturing index, and especially the University of Michigan’s preliminary consumer sentiment survey. This survey has gained importance in recent months due to notable increases in both one-year and five-year inflation expectations. As recent charts indicate, while consumer confidence has plummeted to multi-year lows, inflation expectations have trended upward—a worrisome combination that could limit the Fed’s ability to ease monetary policy.
Although concerns about a U.S. recession persist, recent data suggest more of a “gradual slowdown” rather than signs of an imminent crisis. In March, both the CPI and PCE indices declined, indicating a temporary easing of inflationary pressures. However, this trend may reverse in April, as the broad implementation of reciprocal tariffs likely raised import costs—particularly for Chinese goods, which now face duties as high as 145%.
New estimates indicate that these tariffs could add 2.25% to core inflation over the next year, effectively reversing the progress made in 2024 on taming price pressures.Prior to the Trump administration’s tariff announcements, economists had differing views on inflation, with some expecting it to approach the Fed’s 2% annual target by year-end. Contrary to trade experts, Trump claimed that sellers would not pass these price increases on to consumers.
Goldman Sachs’ analysis this week suggests that Trump’s tariffs could push inflation to levels not seen since the post-pandemic price surge. The broad import taxes announced between February and April may have a substantial impact on the economy, and consumers are likely to feel the effects first at the checkout counter. Goldman economists estimate that the tariffs could drive annual inflation—as measured by core Personal Consumption Expenditures (PCE)—to 3.8% by December, marking the highest rate since 2023. The Fed’s preferred inflation gauge rose 2.6% last year.
This metric remains above the Fed’s 2% target and has shown limited progress toward that goal since 2023. The last time inflation was below this benchmark was in January 2021.
A renewed wave of price increases could severely strain American household budgets—particularly if the labor market also weakens, as many economists anticipate. This would also represent a significant setback for the Federal Reserve, which has kept interest rates elevated since 2022 in an effort to combat post-pandemic inflation.
While inflation hovered around 3% at the beginning of 2024 with little change, it saw a notable drop in March. Many analysts forecast that inflation will continue to decline and approach the 2% target by the end of 2025.
Walker and Peng’s analysis factored in both the direct effects of tariffs—most of which will likely be passed on to consumers—and several indirect consequences. The trade war has unexpectedly weakened the U.S. dollar, reducing Americans’ purchasing power.
Moreover, some manufacturers may shift production away from China, where tariffs are particularly severe, to locations with higher production costs. As a result, American consumers may end up paying significantly more for imported goods, especially in categories like consumer electronics and apparel.

Worst is behind for QQQ and SPXA textbook Bear flag with proper breakdown and reached the target.
Now the market is ranging to decide where to go. Whatever the price action will be, there will be suitable news on TV afterwards don't worry.
Looking purely at the charts, QQQ should recover between 488-510 area.
The two big volume days at the end of the pattern target convinced me we are on the way up for now, whether its a trap or not remains to be seen.
Cheers

Weekly Market Forecast: Wait For BUYS! Stock Indices and GoldIn this Weekly Market Forecast, we will analyze the S&P 500, NASDAQ, DOW JONES, Gold and Silver futures, for the week of May12 - 16th.
The Stock Indices were sluggish last week, holding at support. Wait for a market structure shift to the upside to confirm buys.
Gold and Silver may move higher, as India and Pakistan, Gaza and Ukraine are increasingly troublesome.
CPI Data on Tuesday. This could be a strong market mover.
Enjoy!
May profits be upon you.
Leave any questions or comments in the comment section.
I appreciate any feedback from my viewers!
Like and/or subscribe if you want more accurate analysis.
Thank you so much!
Disclaimer:
I do not provide personal investment advice and I am not a qualified licensed investment advisor.
All information found here, including any ideas, opinions, views, predictions, forecasts, commentaries, suggestions, expressed or implied herein, are for informational, entertainment or educational purposes only and should not be construed as personal investment advice. While the information provided is believed to be accurate, it may include errors or inaccuracies.
I will not and cannot be held liable for any actions you take as a result of anything you read here.
Conduct your own due diligence, or consult a licensed financial advisor or broker before making any and all investment decisions. Any investments, trades, speculations, or decisions made on the basis of any information found on this channel, expressed or implied herein, are committed at your own risk, financial or otherwise.

nas100 next move? 📈 NAS100 Market Update
NAS100 is currently trading around 19,500 and is forming a running flat wave pattern.
This structure is setting up for a potential move towards the 20,000 target.
Stay alert — the breakout could be strong!

$NQ Elliott Wave Analysis NASDAQ Elliott Wave Price Analysis
SEED_ALEXDRAYM_SHORTINTEREST2:NQ CME_MINI:NQ1! Expecting Price Rejects big time around $21964
Targets
First - 19362
Final Target 17525
Expecting price top around mid December