NAS100 LONG, WHAT DO YOU THNIK?We can see that price was respected from the daily orderblock, We could expect a retracement expansion profile on the daily time frame, so with this idea in mind I'll be going bullish on the retracement(manipulation move) 1 hour timeframe targeting the last week's Thursday high
follow me let share ideas
Nas100analysis

NAS100 BULLISH DO YOU AGREE ?Looking at the chart we can see that liquidity has been taken on the downside (Sellside Liquidity), which was respected by an ORDERBLOCK (+OB)... And with last week's price action market has shown a willingness to move to the upside to seek liquidity (buyside liquidity) with the market structure shift and the inefficiency showed...
Do you like this? please do well to like and follow , 'll be releasing more educational content and trade ideas... let's learn together.

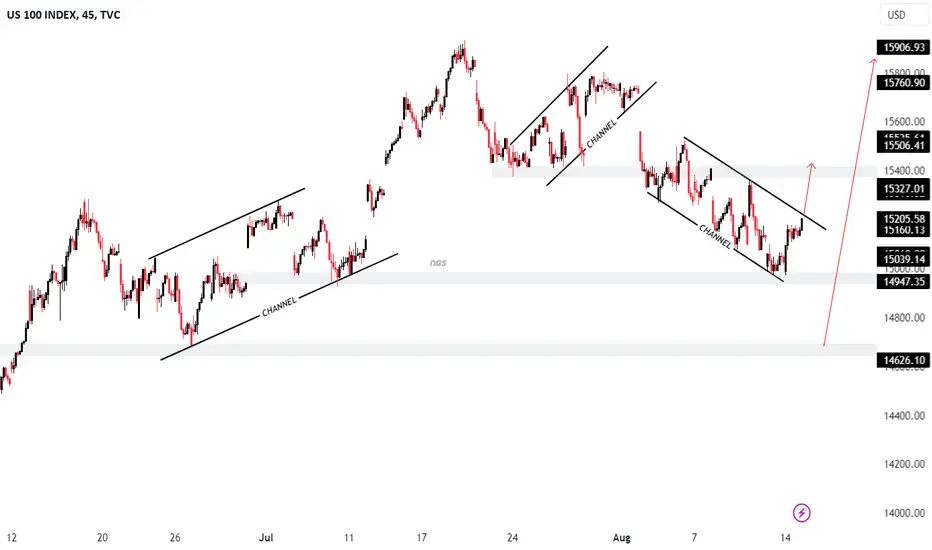
NASDAQ Breakout TradeNASDAQ wait for breakout and trade in the direction of breakout or place your but and sell stop.
Manage your risk according to account size!

NQ Outlook and Trade Ideas for the WeekNQ Outlook and Trade Ideas for the Week
Everything presented in the chart.
I don't want to overcomplicate it.

XAUUSD Top-down analysis Hello traders, this is a complete multiple timeframe analysis of this pair. We see could find significant trading opportunities as per analysis upon price action confirmation we may take this trade. Smash the like button if you find value in this analysis and drop a comment if you have any questions or let me know which pair to cover in my next analysis.

NASDAQ 23-08 MovePair : US100 - NASDAQ
Description :
Support Level
Completed " 1234 " Impulsive Wave
Bearish Channel in STF as an Corrective Pattern
Break of Structure
Divergence - RSI

US100 NASDAQ Technical Analysis and Trade IdeaThe NAS100 has encountered a significant support level followed by a minor retracement. Although the prevailing trend is undeniably bearish, the pivotal question revolves around the depth of the potential pullback, which could serve as an entry point for us. Within the video, we comprehensively address multiple facets of technical analysis, encompassing the trend's dynamics, price action, market structure, and more. I want to emphasize that the video provides a thorough explanation of all these elements, however, should not be interpreted as financial advice.


NAS100 I Retest the resistance Welcome back! Let me know your thoughts in the comments!
** NAS100 Analysis - Listen to video!
We recommend that you keep this pair on your watchlist and enter when the entry criteria of your strategy is met.
Please support this idea with a LIKE and COMMENT if you find it useful and Click "Follow" on our profile if you'd like these trade ideas delivered straight to your email in the future.
Thanks for your continued support!

NASDAQ RiskyRisk 0.5%
TP1 = 1:1 RR
Disclaimer:
The contents in this Idea are intended for information purpose only and do not constitute investment recommendation or advice. Nor are they used to promote any specific products or services. They serve as an integral part of a case study to demonstrate fundamental concepts in risk management under given market scenarios. A full version of the disclaimer is available in our profile description.

NAS100 DEMAND UPDATES
Previous idea on CPI last week its on spot.
PRice goes on, then drop like a fallen water..
Now im doubting this idea, could the market rebuy this zone or we will wait to our main/original idea before..
This is not a financial advice. Follow for more.
Give a boost if you win a trade last week until today.
Thank you.I will update this if price consolidate and has a good volume.

Nasdaq Dead?Despite the most recent sell off, my wave count suggests further upside, potentially during Q4 of 2023 should be expected.
Looking for support to be found, to then resume higher.
Feel free to ask questions,
Trade Safe!

Nasdaq 100/US TECH Trade IdeaI think the Nas100 will descend until around 14687.2 to liquidate that area and then go long. The Idea is also supported by the trendline as it has a 3rd touch.
Note that this is not any financial advice nor am I a pro-financial adviser. Just sharing my view.

NASDAQ US100 15-08 MovePair : NASDAQ - US100
Description :
Bearish Channel in Short Time Frame as an Corrective Pattern
Break of Structure
RSI - Divergence
Demand Zone
Completed " 1234 " Impulsive Wave
US100 NAS100 Technical Analysis and Trade IdeaIn this video, we closely examine the US100 NASDAQ, which is currently experiencing a distinct downtrend. We don't see any indications of the trend shifting in the near future. Additionally, we delve into the potential of a pullback and identify an optimal entry point short for the NAS100.
Please note: This content is intended solely for educational purposes and should not be interpreted as financial advice.

NAS sell on US session?PEPPERSTONE:NAS100
Hey, today with something special
This idea will be ICC based so lets get into it
How u can see trade from yesterday on nas was 0 drawdown so hope today will be same
For valid trade price cant go over last high whats around 15230.
Then we want to see break of last low and close candle under it
SL can be on last high. For TP1 we will be reaching last low (15100) candle close (15080) wick
Around this zone we can close partials or watch what price do, if we break under we can hold until new low will be made
Just wait for US Session
I took 2 trades like this on nas with high reward so i hope nas make the same move even when i share it with you.
Shoutout to SCI

Short to Medium Term Key Levels for NAS100 (PMLs)These are my short to medium term key PMLs (Price Magnet Levels) for NAS100

NAS100/NASDAQ HIGHER TIMEFRAME CONTEXTThe CPI is hotter than your girlfriend today, so keep me driving this idea, wether it goes higher first.
But whatever the prints on CPI, im expecting light rally @15370 zone before it ripped down below.
And if the 15080 zone would break again, Im expecting the previous support could break too.
14950 can still have a light rally but still bearish until the 14600 zone before it goes backup. to the break trendlines.
SO basically my view is wait below for a buy atleast at 14600 zone.
FOr swing traders wait for a CPI print or follow the line base on resistance zone 15380-15400
that would be my watch zone ..
Thank you for the support follow for more.
This is not a financial advice.
Swing traders only......

NAS100 Analysis. New LOW Coming!Hello Everyone. I want share my idea about NAS100.
On that index we saw pretty bullish trend, but after touch of 2022 weekly support we had some bearish movements which gave me signal it coming for show us new weekly low. That is normal all trend has this moment after strong movement.
Trend is still strong bullish for long term but at the moment what i see and my price prediction is short but not for long term, i think bearish trend will be only few days until it touch weekly trendline or daily support 3, then i think we will see another big bullish movement which i will share.
Couple days ago i tried to short this index but it didn't touch my entry point ( i will link in this idea ).
Now i dont have any entry point yet because price is at strong support zone, i think i will open my trade if price will go up slowly from the support or after brake that support and retest it at low timeframe ( 15m, 30m ).
Here is my 2 scene what price can do next week.
1 Bullish - price has strong reaction at support zone 15275 LVL brake weekly resistance and going up.
2 Bearish - price is not strong at support 15275 LVL, its coming down retest broken support and continue downtrend until it touch weekly trendline.
If i will be right i will update that idea when i will open position.
BE PATIENT!!!!

NASDAQ UpdateAUDUSD testing strong support area again, let's wait if support breaks or resist from the area.
Manage your risk according to account size!

NAS100 LongStill very bullish overall on this, so am waiting for so am waiting for a rejection from the bottom of this zone (15420.9) to look for longs

US100 NAS100 Technical Analysis and Trade IdeaTaking a look at the US100 we can see that this is starting to retrace. Evident on the chart also is a wedge pattern where we see lower highs and higher lows. Whether we see further downside given the lower highs remains to be seen. In the video we look at a possible trade opportunity as this heads into key support levels. As always everything explained in the video, and not to be construed as financial advice.

NAS100/NASDAQHello Traders and followers.
This idea are approaching on demand zone. before we goes up. but my advice is look on confirmation of volume or higher timeframe buy setup.
This is not afinancial advice you can follow for more.
we might see 16300 nasdaq price soon,
