Sniper Trading System EXPLAINEDIf you do not have a system that's calibrated to the code that's generated on the 1 sec time frame you will always find yourself guessing and never really KNOWING.
My System is calibrated down to the 1 second time frame where the money aka code is generated. What I discovered is: if you can find the KEY to the Daily bias you have a considerable EDGE in the market.
I found that key and it is found in the 12AM Candle. This candle lets a Sniper Know where the raid will go before the main move aka Trend of the day.
In this trade on NAS 100 ( my system works on everything) the 12 AM told me that the raid would be Bullish after 1AM. So we anticipate the short during one of our Clearing House Times - when the algorithm seeks Liquidity aka Raids your Stops.
Today we got the drop at 8:30am EST. 1st TP SMACKED. 2nd TP KISSED as of now and headed to target.
The VIX is due for a rebound so NAS100 may continue to fall this week.
Nas100analysis

NASDAQI Also Want To See The Nasdaq Trading Lower This Week, They Can Trade Up To Take That H4 Liquidity Above That High.
Or They Can Run Out Today's Lunch Hour Highs Then Sell Off
Do Remember To Use The S&P500 And The Dow Jones Index For SMT Divergence.

NASDAQ JULY MONTHLY STRUCTURE OHLC (SELL SETUP) 🔻🔻🔻🔻NASDAQ JULY
MONTHLY STRUCTURE
OHLC (SELL SETUP)
🔻🔻🔻🔻
The July monthly structure for NASDAQ in 2023 can be analyzed through the OHLC (Open, High, Low, Close) framework. Currently, a sell setup seems to be emerging as NASDAQ's NAs100 index has formed an OPEN HIGH LOW CLOSE structure on the daily timeframe. This structure has effectively rejected prices below the sell zone at 15582.08 . Based on this configuration, a potential target for a sell setup is anticipated to be at 15255.22 , following a confirmation from the TDI (Trade Dynamic Index) crossing.
Another confirmation supporting the bearish stance for NASDAQ is the presence of a perfect bearish divergence observed on the daily timeframe, spanning from June 16, 2023, to the current price on July 14, 2023. This divergence suggests a potential shift in market sentiment and further supports the selling bias. Currently, we are awaiting a TDI cross on the daily timeframe, which will serve as an additional confirmation of the presence of sellers in the market.
Moreover, it is strongly believed that price will open high today during the market's opening session. This provides an opportunity to capitalize on selling at the peak of the New York trading session. Additionally, there are indications of a possible formation of a head and shoulder pattern, with the market currently in the second leg of the right shoulder during the pullback phase following the initial breakout.
In light of these observations, it is essential to exercise patience in the markets, closely monitoring the evolving patterns and price action. Furthermore, there is a possibility of an evening star pattern developing on the daily timeframe, which further reinforces the bearish sentiment.
By providing this comprehensive analysis with a professional tone and incorporating specific examples, we can gain a deeper understanding of the July monthly structure for NASDAQ in 2023, focusing on the OHLC framework, sell setups, bearish divergences, TDI crosses, and potential pattern formations such as head and shoulder and evening star patterns.
Target 1 - 15255.22
It is crucial to exercise patience and await the TDI cross before taking any action.
Trade with Caution. Wait for valid entries.
Please support this idea with LIKE, FOLLOW & SHARE if you find it useful.
P A T I E N C E + D I S C I P L I N E

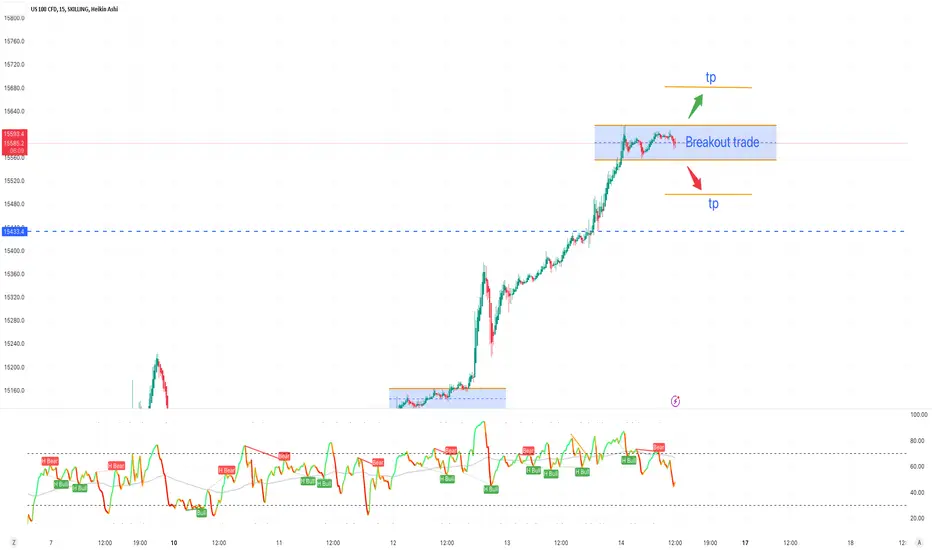
NASDAQ Breakout Trade PlanNASDAQ moving in range now wait for breakout to trade or place your buy stop and sell stop.
Manage risk according to your account size.
Nasdaq's Rebalancing of Fabulous 7 Tech Stock so CautionRecent news concerns Nasdaq's decision to rebalance its equal weighting for the Fabulous 7 tech stocks. While this may seem like a routine adjustment, I urge you to exercise caution and remain skeptical about future stock returns and performance.
It is no secret that the Fabulous 7 tech stock has been the talk of the town lately, capturing the attention of investors worldwide. Its remarkable growth and seemingly unstoppable momentum have undoubtedly piqued the interest of many. However, as seasoned traders, we must be aware of the hype and excitement surrounding these stocks.
Nasdaq's decision to rebalance the equal weighting of the Fabulous Seven tech stock raises concerns and warrants a closer examination of the situation. Why would such a move be necessary if everything was going swimmingly? It is essential to question the motives behind this adjustment and consider its potential implications on the stock's performance.
While rebalancing can be a regular part of market operations, it often signifies a shift in the underlying dynamics of a stock. It is crucial to remember that past performance does not guarantee future success. The Fabulous Seven tech stock's meteoric rise may have been impressive, but more is needed to ensure continued growth or prosperity.
As traders, we must remain vigilant and not mindlessly follow the crowd. While the Fabulous Seven tech stock has undoubtedly provided lucrative opportunities in the past, it is crucial to approach future investments with a healthy dose of skepticism. We must carefully analyze the potential risks and rewards, considering the rebalancing decision and its impact on the stock.
In conclusion, please proceed cautiously regarding the Fabulous Seven tech stock and any future investments. Nasdaq's rebalancing decision serves as a reminder that the market can be unpredictable and subject to sudden changes. Let us remember the importance of conducting thorough research, diversifying our portfolios, and making informed decisions based on careful analysis.

NAS100 and US30 Top-down analysis Hello traders, this is a complete multiple timeframe analysis of this pair. We see could find significant trading opportunities as per analysis upon price action confirmation we may take this trade. Smash the like button if you find value in this analysis and drop a comment if you have any questions or let me know which pair to cover in my next analysis.

NAS100 Potential DOWNSIDEHi TRADERS , Nas100 gave us a couple of confluences, first by forming an "M" Double Top to Forming Head & Shoulders. Now lets wait for the final confirmation a break on the support, Please use proper RM

NFP NASif 15100 holds we can see a nice move to the down side tapping into that 4hr order block and buy side liquidity around 14900
now if 15100 doesn't hold we can see a move up to clear the remaining sell side liquidity around 15160 -15220
im short side biased at the moment a break of 15050 should open the door for a nice move down to those both of those green lines if no break i wouldnt enter waiting on confirmation but keep a eye on this trade safely its NFP


NASDAQ Bearish DiverganceBearish Divergance NASDAQ on 1hr chart lets wait for divergence to play its role and place sell stop at 15158.
Manage your risk accordingly!

Nasdaq -> Preparing The Bearish WaveHello Traders,
welcome to this free and educational multi-timeframe technical analysis.
On the weekly timeframe you can see that Nas100 just retested and already started to reject the major previous weekly structure zone at the psychological $15.000 level.
You can also see that Nas100 retested the resistance of the very bullish rising channel, the next support would be the 38.2% fibonacci retracement level at the $14.000 zone so I am just waiting for more bearish pressure and then I do expect more upside potential.
On the daily timeframe you can see that Nas100 finally broke structure towards the downside with Monday's candle so this is a sign that Nas100 is actually slowing down - I do expect another push lower to retest daily support at the $14.300 level and then I do expect a first bullish rejection.
Thank you for watching and I will see you tomorrow!
You can also check out my previous analysis of this asset:

NAS100 Top-down analysis Hello traders, this is a complete multiple timeframe analysis of this pair. We see could find significant trading opportunities as per analysis upon price action confirmation we may take this trade. Smash the like button if you find value in this analysis and drop a comment if you have any questions or let me know which pair to cover in my next analysis.

NAS100 Top-down analysis Hello traders, this is a complete multiple timeframe analysis of this pair. We see could find significant trading opportunities as per analysis upon price action confirmation we may take this trade. Smash the like button if you find value in this analysis and drop a comment if you have any questions or let me know which pair to cover in my next analysis.

Nasdaq -> When Does It StopHello Traders,
welcome to this free and educational multi-timeframe technical analysis.
On the weekly timeframe you can see that the Nasdaq is currently retesting important previous weekly structure at the psychological $15.000 level which is now turned resistance.
You can also see that over the past couple of weeks, the Nasdaq created a rally of about 30% towards the upside, breaking a lot of resistance towards the upside but now we are a little bit overextended so I am simply waiting for a rejecion away from the resistance area.
On the daily timeframe you can see that market structure is still bullish overall, there is no sign of the Nasdaq slowing down so I am still waiting for some bearish selling pressure before I then do expect also a daily retracement after this agressive pump recently.
Thank you for watching and I will see you tomorrow!
You can also check out my previous analysis of this asset:

US30 and NAS100 Top-down analysis Hello traders, this is a complete multiple timeframe analysis of this pair. We see could find significant trading opportunities as per analysis upon price action confirmation we may take this trade. Smash the like button if you find value in this analysis and drop a comment if you have any questions or let me know which pair to cover in my next analysis.

Nasdaq Short Idea For The Coming Days Or Weeks.This is my analysis on the Nasdaq, I'm anticipating selling down to any of those two weekly fair value gaps, what will confirm if any of those fair value gaps will hold price and have us see an expansion to the upside is if price breaks structure bullishly to the upside on the 4 hour time frame, for now shorts are ideal for this market condition.

NASI have my eye on this area at the moment one of two things could happen
1. we could go up higher and grab liquidity and or see price go lower to target equal lows resting below and see if price will continue to fill gaps below.
2. we could see price continue rising above and leaving gaps open with resting SSL below and target previous highs at around 14645 and or 15300.
lets see what price gives us over night and look forward to Friday morning with high impact news on the morning.
3 red high impact folders

NAS100 Top-down analysis Hello traders, this is a complete multiple timeframe analysis of this pair. We see could find significant trading opportunities as per analysis upon price action confirmation we may take this trade. Smash the like button if you find value in this analysis and drop a comment if you have any questions or let me know which pair to cover in my next analysis.

Nasdaq Short trade planNasdaq at channel top
Short Nasdaq at cmt 13920
For the target of 13745
with the SL at 14100

NAS100 Top-down analysisHello traders, this is a complete multiple timeframe analysis of this pair. We see could find significant trading opportunities as per analysis upon price action confirmation we may take this trade. Smash the like button if you find value in this analysis and drop a comment if you have any questions or let me know which pair to cover in my next analysis.

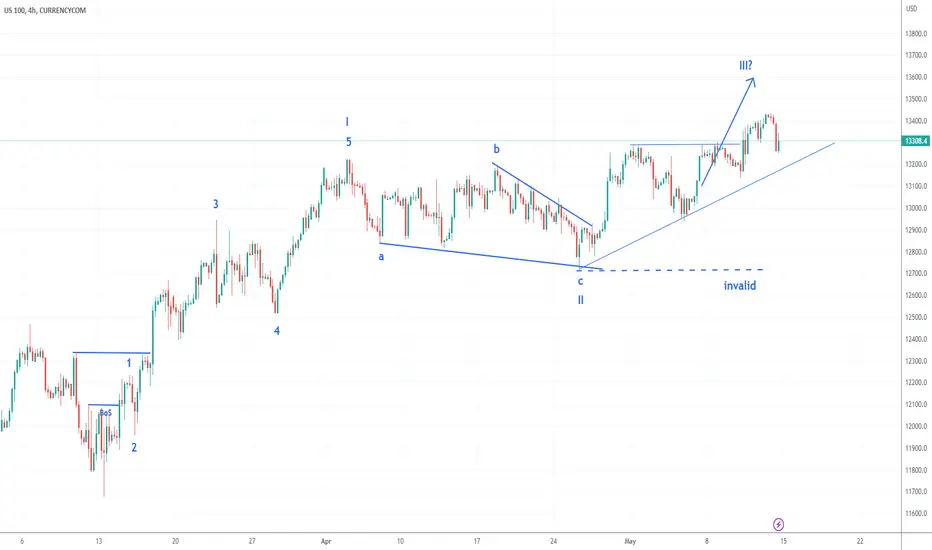
US100 Nasdaq Next Possible MovePair : US100 - Nasdaq
Description :
Bearish Channel in Long Time Frame as an Corrective Pattern with the Breakout of the Upper Trend Line
Divergence - RSI
Break of Structure
Completed " 12345 " Impulsive Wave
Fibonacci Level ( 50.00% / 61.80% )
Rising Wedge

US100 14May2023last week the performance of the Nasdaq was in accordance with the analysis, still continuing the bullish trend. the bullish trendline also supports the analysis with a bar movement with a slope of 45 degrees, we take the opportunity to buy next week
Nasdaq -> Bulls Are In ControlHello Traders,
welcome to this free and educational multi-timeframe technical analysis .
On the weekly timeframe you can see that Nas100 is actually approaching a quite obvious previous weekly support/resistance zone at the $13,500 level which is now turned resistance once again.
You can also see that from a weekly perspective, market structure is extremely bullish, moving averages are also bullish and we just recently broke above and retested a previous weekly resistance which was then turned support so from a weekly perspective I simply do expect a deeper retest of the next resistance at the $13,500 before I then do expect a short term rejection towards the downside.
On the daily timeframe you can see that with today's candle, Nas100 is finally breaking above a previous daily strong resistance area so market structure is now bullish again - I am just waiting for a little bit more upside, then a retest of the previous resistance which is then turned support and then I do expect more continuation towards the upside.
Thank you for watching and I will see you tomorrow!
You can also check out my previous analysis of this asset:
