🧅NAS100 Overview 7/23/2022Price still in a Down trend
1st scenario : price break the Daily bearish OB & break previous high then fall down to 1H bullish ob.
2nd scenario : price won't break the Daily bearish OB then fall down to 10699.
.
Price was in a Fib .79 level & reached the bearish ob. so i will say that price >79% most likely to drop at this level .
.
.
.
.
.
.
.
🧅Disclaimer :There are risks associated with investing in securities. Investing in stocks, bonds, exchange traded funds, mutual funds, and money market funds involve risk of loss. Loss of principal is possible. Some high risk investments may use leverage, which will accentuate gains & losses. Foreign investing involves special risks, including a greater volatility and political, economic and currency risks and differences in accounting methods. This is Not Financial Advice
🧅JUST AN OPINION OF THE ONION.🧅
Nas100analysis

NASDAQ Trade BIASLooking to see what we get for NAS-- but so far from the push we had away from the current zone 12500 I'm looking to see a retracement lower and either it finds support at the past highs near the FVG below the low which is also our 50% fib OR.. I see it breaking that area and retesting below the trend line and going lower towards 11300. Lets see what unfolds.

NAS100| Is the stock market recovering now? Top down analysisLet's examine NAS100, first on a weekly timeframe. We see that the index has been in a strong downtrend. Was the bullish impulse that began yesterday breaking a triangle on lower timeframe a sign that the stock market is recovering?
On 16 May 2022 NAS100 bottomed at around 1150 (Y) and then rallied up to test a zone that was broken at around 12945 and 13000. From there the market declined significantly and bottomed few pips closer to 11000. Since then the market had been on a rise and I believe it is going to test the 12945-13000 zone again for the second time.
Around 12945-13000 zone I expect the market to decline again and I believe it will fall to 1150 zone.
Because the market is rising to test the 12945-13000 zone for the second time, sellers seem to lack much strength to push price lower. It is more likely that we will see a strong base around 1150 and 1300, which in the near future if violated to the top it will signal stock market recovery and if violated to the bottom we will likely see another low.
Making 1150 and 1300 as important levels to keep in mind as in the near future we will see these levels being tested again.
On a lower timeframe we see that the index is approaching that 12945-13000 zone and we also see that the index is within a descending channel which I believe at one point in the near future the resistance of this channel will be tested.
I have also attached the chart for Tesla, one of the giant stock companies that influences the direction of the market. Tesla had been trading within a triangle pattern and I believe once a breakout occurs the direction will be determined . We are expecting Tesla report later today which will be for the fiscal quarter ending Jun 2022. Positive report from Tesla will impact Nas100 positively and negative report will do the opposite.
What is your long term bias on NAS100? Are you bullish or bearish? Please share your comments below.
Please do not forget to show your support of this idea with likes.
Trade smart!

🧅My trade journal 7/20/2022price moving up as a bigger TF created a short term long setup
Overall NAS100 still in a down trend
still in a rainy season, i stll fxkin hate rain. might become rotten onion as rotten tomatoes
I put all the works on the chart, just read it .
.
.
.
.
.
.
🧅Disclaimer :There are risks associated with investing in securities. Investing in stocks, bonds, exchange traded funds, mutual funds, and money market funds involve risk of loss. Loss of principal is possible. Some high risk investments may use leverage, which will accentuate gains & losses. Foreign investing involves special risks, including a greater volatility and political, economic and currency risks and differences in accounting methods. This is Not Financial Advice
🧅JUST AN OPINION OF THE ONION.🧅

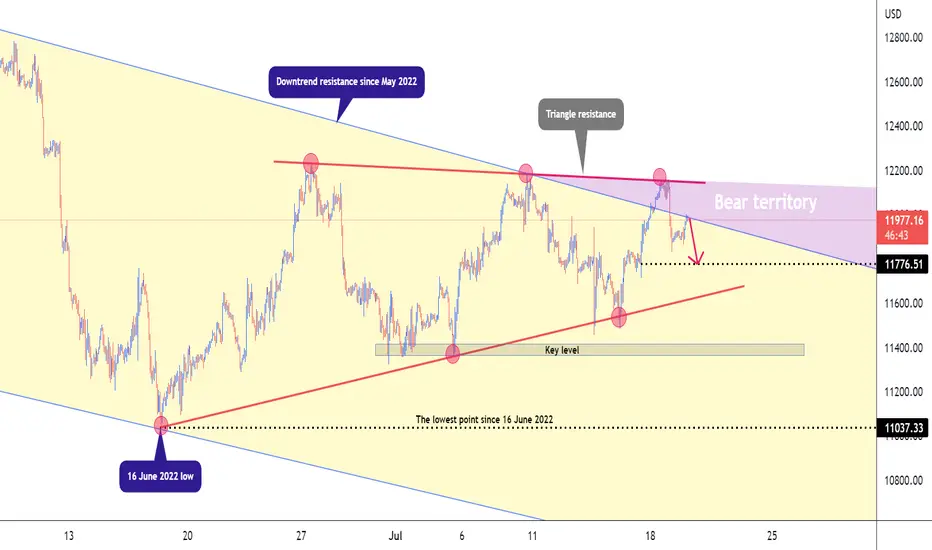
Expect NAS100 to fall to 11776!Yesterday we saw a strong bearish impulse from 12156 as I mentioned in my previous idea and NAS100 erased at least 2.70% of its last week's gains. The market retraced up earlier today during London session and now trading around a downtrend resistance that extends from May 2022. Today I expect the market to fall from this downtrend resistance and target 11776.51.
Have you any suggestion? Do you think Nas100 will rise or fall today? Please comment below.
Also, do not forget to show your support by liking the idea.
Trade smart!
NAS 100 analysis on daily chartMy analysis on NAS 100 from a daily chart. The market is still bearish. This analysis are done within a down channel. if the price breakout from the resistance level. It will push to challenge the outer trendline.
🧅My trade journal 7/15/2022My previous trade journal was in a private post...no wonder why
It's was my fault i was too hurry to post the idea so i will linked below this description .
if you want to see it just click on all my related ideas.
.
.
.
.
.
.
.
.
🧅Disclaimer :There are risks associated with investing in securities. Investing in stocks, bonds, exchange traded funds, mutual funds, and money market funds involve risk of loss. Loss of principal is possible. Some high risk investments may use leverage, which will accentuate gains & losses. Foreign investing involves special risks, including a greater volatility and political, economic and currency risks and differences in accounting methods. This is Not Financial Advice
🧅JUST AN OPINION OF THE ONION.🧅

🧅My trade journal 6/30/2022Same as my every educational post
But to day i'hv describe all of it
My emotional while i'm trading
My right&wrong entry
Feel like it will be a good new chapter of my trading journal
Good Luck Trader💯💯
.
.
.
.
.
.
🧅Disclaimer :There are risks associated with investing in securities. Investing in stocks, bonds, exchange traded funds, mutual funds, and money market funds involve risk of loss. Loss of principal is possible. Some high risk investments may use leverage, which will accentuate gains & losses. Foreign investing involves special risks, including a greater volatility and political, economic and currency risks and differences in accounting methods. This is Not Financial Advice
🧅JUST AN OPINION OF THE ONION.🧅

Supply zone is the best place to sell NAS100!
What's up everybody?
Let's take a look at NAS100 and the current situation on it. As I discussed in my previous idea, NAS100 broke below its rising trendline previously and began to consolidate for a while building up a cluster of candles. Earlier today we witnessed the market breaking out of the cluster candles to the bottom turning the level into a supply zone. Currently we are seeing NAS100 pulling back into this area.
If you missed the earlier sell opportunities, you can possible catch this one. As the market is pulling back into the supply zone, I believe the market will have difficulties passing through the supply zone at least for now. Bears will strongly defend this zone since the market was held for hours in this zone and expect the market to keep falling. 1131 and 1114 are ideal levels to set targets.
Please like and comment.
Previous ideas

🧅Nas100 Daily TF Overview 6/8/22From my previous analysis Nas created a Break of structure.
and this might be our lovely FVG.
Is it time for a Long position ???
Ask your self.
I won't provide you any signals . you have to learn how ,for your long term success.
and i'm still learning everyday.
Be the onion🧅.
Watch all my related ideas.
Good Luck Trader💯💯
.
.
.
.
.
.
🧅Disclaimer :There are risks associated with investing in securities. Investing in stocks, bonds, exchange traded funds, mutual funds, and money market funds involve risk of loss. Loss of principal is possible. Some high risk investments may use leverage, which will accentuate gains & losses. Foreign investing involves special risks, including a greater volatility and political, economic and currency risks and differences in accounting methods. This is Not Financial Advice
🧅JUST AN OPINION OF THE ONION.🧅

NAS100 overall bullish projection and trend reversal!Hello everyone,
Yesterday I discussed about NAS100 and its current developments on lower timeframe. I spotted certain patterns that seems to repeat themselves. You can take your time to read my previous idea on this to have an idea of what I am talking about by following the link below.
If we expect a bull rally soon as discussed yesterday and possible reach 13000 in the near future, it is easy to believe that we will see a giant inverse head and shoulders on the higher timeframe which will eventually sponsor a strong bullish move to the upside and change the overall trend in this market.
Keep in mind that the market may not turn out to exactly move in the same way, even if we can be confident in its future destination. I for my part will use the overall idea as a road map, but the streets may be curved.
If you enjoy this idea please do not forget to show your support with likes. I will highly appreciate it.
If you have any question, feel free to ask in the comment section below.

NAS 100 Weekly AnalysisNAS 100 weekly analysis. The market is still on the down trend. This is indicating that we need to look for selling opportunities more than the buy once. if you do take a buy signal make sure that you don't hold long, due to the market being bearish. This is just my opinion not financial advise.

I will watch out NAS100 to Sell at these levels! I would like to see it pull back in either the 38.2% Fibonacci level (#1183), or the 50% Fibonacci level (#12000). I will be watching for rejections at those levels with a strong bearish bar on lower timeframe. Seeing that the market is more bearish, it's most likely that one of these levels will be an ideal for short positions. I will be eyeing psych level 11000 as my first target and hopefully trail in some orders to see how far it will fall. As I discussed in my previous idea, I expect the worst for the stock markets so bears are in this for a long haul.
If you have any question please leave it in the comment section below.
If you enjoy reading my ideas please be kind to leave a like.

NAS100 Entries + Exits for FREE (Best Reverse Strat)The 1on1 video is currently out, if you would like it in order to understand how to play my analysis FULLY, please let me know privately.
All likes/comments and feedback are very much appreciated!
How to play my chart:
Buy at support, sell at resistance. When you open this chart you'll see a green entry and a red entry. When the candlestick hits the green entry, you place a buy. If however that support buy doesn't go into profit and goes negative -35 or -60 pips (depending if it was a fast break/or if the break landed on a minute 15 zone), if it breaks you would then exit your buy and immediately enter the sell. You would then ride that sell down to green TP1, or you could then repeat and play the buy/break there.
The same exact thing goes for resistance sell/break plays!

NAS100 6/7/22Before london session begin we can identified liquidities above those lower high.
.
Once 9:30 begin stocks market open Price reached FVG then start rally down.
.
Overall i'm still looking at 12000 key level .
.
.
.
.
.
🧅Disclaimer :There are risks associated with investing in securities. Investing in stocks, bonds, exchange traded funds, mutual funds, and money market funds involve risk of loss. Loss of principal is possible. Some high risk investments may use leverage, which will accentuate gains & losses. Foreign investing involves special risks, including a greater volatility and political, economic and currency risks and differences in accounting methods. This is Not Financial Advice
🧅JUST AN OPINION OF THE ONION.🧅

🧅NAS100 6/4/22I have decribed how the market move from my perspective .
before and after the newyork session begin.
unfortunately i can't publish 1m TF ,you guys can click the link on the chart to see it's in my private post for a better view.
Let's learn together
Good Luck Trader💯💯
.
.
.
.
.
.
🧅Disclaimer :There are risks associated with investing in securities. Investing in stocks, bonds, exchange traded funds, mutual funds, and money market funds involve risk of loss. Loss of principal is possible. Some high risk investments may use leverage, which will accentuate gains & losses. Foreign investing involves special risks, including a greater volatility and political, economic and currency risks and differences in accounting methods. This is Not Financial Advice
🧅JUST AN OPINION OF THE ONION.🧅

🧅The power of 3 by ICT on NAS100The power of 3 by ICT on NAS100
1, Accumulating
2, Manipulating
3, Distributing
.
.
.
.
.
.
Disclaimer :There are risks associated with investing in securities. Investing in stocks, bonds, exchange traded funds, mutual funds, and money market funds involve risk of loss. Loss of principal is possible. Some high risk investments may use leverage, which will accentuate gains & losses. Foreign investing involves special risks, including a greater volatility and political, economic and currency risks and differences in accounting methods. This is Not Financial Advice
🧅JUST AN OPINION OF THE ONION.🧅

NAS100 [US100] Daily Outlook | 02-JuneThe plan today is pretty simple. Follow it with keen attention to your capital and risk management.
Lets see how it plays out.
Kings

NAS100 USD OVERVIEW D TFbeak of structure appeared ?
This might be a good opportunity for Long position.
3000++ pips Gotta Catch 'Em All!
.
.
.
.
.
🧅Disclaimer :There are risks associated with investing in securities. Investing in stocks, bonds, exchange traded funds, mutual funds, and money market funds involve risk of loss. Loss of principal is possible. Some high risk investments may use leverage, which will accentuate gains & losses. Foreign investing involves special risks, including a greater volatility and political, economic and currency risks and differences in accounting methods. This is Not Financial Advice
🧅JUST AN OPINION OF THE ONION.🧅

🧅Read & Learn market structure NAS100I have decribed how the market move from my perspective .
before and after the newyork session begin.
unfortunately i can't publish 1m TF ,you guys can click the link on the chart to see it's in my private post.
Let's learn together
Good Luck Trader💯💯
.
.
.
.
.
.
🧅Disclaimer :There are risks associated with investing in securities. Investing in stocks, bonds, exchange traded funds, mutual funds, and money market funds involve risk of loss. Loss of principal is possible. Some high risk investments may use leverage, which will accentuate gains & losses. Foreign investing involves special risks, including a greater volatility and political, economic and currency risks and differences in accounting methods. This is Not Financial Advice
🧅JUST AN OPINION OF THE ONION.🧅

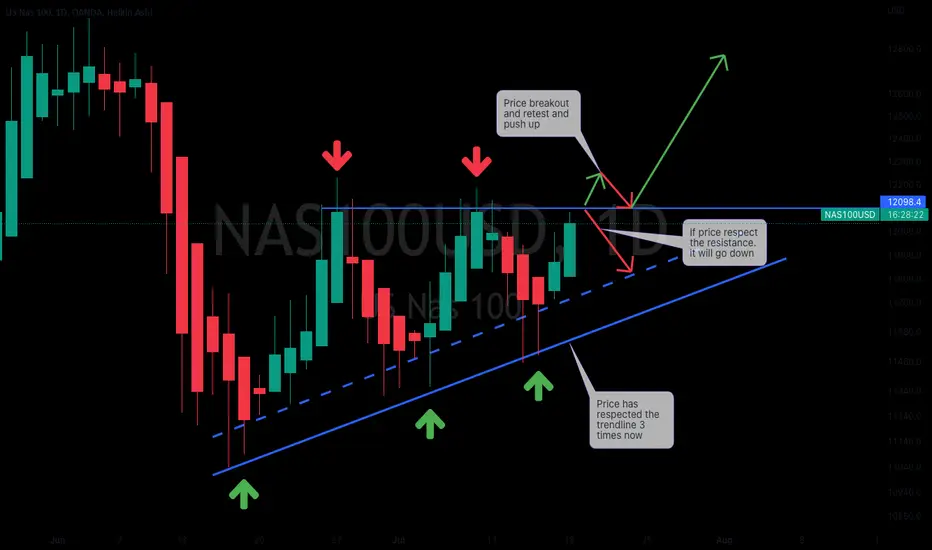
1 hour chart Nas 100 has breakout of the inner trendline. this may give opportunity for the bull to push up if bears are no-longer strong. we are yet to see because anything can happen in the market. This is my daily analysis.

Nas100 two possible scenarios from this key level!Nas100 broke above its falling channel that kept it in a strong downtrend since March 2022 closing above the 10th and 17th May highs. Ahead of it is the 12800 key level where I anticipate price to stop or make some reactions. A break above the 12800 or 13000 vicinity will expose the next resistance level at around 13570.00. If buyers hesitate to break the 12800-13000 key level, we could see price retracing lower and the nearby support is seen at 12000-12050.
I will watch for any possible trading opportunities in this market.
I will appreciate your continuous support, your likes do really matters to me. If you have any question feel free to ask in the comment section below.
Namaste❤️

NAS100 swing long analysisFundamentally, USD starts to show signs of weakness along with the US 10 year yield, short term bullish on stocks as risk on assets.
Technically, NAS100 has also started to break significant structure to the upside with a CHoCH on the 4H followed by a bullish BoS confirmation. Looking to start a swing buy position.
