Nasdaq Cash: Trading Plan For The Coming WeeksHere is my "Nasdaq Cash" trading idea for the weeks ahead.
As it is clear, Nasdaq has moved a huge amount and may continue this trend hence forth.
In H4 time frame there is an strong level of liquidity( at price 17320.59 ) after hunting the mitigation of decision level and touching the FVG , and doing so, the extreme flip in the positive range is remained untouched.
I Presume that the price will try to reach out the level of liquidity and touch the mentioned extreme flip in order to go higher. For doing so we may have a negative Break of Structure(BOS) at H4 time frame which I assume might be a temporary BOS to reach out the liquidity level.
Keep in mind that if the price reaches the extreme flip, we will need an H4 Reverse pattern( H4 Positive Mainpulation ) to occur in order to jump in Buy Position since the structure of H4 time frame may have been changed in that time.
Nas100analysis

Nasdaq February Monthly Review – Contin.Refer to the previous post regarding Feb Monthly Analysis for part 1 of this post.
So as promised, here is the detailed analysis of each of the Feb month’s entries, marked with number’s on the chart:
Trade 1:
Entry Point: 17254
Time of entry (GMT): +-8h30
Confirmations:
Market Pattern: DB formed on 1H TF with neckline broken. Also on the 31 Jan, price had travelled down more than the distance equal to the height of the day DT that had formed (marked in blue lines). From profit target (end point of the blue vertical line), probability is high that market will move back to retest the neckline of the market pattern. I like being part of a retest that is in the same direction as the overall trend
Fib: The Day candle on 31 January had closed with a spike down to the Day 0,50 fib level (fib drawn from swing low at A. to swing high at B.). Day fib levels are strong and a DB forming in the area of the D 0,50 fib level is a strong entry signal
Candlesticks: 31 Jan Day candle closed with a longish spike down to the D 0,50 fib + D EMA
S&R: Strong dynamic support provided by the D EMA
Trend lines: The trend is your friend - taking a buy in a bullish market will always get you the most pips because rallies can often run for longer than you expect (buy the dip)
Stop loss: Half the height of the DB i.e.. At 17175,9
Draw Down pips: 754 pips
TP points: TP1 = 17963 (fib level -0,27)
TP2 = 18348,8 (fib level -0,618)
Fib drawn from swing low at A. to swing high at B.)
Both TPs hit
Close half your position at TP1 and the other half at TP2
Profit in pips: 10’943
Comments: Successful trade
---------------------------------------------------------------------------------------------
Trade 2:
Entry Point: 17607
Time of entry (GMT): 21h00
Confirmations:
Market Pattern: Db formed on the 15min TF, with strong momentum candle breaking the neckline.
Fib: DB formed by the Day 0,618 fib level (fib drawn from swing low at C. to swing high at D.) 0,618 fib levels are very strong especially on the D TF
Candlesticks: On the 15min TF, there is a long wick hammer candle right by the D 0,618 fib level + strong momentum green candles on the 15min TF to break the neckline of the DB.
S&R: DB formed by a strong Day S&R zone + D EMA right by this zone providing dynamic support
Trend lines: The trend is your friend - taking a buy in a bullish market will always get you the most pips because rallies can often run for longer than you expect
Stop loss: Half the height of the DB i.e. At 17531
Draw Down pips: 137 pips
TP points: TP1 = 18293,2 (fib level -0,27)
TP2 = 18617 (fib level -0,618)
(Fib drawn from swing low at C. to swing high at D.)
Plan is to close half your position at TP1 and the other half at TP2
Profit in pips: zero
Comments: This trade did not work out - ultimately price came down and took the trade out at entry - Market moved up 3504 pips from entry
--------------------------------------------------------------------------------------------
Trade 3:
Entry Point: 17364
Time of entry (GMT): 20h30
Confirmations:
Market Pattern: A huge DT formed on the D TF with a break of the neckline (neckline and profit target (ie same distance as height of market pattern) marked in orange lines). Price travelled the full distance of the profit target. End of profit target (end of the orange vertical line coincides perfectly with Week 0,382 fib level). Market has a high probability of retesting the neckline of the market pattern after reaching the profit target. I like being part of a retest that is in the same direction as the overall trend. DB formed on the 15min TF at this level with a break of the neckline.
Fib: 15min DB formed right at the W 0,382 fib level
Candlesticks: None
S&R: Strong Day support level + 4H 200 EMA
Trend lines: The trend is your friend - taking a buy in a bullish market will always get you the most pips because rallies can often run for longer than you expect
Stop loss: Half the height of the DB ie. At 17333
Draw Down pips: zero
TP points: TP1 = 18542 (fib level -0,27)
TP2 = 19189 (fib level -0,618)
Fib drawn from swing low at E. to swing high at D.
Plan is to close half your position at TP1 and the other half at TP2
Profit in pips: still in progress
Comments: Trade still in progress - market has moved 10'923 pips from entry
-----------------------------------------------------------------------------------------------
Trade 4:
Entry Point: 17834,6
Time of entry (GMT): 13h30
Confirmations:
Market Pattern: DB formed on 30min TF right at the W 0,382 fib level + D 0,382 fib level. Enter at break of the neckline.
Fib: Area of confluence because Week and Day 0,382 fib levels coincide
Candlesticks: Long wick candle close on 30min TF piercing both the Fib levels but closing above
S&R: 4H support level + D EMA providing dynamic support
Trend lines: The trend is your friend - taking a buy in a bullish market will always get you the most pips because rallies can often run for longer than you expect
Stop loss: Half the height of the DB i.e. At 17825
Draw Down pips: 130 pips
TP points: TP1 = 18307,5 (fib level -0,27)
TP2 = 18581 (fib level -0,618)
Fib drawn from swing low at 3. to swing high at F.
Plan is to close half your position at TP1 and the other half at TP2
Profit in pips: TP1 hit + TP2 in progress
Comments: Tp1 hit at 4748 pips above entry
-----------------------------------------------------------------------------
If you had taken these trades, you would have closed out on 15'691 pips of profit.
Always easier to pinpoint entries in hindsight - but the point of this exercise is to understand these entries and understand why you didn’t take them. This will connect the dots in your brain and then in future, you have a higher chance of spotting these high-quality entries and actually taking them.
Looking at the chart above, one can clearly see the trending market i.e. the market runs and pulls back…runs and pulls back. So you want to get in on the trend at the pull back (at retracement levels).
These are not the only high-quality entries - there were some good sells with the break of the DT necklines (marked in black lines).
But these are sells in a bullish market, so your TP's will never run as far as buys in a bullish market.
A note about stop losses on Nasdaq – my advice is not to set actual stop losses on MT4 or MT5 for your trades because Nasdaq is so volatile that it can often spike you out. Unfortunately, you need to use mental stops and use judgement with stop losses and see how candles CLOSE, not how candles spike.
Once price has moved a significant distance away from your position, you can secure at entry and trade risk free.
Screen time with this index will help you get the "feel" of this
I learnt from this analysis and hope you did too 😊
All the best for March month trading!
TF = timeframe
TP = take profit
1H = 1 hour
4H = 4 hour
D = day
W = week
M = month
S&R = support & resistance
EMA = Exponential moving average
DT = Double Top
DB = Double Bottom

BEARISH ON NAS TO TAKE OUT WEEKLY EQUAL LOWS AT 17828.25BEARISH ON NAS TO TAKE OUT WEEKLY EQUAL LOWS AT 17828.25
Look for a pull back into 1 hour FVG to sell down to take out weekly lows, and potentially down to tap into FVG inside of 4H BPR
If we break below the 4H BPR we can potentially continue bearish to grab more SSL (Sell Side Liquidity)

NAS100 - Interesting buy zone!Hello everyone!
After the SL of yesterday, we are turning bearish on NAS100.
Also because we are having rumors that start confirm itself, rumor about the US debt, but also about the NFP that gonna be bad !
Technically, I've entered a buy position due to:
- 2 major liquidity uptakes.
- Buy zone created through accumulation.
- Strong reactions at the buy zone (Accu).
Now we just wait!
🚀 If you liked it and want more, don't hesitate to subscribe and boost the post!

Nasdaq Intraday Review - Thursday 7 Mar 2024I trade Nasdaq intraday exclusively
Trading in GMT time zone
Sharing my post day review and analysis in case it can help you!
Did my analysis at +- 5:20am GMT
From my previous post you will know that I had a buy position at D. running.
As the morning progressed, market came down and the long wick at E. took out my D. position because I had secured at entry.
Waiting to see price action, I entered a buy at C. - Confirmations:
Fib: DB formed on the 1H TF (not marked on the graph but clear to see on the 1H TF at E.) at the 4H 0,618 fib level + Week 0,382 fib level
Market pattern: DB formed on 1H TF and neckline broken
Candle sticks: Long wick bullish candle on 1H TF (at E.) + strong bullish momentum candle to break the neckline
S&R + EMAs: DB formed at strong Day support level + D EMA providing dynamic support roughly in this area too
Trend line: None specifically but position is in the same direction as the overall trend (bullish in this case) - the trend is your friend
SL: Placed roughly halfway into the height of the market pattern, marked by the thick purple line
Tp's were determine using the fib drawn on the 4H TF (swing low = A. and swing high at the time was B. - se A. and B. on 1H TF and ignore on 4H TF on graph)
TP1 - 18240
TP 2 – 18360
Market moved well in my favor, ultimately creating a DB on the 4H TF (marked in black lines) with a neckline break and so interesting that the profit target (i.e. the same distance as the height of the market pattern) lined up perfectly with TP 1
On the 1H TF, price broke through the temporary down trend blue line at F and then a small red candle to re-test, before moving up again.
Took partial profit at TP1 and Finally closed my full position right up close to TP2 when a double top formed on the 15min TF.
Ultimately market moved 3586 pips from my C. position and I closed out at 3300 pips.
It was a goooooooooooood day! :)
What could I have done differently?
Entered a much MUCH bigger position! Haha!
Hope you caught this buy!
Good luck for NFP trading - think I will stay out today.
TF = timeframe
TP = take profit
1H = 1 hour
4H = 4 hour
D = day
W = week
M = month
S&R = support & resistance
EMA = Exponential moving average
DT = Double Top
DB = Double Bottom

NAS100 Trade IdeaThe US100 index has retraced, entering a bullish 1D order block. Analysis of the prevailing trend on this timeframe indicates a clear bullish trajectory. I am eyeing a potential buy entry opportunity within at 61.8% Fibonacci retracement levels. Employing a risk management strategy, stops will be placed below the preceding low, while targeting the previous high and potentially beyond with the implementation of a trailing stop. However, it's imperative to note that trading carries inherent risks, and past performance is not indicative of future results. Therefore, traders should conduct thorough research and exercise caution before making any financial decisions.

Nasdaq Intraday Review - Wednesday 6 March 2024I trade Nasdaq intraday exclusively
Trading in GMT time zone
Sharing my post day review and analysis in case it can help you!
Did my analysis at +- 5:20am
On 5 March I entered buy positions at C.
Refer to that post for confirmations
Market moved up, breaking the 1H neckline and retesting the neckline at E.
Bulls pushed through all obstacles (i.e. various EMA's and pivot point)
Ultimately though, bears stepped in on sellers 0,618 fib level (at D.) and pushed down heavily
Bulls were unable to close above the 4H EMA - meaning that the 4H EMA will be a strong resistance on 7 March.
A large double top formed with neckline and profit target (height of the market pattern) marked in black lines
Bears broke the neckline down, with a neckline retest at F. and market pushed down further.
Ultimately market moved 2594 pips from my entry and I closed half my position in the region of F. (1344 pips)
Reason for closing at F. = bearish market pattern with neckline break
The remaining half of my position will be left running and hope that NFP will buy tomorrow, otherwise I will be taken out at entry.
I suspect that market may be weird today as we approach NFP tomorrow.
What could I have done differently?
No very happy with the pips I grabbed. I feel I should have closed out more pips since market moved so high.
Looking at the 30min chart, there is a clear DT (at D.) and I should have taken profit at break of this neckline
This would have meant I would have secured 630 pips more
Bulls were so strong throughout the day and I was hoping that buyers would step in again at the 1H EMA.
But a double top on the 30min TF at a seller's 0.618 fib level cannot be ignored!
Happy Trading! :)
TF = timeframe
TP = take profit
1H = 1 hour
4H = 4 hour
D = day
W = week
M = month
S&R = support & resistance
EMA = Exponential moving average
DT = Double Top
DB = Double Bottom

NQ SellsMarket Maker Sell Model
We're In 2nd Stage Distribution ,
And we have Sellside Liquidity Resting.
Would like to take a short from that FVG .

Is Nasdaq finally done?Two weeks ago, I mentioned the possibility of a significant correction for PEPPERSTONE:NAS100 , suggesting that the index could drop to as low as the 16k zone. As always, navigating uncharted territories, particularly at all-time highs (ATHs), presents challenges in determining price levels and timing trades. However, I now have a reference point, which is yesterday's high.
From a technical perspective, as I've mentioned previously, we're observing a rising wedge pattern, typically indicative of a reversal, coupled with indicators showing divergence.
In conclusion, in my opinion, we have reached a peak for now, and PEPPERSTONE:NAS100 is likely to enter a correction phase.

Nasdaq Intraday Review - Monday 4 March 2024I trade Nasdaq intraday exclusively
Trading in GMT time zone
Sharing my post day review and analysis in case it can help you!
Did my analysis at +- 5:20am (just before 1am EST)
Looking exclusively for a buy because "the trend is your friend"
During analysis noted the following:
Price consolidating in a triangle on 1H (marked by blue circle)
I feel the market will retrace today
Two interest zones identified
Zone 1:
Area of confluence because -
Pivot point
4H 0,382 fib level (fib drawn from swing low at A to swing high at B)
Market pattern - Just past profit target if a double top forms; market tends to reverse at or near profit target to re-test the neckline. I like being part of a re-test that is the same as the overall trend (bullish in this case)
Zone 2:
Area of confluence because -
4H 0,618 fib level
D 0,382 fib level
4H EMA (was in this region at time of analysis and throughout the day)
I set buy limits at each zone as follows:
A smallish buy position at Zone 1, because for me the confirmations are not soo strong and it really depends on price action so I will judge the market sentiment based on candles to see if I add more
A large buy position at Zone 2, because these are strong confirmations and price should at least bounce from here.
Ultimately a DT did form and break the neckline down. But market was very slow and none of my zones of interest were triggered.
In the evening, I cancelled my buy order in Zone 1 because I felt market was very slow and I wouldn’t get the reaction that I wanted in this area.
Clearly, investors are waiting for the inflationary data this week.
What could I have done differently?
Nothing
Hope you had a good trading day! :)
TF = timeframe
TP = take profit
1H = 1 hour
4H = 4 hour
D = day
W = week
M = month
S&R = support & resistance
EMA = Exponential moving average
DT = Double Top
DB = Double Bottom

Nas100- Bulls should be very careful (2k P drop could be next)Since the low at 14k at the end of October, PEPPERSTONE:NAS100 has risen strongly, reaching a high at 18k.
More importantly, this translates into a 30% increase, which is substantial within such a short time frame.
Upon closer examination of this upward movement, we observe that it is contained within a rising wedge, which typically signals a reversal. Additionally, Friday's candle formed a bearish engulfing pattern, and yesterday we witnessed a break of the rising trend line. If we consider the divergences on MACD and RSI, the overall picture is far from bullish.
In the short term, we notice the index resting on horizontal support, and a break here would provide the necessary confirmation of a temporary peak at 18k.
In this scenario, a decline to 17k is highly probable, but in my opinion, this decline will extend to 15800k support.
And, let's be honest, after a 30% increase, a 10% decline is not a tragedy; in fact, it is a normal market "adjustment."

NAS100
simple trading - follow the trend
A very bullish market always needs a pullback. What a great Head and Shoulders pattern for a reversal to the downside. NAS100 has officially broken below all bullish trend lines on the Daily. NAS100 is looking to create more sell pressure. With NAS100 being at the top of its weekly trend, look for a correction. Massive sell if NAS100 cannot remain above the 4hr support zone.
BULLS :
Buy at 17588 4hr support,
If candles remain above this area and create bullish momentum, look for a target at 17661. A new higher lower should be a confirmation for continuation to the upside.
BEARS :
Wait for a retest to 17661 with bearish candles, Do NOT sell now but wait for a retest
*Previous sell opportunity:
17730
17665
This week's trading:
Look for NAS100 to consolidate and respect market support and resistance areas. Once the market has made a decision, then we trade!

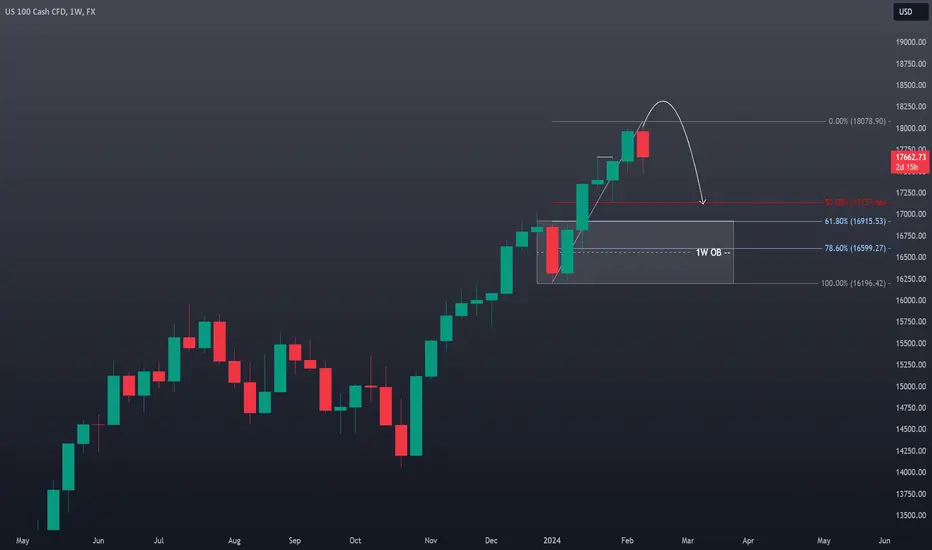
NAS100 Technical Analysis and Trade Idea - Full ExplanationMarket Observations: The #NAS100 has maintained a bullish trajectory. However, price action on the monthly timeframe suggest the #US100 is overextended. Additionally, the weekly chart reveals a double top pattern, hinting at a potential retracement down to the 50-61.8% Fibonacci levels. This area could provide the liquidity needed for major market players to fill long orders.
Trade Strategy: Consider an intraday/swing trade short entry following a potential stop run above the current range. Target an initial profit level around the previous lows near 17250, with a secondary target at 17000 (slightly above the 61.8% Fibonacci level on a 1W chart). Implement a well-placed stop-loss order to manage risk effectively.
Disclaimer: This analysis is based on my observations and does not constitute financial advice. Conduct your own independent research and carefully assess your risk tolerance before making investment decisions.

NAS100 Technical Analysis and Trade Idea
Market Observations: The #NAS100 has maintained a bullish trajectory. However, price action on the monthly timeframe suggest the #US100 is overextended. Additionally, the weekly chart reveals a double top pattern, hinting at a potential retracement down to the 50-61.8% Fibonacci levels. This area could provide the liquidity needed for major market players to fill long orders.
Trade Strategy: Consider an intraday/swing trade short entry following a potential stop run above the current range. Target an initial profit level around the previous lows near 17250, with a secondary target at 17000 (slightly above the 61.8% Fibonacci level on a 1W chart). Implement a well-placed stop-loss order to manage risk effectively.
Disclaimer: This analysis is based on my observations and does not constitute financial advice. Conduct your own independent research and carefully assess your risk tolerance before making investment decisions.
NAS100 Technical AnalysisThe #NAS100 has been on an upward trend, but a potential triple top pattern is forming on the chart. If the #DXY retraces further and rebounds from support, the #US100 could spike above the current high, potentially taking out buy-side stop-loss orders before pulling back down to the 61.8% Fibonacci level. Remember, trading the #NASDAQ involves significant risk. This analysis is just my opinion and shouldn't be considered financial advice.

NAS100 - MONDAY'S SMALL SHORT FOR BIG LONG! (TARGET 17265)As you might have noticed, the Nasdaq is on fire and I'm more of a reversal trader so times are harder. But, there is an old saying that states: "the trend is your ". I forgot the rest but I'll let you figure out the last word. So in homage of this old saying, we'll tighten our bullish running shoes and propose a setup that satisfies both camps. Here's what I see happening on Monday (29/01/2024):
What is on the chart? (follow the steps)
1) We have our liquidity target level which gave place to the continuation of the rally. So far so good for bulls, price is going up and their net worths too.
2) Our first reversal structure, with a low taken out and the high intact.
3) This is our retracement signal, confirming the market structure shift to the downside. This is paired with the fact that price broke the hourly Tenkan and Kijun + the Tenkan and the Kijun crossed over + breaking the Kumo + breaking the latest low. Additionally, the 4H Kijun and Tenkan reside within the 1H Kumo so those too were broken (not shown on the chart to promote clarity). These are reliable reversal signals. I am not trying to be a contrarian against the general trend but, this is how we spot general highs and lows. The daily is simply bullish so it's harder to spot a minor intraday opportunity such as this one.
4) This rejection confirms our reversal idea, and strengthens the probability of sellside liquidity getting taken out.
5) This is our final target, ideally the 1 Hour FVG. Again, on Monday anything can happen of course but this seems the most likely. I want these lows taken out before anything and, therefore we can short in anticipation of these lows getting taken out!
Most importantly, take some rest and have a great weekend! ;)

Nasdaq Intraday Review – Monday 29 Jan 2024I trade Nasdaq intraday exclusively
Trading in GMT time zone
Sharing my post day review & analysis in case it can help you :)
Did my analysis at +- 5:20am.
My feeling about today’s price action was that price would just consolidate as we all wait for this action packed week to kick off.
No amount of technical analysis will help – bears or bulls will step in depending on the earnings + guidance provided this week and FOMC.
My ideal plan would be to get a buy in as low as possible and then hopefully market would start pushing up in anticipation for the earnings on Tuesday. Then I would just hold as I expect earnings + guidance to be good and a further rally to ensue.
At time of analysis I noted the following:
Formation of a consolidation triangle (marked with turquoise lines)
Double top had formed on 1H TF (marked at yellow dot with purple lines), reached profit target (at B.) and now coming back to test neckline
Bears stepped in previously at A. (as seen by the red candles at A. on the 1H TF) but support of pivot point and 30min + 4H EMA was holding strong.
Turquoise uptrend line confirmed with 3rd touch and close above at B. therefore validating this uptrend line.
Green doji candle close on 1H TF at C.
I entered a buy at D. – confirmations:
S&R – price respecting 30min EMA well (when market is very bullish then this EMA is respected). When price started closing above the 1H EMA and 4H EMA, I knew that these EMA’s would not act as resistance.
Candlesticks – 1H green doji right on pivot point
Fib – none
Trendline – Turquoise uptrend line respected
It was an aggressive entry as 1H neckline still had not been broken through, but I felt that if market was going to drop from the neckline, then it would have done so at A. already.
Due to aggressive nature of this entry, I entered only 20% of my usual position size.
Mental stop was placed at thick pink line.
Market moved up, I secured at entry but bulls could not break through the 4H neckline at E. on this attempt.
Unfortunately, market came back down to take me out at entry.
I decided to stay out as market was choppy.
Unfortunately, price eventually took off without me. So I missed out on the move that I was anticipating and hoping for.
But Nasdaq is never short of entry opportunities, and I live to trade another day.
Hope you caught the buy!
What could I have done differently:
I should have set a buy limit at B. the night before, because price had not travelled the full distance as the height of the market pattern at the yellow dot.
This would have been such a great level to enter and hold for earnings!
Next time ;)
TF = timeframe
TP = take profit
1H = 1 hour
4H = 4 hour
D = day
W = week
M = month
S&R = support and resistance
EMA = exponential moving average

NAS100 | The continued rip and runNAS100 has been on a beautiful tear to the upside. The question is can it still continue?
If so, the best price to continue buying above is 17,300.80.
Why this price?
This is where the buyers push price back up before continuing the increase of price up to 17,687.20.
Price has now pulled back to provide a discount in price once again.
For this discount to remain valid buying above 17,300.80 is sensible.
What needs to be seen?
The evidence buyers can come show themselves, basically, price action candlesticks.
We can see price pushed off of structure(green line) before increasing. Now price is back at structure.
Again, we will need to see if the buyers can push price back up.
And again, price action is going to be the evidence or entering the trade upon open with the belief price can rise.
As Van Tharp states in his book Trading Beyond The Matrix , " we don't trade the markets we trade our beliefs."
My belief is price can rise if price doesn't strongly fall below the lower price of 17,300.80. If it does, this trade idea will be invalidated.
Should you trade this?
If you share the belief price will rise? Yes.
If you do not believe price will continue to rise? no.
Let's keep it that simple.
Like and share this trade idea ❤️
Shaquan

Nas100 HTF Analysis I expect Nas to reach 17k in the next few weeks. Nas has been pushing up relentlessly last few weeks so expecting ATLEAST a nice pullback. Once we hit 17k tho we could see all time highs again!


NAS100 - MY DAILY AND INTRADAY ANALYSES (TARGET 17300)Yes this is contrarian, markets are booming but it's quite overextended and going long at a top is the most monkey trader thing to do. I'll do a reverse analysis where I start with the intraday and follow up with the daily. So here's my take on things:
What's on the intraday chart? (Follow the steps)
1) A 4 hour bearish FVG. This will serve as my entry zone.
2) Our 'support line'. You'll notice price keeps on making lower lows.
3) Our liquidity target. This is the price magnet. We know for certain (discretionary) that price will take this out.
4) The entry point. Again, do your own research. Do not follow the analysis from some random stranger on the internet and go all in (you degenerate).
5) The intraday target. The order of things matter. If we hit this before hitting the short entry then you might wanna reverse the idea but I do not like the idea of longing in an overextended market!
What's on the daily chart? (Follow the steps)
1) The previous all time high that was violently broken.
2) Our swing extension target area. This is great to know where to take partials or close entire positions in new price territories. Of course price can always go further towards 2 or 2.618 or anything else (it's up to you where you wanna take partials).
3) The bearish candle pattern: kind-of a mix between a gravestone, a spinning top, a shooting star and whatever other label I can muster to justify my bias lol. To me this is the main driver of the bearish bias!
4) Maximum target. I do not see price going any lower and the intraday target is more sane so I don't really expect price to go that low either.
5) The continuation of the rally. People love buying. I do not see that changing anytime soon.
As always, have a lovely day and happy trading! ;)

Nasdaq Crash Loading - The Black Swan The current state of the NASDAQ indicates an extreme overbought condition, with a rally influenced by speculation surrounding six potential rate cuts in 2024. However, the risk arises from the Federal Reserve's concern about inflation. If the Fed, in response to persistent inflation, opts to raise rates, it could lead to a market decline. Conversely, a decision to cut rates may not be sufficient to buoy the stock market if the number of cuts is lower than expected.
Examining current fundamentals, the housing market has stabilized with low prices and mortgage rates. Although there is a rebound, a potential increase in housing speculation and mortgage rates could prompt a reassessment. Improved employee wages contribute to consumer confidence against inflation.
President Joe Biden's initiatives, such as pausing student loan payments in November and plans to provide homes for 500,000 Americans, may stimulate housing demand, causing prices to rise. This could prompt a review of interest rates and a tightening of monetary policies.
While I maintain a long-term bullish outlook, anticipating a correction of at least 50%, it is prudent to reevaluate macroeconomic indicators at that point to determine whether to take profits or continue holding.

NAS100 Trade IdeaThe NAS100 experienced a substantial rally towards the end of last week, displaying signs of being significantly overextended. A retracement may be in store, particularly if the Dollar Index (DXY) maintains and strengthens its position, considering the general inverse correlation between DXY and US100. It is essential to emphasize that this analysis is provided exclusively for educational purposes and should not be construed as financial advice.
